INTRODUCTION
Terrestrial deposits frozen in permafrost can provide exceptional records of environmental and climatic change. Permafrost that aggrades incrementally as terrestrial deposits accumulate may preserve continuous archives of (1) organic material, recording past ecosystems; (2) ground ice, recording atmospheric and land surface conditions; and (3) sediments, recording geologic conditions. Such syngenetic permafrost is widespread in unglaciated terrain of northeast Siberia, central and northern Alaska, and northwest Canada, the former subcontinent known as Beringia (Hopkins et al., Reference Hopkins, Matthews, Schweger and Young1982). Here, continuous terrestrial sedimentary sequences have the potential to provide long (104–105 yr) and relatively well-resolved temporally (103 yr) paleoenvironmental and paleoclimatic records (e.g., Sher, Reference Sher1997; Sher et al., Reference Sher, Kuzmina, Kuznetsova and Sulershitsky2005; Murton et al., Reference Murton, Goslar, Edwards, Bateman, Danilov, Savvinov and Gubin2015; Porter et al., Reference Porter, Froese, Feakins, Bindeman, Mahony, Pautler, Reichart, Sanborn, Simpson and Weijers2016) that elucidate landscape responses to or impacts on larger-scale environmental forcing.
One promising sequence of permafrost deposits is found at Batagaika, in the Yana Uplands of northern Yakutia (Fig. 1), where the largest known retrogressive thaw slump in the world (a megaslump) exposes a remarkable stratigraphic sequence ~50–80 m thick. Here, we report the results of a reconnaissance study of the Batagaika deposits that outlines their stratigraphy, age, and potential paleoenvironmental significance. The aim of such “first-level” research is to determine the potential of the site for answering key questions related to Quaternary environmental and climatic change in northeast Siberia. For example, the stability/variability of the Karga interstade (Kind, Reference Kind1974; Marine Oxygen Isotope Stage [MIS] 3 equivalent) is a topic of continuing interest (Voelker and Workshop participants, Reference Voelker2002; Lozhkin and Anderson, Reference Lozhkin and Anderson2011). More generally, information can be gained on the response of landscapes and biota to a range of warm-to-cold environmental conditions. Our preliminary study suggests an age of MIS 5–1 or MIS 7–1 for Batagaika and possibilities for a detailed paleorecord.
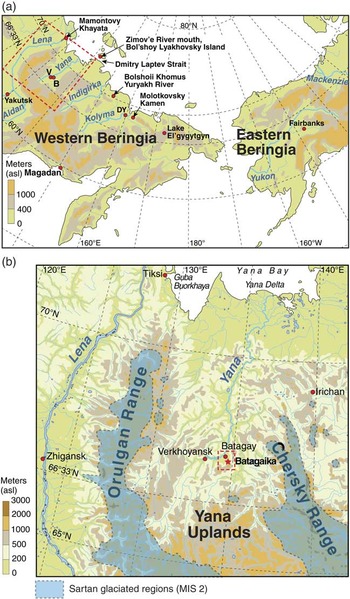
Figure 1 Location maps of the Yana River in western Beringia (a) and Batagaika within the Yana River basin (b). B, Batagaika; DY, Duvanny Yar; V, Verkhoyansk. Glaciated regions during the Sartan glaciation (Marine Oxygen Isotope Stage [MIS] 2) in panel b are based on Glushkova (Reference Glushkova2011). Red dashed boxes in panels a and b indicate locations in Figure 1b and Figure 2a, respectively. (For interpretation of the references to color in this figure legend, the reader is referred to the web version of this article.)
REGIONAL LATE PLEISTOCENE HISTORY
Glaciation during the last 50,000 yr
Glaciation during the Sartan stade (MIS 2 equivalent) is thought to have been limited to valleys within the Chersky and Orulgan Ranges to the east and west of the Yana Uplands, respectively (Fig. 1b; Glushkova, Reference Glushkova2011). However, Stauch and Lehmkuhl (Reference Stauch and Lehmkuhl2010) concluded that the central Verkhoyansk Range, which includes the Orulgan Range, was ice free during MIS 2 and that the last glaciation occurred at least 50 ka ago, based on infrared stimulated luminescence ages between 52.8 and 29.5 ka from postglacial eolian deposits and on landform relationships. These results represent minimum ages for glaciation but are in line with conclusions of Siegert et al. (Reference Siegert, Schirrmeister and Babiy2002), who suggested that the northernmost Verkhoyansk Range has been ice free over at least the last 50,000 yr. Stauch and Lehmkuhl (Reference Stauch and Lehmkuhl2010) further suggested that the drying of eastern Siberian climates during the last glacial cycle was caused by the growth of Eurasian ice sheets and consequent alteration of hemispheric circulation patterns. Given this paleoclimatic reconstruction, conditions were probably too dry to support glacier growth in the nearby Chersky Range. Although there is some disagreement in these glacial studies, they all conclude that the Yana Uplands remained ice free at least during a significant part of the Late Pleistocene. Thus Batagaika has the potential to encompass a long-term record of environmental changes, at least over the last 50,000 yr.
MIS 3 sequences in western Beringia
The Molotkovsky Kamen site in the Kolyma lowland (Fig. 1a) was long considered the type site for MIS 3 in northeast Siberia, with (1) Larix and tree-Betula forest tundra 28,000–24,500 14C yr BP, (2) tundra 34,000–28,000 14C yr BP, and (3) Larix and tree-Betula forest 48,000–34,000 14C yr BP (Shilo et al., Reference Shilo, Baranova, Siderov and Lozhkin1987). However, reanalysis of the site suggested that these radiocarbon ages were too young. Interval (1) probably occurred sometime prior to 40,000 14C yr BP, whereas interval (3) is likely of last interglacial age (Sher et al., Reference Sher, Kuzmina, Kuznetsova and Sulershitsky2005). Data from other sections in the region and the continuous record from Lake El’gygytgyn (Fig. 1a) support the idea that MIS 3 in northern areas of northeast Siberia was a time of general climate stability characterized by treeless vegetation (Lozhkin and Anderson, Reference Lozhkin and Anderson2011 and references therein). However, these records (particularly Mamontovy Khayata, Fig. 1a; Kienast et al., Reference Kienast, Schirrmeister, Seigart and Tarasov2005; Sher et al., Reference Sher, Kuzmina, Kuznetsova and Sulershitsky2005), El’gygytgyn (Lozhkin et al., Reference Lozhkin, Anderson, Matrosova and Minyuk2007), and Bol’shoy Lyakhovsky Island (Wetterich et al., Reference Wetterich, Tumskoy, Rudaya, Andreev, Opel, Meyer and Schirrmeister2014) also suggest that interstadial climate was not monolithic; rather, the early interstade was characterized by dry but relatively warm conditions, and cooler and drier climates prevailed later in MIS 3. This pattern differs markedly from more southerly sites in northeast Siberia, where numerous climate/vegetation fluctuations occurred, with modern or near-modern conditions (including Larix forest) being intermittently established during mid-MIS 3 (Lozhkin and Anderson, Reference Lozhkin and Anderson2011). The Late Pleistocene stratigraphy for northeast Siberia is not completely resolved. For the region’s northern tier, where interpretation relies mostly on discontinuous section data, there is a clear need for additional, higher-resolution sites to assess (1) the reality of the proposed north–south differences in interstadial climate and (2) the extent to which northeast Siberia experienced the prominent high-frequency MIS 3 variations that characterize the ice-core and Atlantic Ocean records (Bradley, Reference Bradley2015).
One of the key sites for understanding the Late Pleistocene of the northern lowlands is Bolshoii Khomus-Yuryakh (Fig. 1a). Two terraces along the Bolshoii Khomus Yuryakh River (Fig. 1a) probably encompass MIS 3 through MIS 5 deposits (Lozhkin and Anderson, Reference Lozhkin and Anderson1995). The upper, younger 24 m terrace contains two horizons with Larix stumps in growth position, with the lower horizon also including Larix cones (Lozhkin and Anderson, Reference Lozhkin and Anderson1995). A fragment of a tusk of Mammuthus primigenius found in an intercalated sand layer confirms a general Late Pleistocene age for this lower horizon. Associated radiocarbon ages are 41,200±2000 (SOAN-631) and 28,050±250 (SOAN-792) 14C yr BP, indicating a MIS 3 age. The large standard errors, particularly of the 41,200 14C yr BP age, might lend support to Sher’s (Reference Sher1991) argument that radiocarbon ages in pioneering studies at least should be questioned, if not discarded, and that all Late Pleistocene horizons indicative of warm and forested conditions belong to MIS 5. However, the different stratigraphic characteristics (e.g., presence/absence of syngenetic ice wedges and ice-wedge pseudomorphs) suggest that the wooded horizons in the older (see next paragraph) and younger terraces at Bolshoii Khomus-Yuryakh did not develop under the same environmental conditions (Lozhkin, A.V., unpublished data). If both terraces are of MIS 3 age, this site provides evidence of interstadial climatic variability with at least two warm periods.
MIS 5 sequences in the Yana-Indigirka region
The older, 31-m-high terrace at Bolshoii Khomus-Yuryakh includes a sandy unit with graminoid-dominated pollen spectra characteristic of herb tundra and that overlies the MIS 5 unit. A second sand unit is crosscut by ice-wedge pseudomorphs, within which alternating layers of peat and sand occur. Larix trees have been found in growth position within the cryogenic structures. Pollen samples from the pseudomorphs suggest the presence of Larix forest perhaps with tree Betula and limited occurrence of Picea within the valley. Larix is a highly underrepresented pollen type, and even trace amounts of its pollen are taken to indicate trees at the sampling site. P. pumila shrub tundra likely characterized mid elevations. The deposits containing evidence of forest therefore likely represent MIS 5, and those featuring herb tundra MIS 4.
Other sites of likely MIS 5 age within the Yana lowland and middle Yana drainage feature alluvium characterized by pollen assemblages indicative of open Larix-Betula forest with an understory of shrub Betula, Alnus, and P. pumila (Lozhkin and Anderson, Reference Lozhkin and Anderson1995). Alluvium and peaty deposits of the lower Indigirka valley assigned an interglacial age also reflect the establishment of closed Larix-Betula forest and are probably (although not definitively) associated with MIS 5e. Paleobotanical data from these sites suggest the northward expansion of forest into a region that today is dominated by tundra. A richer forest, which included Picea and Pinus sylvestris, was established in the upper Indigirka valley during the last interglaciation, and, given the similarities to the Yana drainage, it is reasonable to expect these species may have been established near Batagaika.
In the far northern region of the Dmitry Laptev Strait coast (Fig. 1a), Wetterich et al. (Reference Wetterich, Tumskoy, Rudaya, Kuznetsov, Maksimov, Opel, Meyer, Andreev and Schirrmeister2016) reported far harsher climatic conditions during MIS 5, with no hint of local forest. All pollen spectra are dominated by graminoids plus low amounts of Betula and Alnus, indicating predominantly herbaceous tundra, perhaps with some shrub components. The authors inferred, however, that Larix tree line was probably located nearer the modern coast during the last interglacial maximum as compared with today (Wetterich et al., Reference Wetterich, Schirrmeister, Andreev, Pudenz, Plessen, Meyer and Kunitsky2009). In contrast, Kienast et al. (2011) suggested that the MIS 5 vegetation was characterized by a mosaic of open Larix–Alnus incana forest, Duschekia-Betula shrub tundra, and meadows.
SITE DESCRIPTION
Batagaika (67°34′49.8″N, 134°46′19.3″E) is located 10 km southeast of the town of Batagay, in the Verkhoyansk region of northern Yakutia (Fig. 1b). The site lies on a northeast-facing hillslope ~1.5 km downslope of a col between Mount Kirgilyakh and Mount Khatyngnakh (Fig. 2a). The elevation of the ground surface on the uphill side of the site is ~290 m above sea level (asl). The hillslope has a gradient of ~3° (determined from Fig. 2a) and leads down into the floodplain of the Batagay River, a right-bank tributary of the Yana River. Several gullies dissect the hillslope, one of which has developed into the Batagaika megaslump. The megaslump exceeds 81 ha in area and is up to 800 m wide and up to 86 m deep (Fig. 2; Günther et al., Reference Günther, Grosse, Wetterich, Jones, Kunitsky, Kienast and Schirrmeister2015). The slump floor is dominated by badlands topography formed by thermal erosion and gullying during summer. A major gully system drains the slump floor, leading downslope toward the Batagay River (Fig. 2).
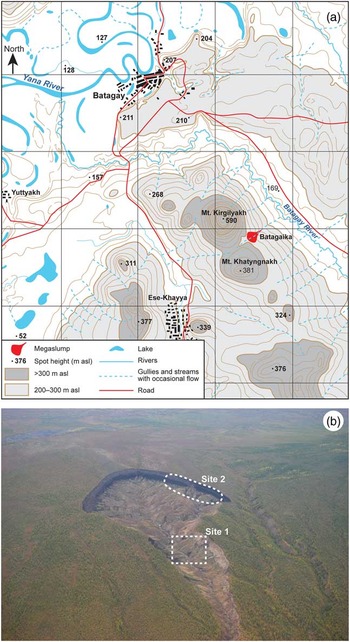
Figure 2 (color online) (a) Topographic map of Batagaika region. Contours at 20 m intervals, grid spacing at 4 km. (b) Photograph of megaslump, looking southwest, showing location of sites 1 and 2. The maximum width of the slump is ~800 m. Photograph taken in 2015 by Alexander Gabyshev.
The regional climate is strongly continental. The mean annual air temperature is −15.4°C, and the mean annual precipitation 170 to 200 mm (Ivanova, Reference Ivanova2003). The prevailing wind is from the southwest in winter (January) and from the north or northeast in summer (July). Permafrost in the Yana River valley is continuous, with mean annual ground temperatures at the top of permafrost of −5.5°C to −8.0°C. The active layer is 0.2–0.4 m thick beneath forest and moss cover, and 0.4–1.2 m beneath open sites. The Yana-Indigirka region is characterized by open forest dominated by larch (Larix cajanderi), with ericaceous shrubs and a lichen-moss ground layer. In openings and above the tree line in the uplands, shrubs of birch (Betula middendorffii), alder (Duschekia fruticosa), and P. pumila occur. Chosenia arbutifolia and Populus suaveolens form stands on river floodplains.
The bedrock at Batagaika is siltstone (aleurolite) and soapstone of Triassic (Noriysk) age, which have undergone low-grade metamorphism. We observed dark-gray siltstone in a meltwater channel in the slump center and on the col crest ~2 km to the southwest.
The permafrost deposits exposed in the slump have been distinguished as ice-rich sand (~60 m thick) beneath yedoma sandy clays (~20 m thick) and capped by sandy colluvium (~1 m thick; Kunitsky et al., Reference Kunitsky, Syromyatnikov, Schirrmeister, Skachkov, Grosse, Wetterich and Grigoriev2013). Kunitsky et al. attributed the thick sand unit to periglacial alluvial deposition during the Pliocene Epoch, and the yedoma sandy clays to deposition by meltwater from snow patches on gentle slopes. In contrast, Ashastina et al. (Reference Ashastina, Schirrmeister, Diekmann and Kienast2016) interpreted the sand unit as eolian. In addition, a prominent organic-rich layer up to 2 m thick, including abundant woody remains, has been identified between the sand unit and the overlying ice complex (Ashastina et al., Reference Ashastina, Schirrmeister, Diekmann and Kienast2016; Kienast et al., Reference Kienast, Ashastina, Rudaya and Wesche2016; Murton et al., Reference Murton, Edwards, Anderson, Cherepanova, Goslar, Gubin and Korzun2016). The woody layer has been attributed provisionally to the last interglaciation (MIS 5), independently by Kienast et al. (Reference Kienast, Ashastina, Rudaya and Wesche2016) and by Murton et al. (Reference Murton, Edwards, Anderson, Cherepanova, Goslar, Gubin and Korzun2016), although a robust chronology for the site is needed to confirm this.
Vertebrate fauna from the site include both Holocene and Pleistocene remains. Two carcasses, of Equus lenensis and baby Bison priscus, were found in 2009 at the exit of the slump (site 1 in Fig. 2b), in permafrost sediments that cannot be stratigraphically related to those exposed in the headwall. The former provided a 14C age of 4450±35 14C yr ВР [GrA-48709], and the latter one of 8215 +45/−40 14C yr ВР [GrA-50838]. A nonfinite 14C age of >50,299 14C yr BP was obtained from remains of Dicrostonyx spp. (collared lemming) found, we believe, ex situ on the slump floor (Palkopoulou et al., Reference Palkopoulou, Baca, Abramson, Sablin, Socha, Nadachowski and Prost2016).
During three further expeditions to this site (2011–2013) we collected the humerus bone of the cave lion (Panthera spelaea), the skull of the Pleistocene wolf (Canis lupus), and plenty of bones and teeth of the woolly mammoth (Mammuthus primigenius, the dominant species), the Pleistocene bison (B. priscus), and the Pleistocene horse (E. lenensis) (Novgorodov et al., Reference Novgorodov, Grigorev and Cheprasov2013). The majority of the remains were found in the central part of the Batagaika locality on the ground surface, mainly alongside small streams issuing from the thawing headwall, but quite a lot of bones of mammoth, horse, and bison were found directly beneath the headwall. One mammoth rib we saw in situ in the upper part of the headwall, but we were not able to reach this find. In general, this locality contains a typical “mammoth fauna,” at least from the Karginian time of the Late Pleistocene (cave lion) until the Middle Holocene (horse carcass).
METHODS
Vertebrate remains and sediment samples were collected from two sites, site 1 in 2009 and 2011 and site 2 in 2013 and 2016 (Fig. 2b), to determine the sedimentological and paleoecological properties of different cryostratigraphic units. Analysis of sediment properties, pollen, spores, diatoms, phytoliths, and plant macrofossils provides a preliminary framework for interpreting the paleoenvironmental history. Four samples of wood and roots were 14C dated to provide a preliminary chronology of the sequence. Sample depths were measured from the 0 m datum at the modern surface of the hillslope.
Sediments
Chemical pretreatment of sediment before particle-size analysis comprised removal of organic material in a solution of 35% H2O2, followed by removal of carbonates in a solution of 10% HCl. Particle-size analysis was carried out by dry sieving and pipette analysis and simultaneously by laser diffraction. Pipette analysis involved comparison of samples with and without chemical pretreatment. Total organic carbon (TOC) was determined by oxidizing 0.5 g of sediment with potassium bichromate at 140°C. Calcium carbonate content was estimated by acidimetry. Organic content was also estimated by loss on ignition (LOI), by burning 1 g of the carbonate-poor sediment in a furnace for 1 h at 900°C. Thin sections from disturbed (thawed) sample material were prepared using Canadian balm and analyzed with optical microscope (Carl Zeiss Axioscope A1). Images were taken by Axiocam MR5 camera. Soil thin-section terminology follows that of Bullock et al. (Reference Bullock, Fedoroff, Jongerius, Stoops, Tursina and Babel1985) and Stoops et al. (Reference Stoops, Marcelino and Mees2010).
Pollen
Palynological samples were prepared following standard laboratory procedures for arctic sediments (Anderson et al., Reference Anderson, Andrews, Bradley, Brubaker, Edwards, Finney and Grootes1994), and palynomorphs were identified using a Motic-EF-PL microscope at 600× and 1000×. Plant taxonomy follows Czerepanov (Reference Czerepanov1995). Percentages of individual pollen taxa were based on a sum of identified and unidentified pollen. Spore percentages were calculated using the pollen sum. Subsums were determined using total pollen and spores. Samples were prepared, counted, and analyzed at the North East Interdisciplinary Research Institute (NEISRI).
Phytoliths
Phytoliths and other microremains were extracted from six samples (P-3-13, P-5/1-13, P-6-13, P-7-13, P9-13, and P-10-13) using wet oxidation and heavy liquid flotation techniques. Approximately 30 g of sample were used for each extraction. The microremains were extracted by dissolution of carbonates using hydrochloric acid oxidation and mechanical removal of clays and then separated from residue in a heavy liquid solution with a density of 2.2–2.3 g/cm3. Thereafter, the light fraction, including opal units (sponge spicules, diatoms, and phytoliths) and organic matter (moss and forb tissues, vascular tissue, spores, and pollen), was examined on slides in glycerine using optical microscope (Carl Zeiss Axiostar) at 200×–400× magnification. Images of sample material were taken by a Vega 3 Tescan electron microscope.
Diatoms
Samples for diatom analysis were treated using procedures described by Proshkina-Lavrenko et al. (Reference Proshkina-Lavrenko, Glezer and Makarova1974). Because of the paucity of valves, a heavy liquid (H2O:CdJ2:KI=1:1.5:2.25, specific gravity 2.6 g/cm3) was used to increase the diatom concentration. The total sample preparation was examined, and taxa were identified with Amplival Zeiss and Axioplan 40 light microscopes at 1000× using oil immersion. Sample preparation, identification, and analysis were performed at the Institute of Biology and Soil Science.
Wood
Samples of wood were collected from two horizons rich in woody debris. The wood was treated and thin sections prepared in the cross, radial, and tangential directions following procedures described in Blokhina and Bondarenko (Reference Blokhina and Bondarenko2016). Samples were identified at the Institute of Biology and Soil Science.
14C dating
Three samples of wood from sediment samples P-8-13, P1-11 top, and P1-11 were dated at NEISRI using a standard liquid scintillation method. Sediment samples P1–P10 were thawed at the University of Sussex, dried in an oven at 40°C, and then examined to determine if organic material was present. Fine rootlets were picked from sample P3-13 and submitted for accelerator mass spectrometry (AMS) 14C dating at Poznań Radiocarbon Laboratory. Details of the AMS dating are the same as those given by Murton et al. (Reference Murton, Goslar, Edwards, Bateman, Danilov, Savvinov and Gubin2015).
RESULTS
Cryostratigraphy and sedimentology
The permafrost deposits at Batagaika can be divided into six cryostratigraphic units (Fig. 3, Table 1). Unit thickness changes laterally in different parts of the slump headwall, and so approximate ranges of thickness are given.
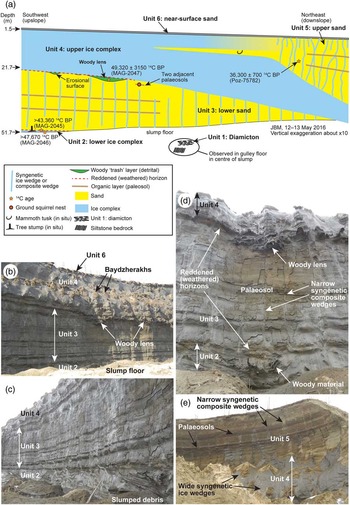
Figure 3 (color online) Cryostratigraphy of Batagaika sedimentary sequence. (a) Schematic cryostratigraphy. (b–e) Cryostratigraphic units 2–6.
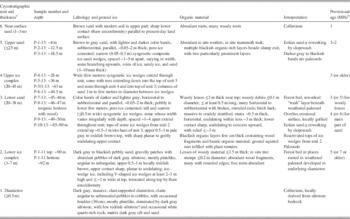
Table 1 Cryostratigraphic units, field description and provisional interpretation and age of the Batagaika sedimentary sequence.

a The lower value of thickness given was measured in May 2016, and the higher value is an estimate based on depths measured below the ground surface in 2011 and 2013, when the slump was smaller and the headwall in a different location.
b The first Marine Isotope Stage (MIS) number represents the most parsimonious interpretation of the chronology, and the number in brackets represents one, but not the only, alternative interpretation.
Unit 1 (diamicton) is a massive, clast-supported diamicton ≥0.5 m thick. Pebble- to cobble-sized clasts are mostly dark-gray siltstone, angular to subrounded (Supplementary Fig. 1). The matrix is dark-gray silt and sand. Unit 1 was observed along meltwater channels on the slump floor.
Unit 2 (lower ice complex) contains organic material with abundant siltstone clasts and wedge ice. It is the lowest unit (3–7 m thick) observed in the headwall at site 2 (Fig. 4) and was also observed at the base of the sequence at site 1 (Fig. 2). The mineral fraction in unit 2 is dark-gray to blackish pebbly sand. The wedge ice at site 2 is truncated along the top by a thaw unconformity, above which is a reddish-brown horizon 0.5–1 m thick. Lenses of woody material include in situ tree stumps (Fig. 4b), abundant wood fragments, and fine roots. Siltstone pebbles similar to those in unit 1 are common.

Figure 4 Lower ice complex (unit 2). (a) Woody debris within unit 2 and reddened (weathered) horizon along top. (b) In situ tree stump. (c) Organic layer with woody debris and numerous roots. (d) Close-up of organic layer, showing wood fragments and platy shale pebbles. (For interpretation of the references to color in this figure legend, the reader is referred to the web version of this article.)
Unit 3 (lower sand) comprises ~20–38 m of sand with light- and dark-gray bands that are horizontal to subhorizontal (Fig. 3). The 50–250 μm fraction (mostly fine sand to very fine sand) constitutes 77–82% (n=2) of the sediment; the 10–50 μm fraction (silt), 11–12%; and the <5 μm fraction (mostly clay), 3% (Supplementary Fig. 2). TOC values of 0.5–0.7%, LOI of 3.0–3.3%, and carbonate contents of 0.1–0.2% were obtained (Supplementary Fig. 2). Siltstone pebbles are common in the lower few meters of the unit. Tall and narrow syngenetic ice wedges (≤0.5 m wide), with a chimney-like morphology, are spaced ~1–4 apart throughout the unit. Blackish organic layers are interstratified in unit 3, and one buried ground squirrel nest was observed between two of them (Fig. 5c). Prominent lenses of woody debris ≤3 m thick in the upper few meters of unit 3 overlie a sharp (erosional) surface. The wood fragments are commonly ≤0.1 m diameter and ≤0.5 m long and are in places crudely stratified as mats of woody debris (Fig. 6). The upper 0.5–1 m of unit 3 forms a pale-gray to reddish-brown marker horizon similar to that at the top of unit 2 (Fig. 3d). Sample P-7-13, from the top of unit 3, is finer grained (23% silt) than the other two samples and has higher values of TOC (1.3%), LOI (5.0%), and carbonate (0.3%) (Supplementary Fig. 2).

Figure 5 (color online) Organic layers (paleosols) in lower sand (unit 3). (a) Blackish organic layer. (b) Close-up of cleaned section, showing two thin organic layers (ruler 30 cm long). (c) Ground squirrel nest filled with plant debris.

Figure 6 Lens of woody debris ≤3 m thick at top of lower sand (unit 3). Reddened (weathered) horizon along top of unit 3. (For interpretation of the references to color in this figure legend, the reader is referred to the web version of this article.)
Unit 4 (upper ice complex) is ~20–44 m thick and dominated by syngenetic ice wedges a few meters wide that enclose columns of sand 1 m to a few meters in diameter (Fig. 7). In the upslope (southwest) and central parts of the headwall, the ice complex forms a single unit (Fig. 7a). Downslope, toward the slump exit, unit 4 bifurcates (Fig. 3a), with the lower part plunging beneath unit 5 and the upper part grading, as its ice content diminishes downslope, into unit 5. Units 4 and 3 thicken toward the slump center. Sediment properties (n=2) are similar to those of unit 3 (Supplementary Fig. 2).

Figure 7 (color online) Upper ice complex (unit 4). Persons for scale in panel a. Panel a shows syngenetic ice wedges in unit 4 above sand of unit 3 in the southwest (upslope) part of the slump headwall. Panel b shows syngenetic ice wedges of unit 4 below sand of unit 5 in the northeast (downslope) part of the slump headwall.
Unit 5 (upper sand) is an apron of sand ≤25 m thick that thickens downslope in the sections observed (Fig. 3a). The sand is brown to light gray and contains color bands similar to those in unit 3. A single sample of sand has properties similar to those of units 3 and 4 (Supplementary Fig. 2). Narrow (0.05–0.3 m) syngenetic composite wedges crisscross the sand (Fig. 8a and b). Alternating veins of ice, sand, or sandy ice were observed near the toe of one wedge (Fig. 8c). Epigenetic ice wedges extend down a few meters into the upper part of the unit. In situ rootlets are pervasive throughout the unit, and multiple blackish layers occur in the sand near the slump exit (Fig. 3e).

Figure 8 (color online) Upper sand (unit 5) with syngenetic composite wedges (a and b). Note dark-gray (clear) epigenetic ice wedges at top of unit. (c) Close-up of sand veins and ice veins in composite wedge near the bottom of panel a. People for scale in panels a and b; finger in panel c.
Unit 6 (near-surface sand) is a horizon 1–3 m thick of brown, root-rich sand. The modern soil is developed in the top of the unit, and the base of the unit is marked by a thaw unconformity.
Micromorphological (thin section) and phytolith analysis
Micromorphological analysis was carried out on thin sections from six nearly undisturbed (thawed) samples (P-10-13, P9-13, and P-7-13 from unit 3; P-6-13 and P-5/1-13 from unit 4; and P-3-13 from unit 5; Supplementary Fig. 2). All samples are similar as regards soil mineral matrix, size and structure of skeletal elements, size and genesis of organic detritus, and products of organic matter transformation such as dark coatings and clots on sandy grains (Fig. 9; Supplementary Fig. 3). All samples contain small amounts of fine-grained groundmass and have a monic or gefuric structure—abundant grains of structureless silty sand with poorly developed coatings and single aggregates (Stoops and Jongerius, Reference Stoops and Jongerius1975). Rare microfossils are mainly present as decomposed, small (100–300 μm) root remnants. Otherwise, plant detritus is dominated by the remains of grasses. The detritus is strongly discolored, but the cellular structure is well preserved. There is no accumulation of humic substances around the plant remains (including thin roots), which indicates the active removal of organic matter from zones of formation and its subsequent redeposition on mineral particles. This feature is common in well-drained sandy soils.

Figure 9 (color online) Photomicrographs of thin sections: (a) Root path and humus coatings, sample P-7-13 (top of unit 3). (b) Complex microaggregate with humus-clayey groundmass, sample P-10-13 (bottom of unit 3). Both in plane-polarized light.
The skeletal fraction of the sediment comprises sand grains (~0.1 mm diameter) that are mainly angular, with rare rounded ones and some thin elongated crystals (Supplementary Fig. 4). Quartz and feldspar dominate the sand mineralogy, with isolated grains of mica. No lithic fragments of polymineralic rocks or features characteristic of active mineral weathering were observed. Many mineral particles have thin, light-brown coatings of Fe-oxides (Supplementary Fig. 3f). Some slightly rounded sand grains have dark coatings and clots of organic matter. Such grains are most abundant in sample P-7-13 (near the top of unit 3), which contains the highest value of TOC (1.3%) among the samples (Supplementary Fig. 2).
Sample P-10-13 (near the base of unit 3) shows evidence of clay groundmass and formation of complex microaggregates that include sand grains with thick organic coatings cemented with humus-clayic groundmass (Fig. 9b). Samples P-7-13 and P-10-13 are rich in fine amorphous platy detritus (100–200 μm). Other samples contain sporadic or even isolated fine microfossils of unknown origin within the mineral matrix.
Paleobotanical data
Palynological data
Herbaceous pollen taxa dominate samples from units 2–4 (Fig. 10), with Cyperaceae prevalent in unit 2 (site 1) and Cyperaceae and Poaceae in units 3 and 4 (site 2). Larix pollen occurs in all samples, with maximum values in unit 2 (≤22%). This trend also is evident in the greater percentages of tree and shrub pollen in the lower two samples (unit 2) as compared with the younger spectra. Unit 2 is also characterized by a greater variety and higher percentages of coniferous taxa; of particular note is the presence of P. pumila and Picea pollen. Percentages of Betula, Alnus, and Salix pollen are low but appear consistently throughout the record. Minor herb taxa are dominated by Ranunculaceae, Saxifragaceae, Primulaceae, and Papaveraceae. Individual spore taxa never exceed 10% and are mostly <5%. Spores of Polypodiaceae and Bryales are found in all units, whereas Lycopodium species, Sphagnum, and Selaginella rupestris occur only in units 3 and 4.

Figure 10 Pollen diagram of Batagaika sedimentary sequence. Samples 1–6 are from site 2: sample 1 is from unit 5 (18.5 m depth), samples 2 to 3 are from unit 4 (at depths of 43 and 44.5 m, respectively), and samples 4 to 6 are from unit 3 (at depths of 45–46, 49–50, and 80–85 m, respectively). Samples 7–8 are from site 1, unit 2: sample 7 is from the top (upper) buried soil, and sample 8 from the lower buried soil. Shaded curves represent a x5 exaggeration of selected pollen taxa.
Fossil wood
Wood collected from 46 to 47 m depth, near the top of unit 3, was identified as Larix based on xylotomical analysis of the wood anatomy.
Diatoms
Only in two samples (P-3/1-13 from unit 5 and P-9-13 from unit 3) were valves in good enough condition to allow probable identification to the marine genus Stephanopyxis. The absence of unbroken diatom valves and the rarity of valve fragments suggest that the sediments are likely of eolian origin (i.e., the diatoms could not be poorly preserved taxa growing in situ within lakes, bogs, or streams).
14C dating
We obtained four 14C ages in this study (Table 2). A finite age of 36,300±700 14C yr BP (Poz-75782) was obtained from in situ fine rootlets at 18.5 m depth in unit 5. The calibrated age using the IntCal13 calibration data set (Calib Rev 7.0.4 software; Reimer et al., Reference Reimer, Bard, Bayliss, Beck, Blackwell, Bronk Ramsey and Buck2013) is 39,400–42,100 cal BP (2σ). Another finite age (49,320±3150 14C yr BP, MAG-2047) was measured on a wood fragment near the top of unit 3 but is out of range of calibration. Two nonfinite ages were obtained on unidentified shrub material in unit 2.
Table 2 14C ages of samples analyzed in the present study.
14C ages of very old samples should generally be interpreted with caution (e.g., Pigati et al., Reference Pigati, Quade, Wilson, Jull and Lifton2007) because extremely small contamination with modern carbon may greatly affect the result of dating. The extensive 14C dating of the yedoma profile at Duvanny Yar (Fig. 1a), performed by the Poznan laboratory on the same type of material as in Poz-75782, gave a coherent series of reliable ages reaching back to ~44,000 14C yr BP (Murton et al., Reference Murton, Goslar, Edwards, Bateman, Danilov, Savvinov and Gubin2015), whereas the ages in the older sections (although measured as finite ones) were conservatively assigned as being nonfinite. For Batagaika, we are confident about the age of rootlets from unit 5, but we prefer to treat the extremely old 14C age of wood from unit 3 as nonfinite.
DISCUSSION
Sand source, transport, and deposition
The main source of sand in units 1 to 6 was probably a nearby floodplain. The dominance of angular sand grains (Supplementary Fig. 4) suggests a proximal sediment source, and the thin elongated crystals in the coarse-grained fraction are consistent with an absence of long-distance transport of mineral material before deposition. In situ cryogenic weathering of bedrock, as sometimes proposed for yedoma sequences (e.g., Konishchev, Reference Konishchev1973; Konishchev and Rogov, Reference Konishchev and Rogov1993), is discounted because the local siltstone bedrock cannot weather to produce quartz- and feldspar-rich sand. Instead, the sand was likely sourced from alluvial deposits of the paleo–Batagay River and/or paleo–Yana River. The modern Batagay River is located only ~2 km northeast and downslope of Batagaika, and the Yana River within ~10 km of the site. However, given the presence of marine diatoms in units 3 and 5, some finer, silty material may have been transported in suspension from exposed ocean shelves. Likewise, the presence of some slightly rounded grains of quartz and feldspar suggests that some sand grains may have been transported further than the local floodplain.
Sand transport and deposition were probably dominated by wind. Alluvial transport and deposition are unlikely because the location of Batagaika (on a ~4- to 5-km-long hillslope approximately midway between a col crest and a valley floor) realistically precludes development of a paleoriver system that could deposit an extensive sheet of sand tens of meters thick and ≥1 km wide. Such a system would need to have been much larger and extend far to the southwest of the col crest, but no river channel structures or current ripples were observed in the sands, despite excellent exposure. More generally, deposition in rivers, lakes, or bogs is discounted by the absence of freshwater diatoms and the poor preservation of the pollen. Instead, wind probably deflated sand from a floodplain and transported it upslope, mainly by saltation and modified saltation during dust storms, depositing it within a thick sand sheet. Sandy periglacial eolian deposits are common near sandy floodplains or other sandy sources (Wolfe, Reference Wolfe2013), and eolian sand transport by saltation from local sources has been observed during summer dust storms near Kluane Lake, southwest Yukon, Canada (Nickling, Reference Nickling1978). The lack of evidence for gullying in cross section suggests that sand redistribution by overland flow (Kunitsky et al., Reference Kunitsky, Syromyatnikov, Schirrmeister, Skachkov, Grosse, Wetterich and Grigoriev2013) remained limited.
Pedogenic processes
All samples show features of pedogenic processes that took place in relatively warm conditions in which the humic substances that formed were mainly mobile. The presence of Fe-oxide coatings indicates a regime of periodic moistening and drying and subsequent warming of dry sandy soil. Two reddened horizons (one at the top of unit 2 and the other at the top of unit 3) represent weathering marked by oxidation, and they are broadly associated with the two forest beds. These two well-developed paleosols may represent relatively long-term periods of stable climatic conditions of interglacial stages with no active deposition of mineral material. Figure 6 shows a reddened horizon (sometimes with pale zones in it) and a black, presumably organic-rich, layer above. Modern pedogenic processes typically form soils with pale and reddened horizons (i.e., incipient Spodosols) on sandy sediments in northern boreal forests.
Vegetation and biostratigraphy
Only general conclusions can be drawn from the current data because the sampling is uneven, resulting in an irregular and broad spacing of the pollen spectra.
Unit 2
The two spectra from unit 2 (at site 1) are assumed to be older than the other Batagaika pollen samples, based on their depth from the surface. The unit contains high amounts of Larix pollen (>20%), plus small amounts of other conifer pollen, particularly Picea and Pinus pumila (Fig. 10). Rubus chamaemorus, Sanguisorba, and Apiaceae are present only in sample 8. Graminoid (Poaceae and Cyperaceae) values are comparatively low. The high pollen percentages of Larix and presence of Picea (the modern range limit of Picea obovata is along the Lena valley to the west of Batagaika) indicate warm (i.e., interglacial) conditions and, together with the low values of graminoids, a forested landscape. The importance of trees on the landscape also is illustrated by the presence of in situ tree stumps in unit 2 (Fig. 4b). The presence of Larix and P. pumila suggests mean July, January, and annual temperatures of at least 12°C, −34° C, and −11.6°C, respectively (Andreev, Reference Andreev1980; Kozhevnikov, Reference Kozhevnikov1981). Furthermore, the occurrence of P. pumila indicates sufficiently deep snows to protect the evergreen shrub from low winter temperatures. Minor taxa, such as R. chamaemorus, Sanguisorba, and Sphagnum, reflect the existence of moist substrates. A possible modern analogue for this vegetation occurs in the Aldan basin ~500 km to the south (Fig. 1a). Here, the forest contains Betula alba, P. obovata, and Larix sibirica, but P. sylvestris is present, rather than P. pumila. Despite warm and snow-rich pollen signals from unit 2, ice wedges also within it suggest “nonpeak-interglacial conditions,” possibly because of climatic or environmental variability during the formation of unit 2.
Sample 7 represents a transitional assemblage between sample 8 and samples from units 3 and 4. It has higher Cyperaceae percentages, similar to the upper spectra, but still a significant contribution of Larix, Picea, and P. pumila. Higher herb pollen values and lower tree pollen values indicate a more open, but still wooded, landscape.
Units 3–5
The pollen assemblages from units 3–5 (site 2) are similar, depicting little in the way of vegetation change at this scale of sampling. They are dominated by herbaceous taxa (~70–80%), but all contain some Larix and small amounts of the shrubs Betula, Alnus and Salix, and the subshrub Ericales. The high herb percentages indicate an open tundra landscape, and the taxa represented have ecologies from mesic to dry, as might be expected in an upland setting with small-scale topographic variation. The presence of Sphagnum and near absence of S. rupestris and Artemisa in most of these samples suggest this was not a cold, dry, full-glacial environment. The occurrence of Larix pollen indicates the tree’s presence at the site and likely on the surrounding landscape as the large and fragile nature of this grain prevents any long-distance transport by winds or water. Thus, this set of samples indicates intermediate (i.e., interstadial) climatic conditions.
Comparisons and correlations
The visual stratigraphy at Batagaika is striking, and based on this alone, three different hypotheses (age schemes) come to mind concerning the time periods represented by the section.
-
1. The upper part of the ice complex of unit 4 may represent the last glacial maximum, and unit 3 may correspond to part of MIS 3. This age scheme has some features in line with Haesaerts et al.’s (Reference Haesaerts, Chekha, Damblon, Drozdov, Orlova and Van der Plicht2005) reconstruction of 14 warm climatic episodes between 39,000 and 26,500 14C yr BP based on multiple paleosols within loess at Kurtak in southern Siberia. Unit 3 at Batagaika is also thought to contain multiple paleosols within eolian sediment, although of sand rather than silt.
-
2. The prominent lenses of woody debris near the top of unit 3 may represent an interval of strong warming and forest establishment. This stratigraphy has a parallel in loess deposits near Fairbanks, Alaska (Fig. 1a), where the Eva Forest Bed represents MIS 5e (Péwé et al., Reference Péwé, Berger, Westgate, Brown and Leavitt1997). At Batagaika, a significant phase of erosion (gullying) of the top of unit 3 preceded deposition of the woody trash layer, as also inferred for the Eva Forest Bed. Similar disorderly accumulations of woody detritus from the last interglacial in Yukon have been reported (Reyes et al., Reference Reyes, Froese and Jensen2010). The possibility that the trash layer is a thaw slump or other thermokarst deposit is consistent with the interpretation of warm interglacial conditions and reforestation.
-
3. Sand of unit 3, beneath the lenses of woody debris, may be of Middle Pleistocene age or older. The Batagaika stratigraphy, in which a prominent sand unit (3) is sandwiched above a thin ice complex (unit 2) and beneath a thick ice complex (unit 4), resembles that along the coast of the Dmitry Laptev Strait, notably at the Zimov’e River mouth on the southern coast of Bol’shoy Lyakhovsky Island (Fig. 1a). There, a silty sand unit termed the Kuchchugui Suite underlies a yedoma ice complex (or an older, MIS 5 Buchchagy ice complex; Wetterich et al., Reference Wetterich, Tumskoy, Rudaya, Kuznetsov, Maksimov, Opel, Meyer, Andreev and Schirrmeister2016) and overlies a buried ice complex termed the Jukagir Suite (Andreev et al., Reference Andreev, Grosse, Schirrmeister, Kuzmina, Novenko, Yu, Bobrov and Tarasov2004, Reference Andreev, Grosse, Schirrmeister, Kuznetsova, Kuzmina, Bobrov and Tarasov2009; Gilichinsky et al., Reference Gilichinsky, Nolte, Basilyan, Beer, Blinov, Lazarev and Kholodov2007). Both the sandy Kuchchugui Suite and the icy Jukagir Suite have been assigned to MIS 11–7 (390–220 ka) on the basis of collared lemming remains (Nikolskiy and Basilyan, Reference Nikolskiy and Basilyan2004). Although peat from the Jukagir Suite has provided a 230Th/U age of 200.9±3.4 ka (MIS 7) (Schirrmeister et al., Reference Schirrmeister, Oezen and Geyh2002), significant geochemical and isotopic uncertainties remain about applying uranium-series dating to anything other than corals and stratigraphically controlled speleothems (Muhs, D.R., personal communication, 2014). Andreev et al. (Reference Andreev, Grosse, Schirrmeister, Kuzmina, Novenko, Yu, Bobrov and Tarasov2004) assigned the overlying silty sand unit to a late Saalian (Kuchchugui) stadial ~170–130 ka (MIS 6). According to the most recent stratigraphy for the Dmitry Laptev Strait, by Tumskoy (Reference Tumskoy2012), the Kuchchugui and underlying Jukagir Suites are between ~200 and 127 ka. By contrast, a Late Pliocene or Early Pleistocene age for both suites has also been suggested (Arkhangelov et al., Reference Arkhangelov, Mikhalev and Nikolaev1996; Sher et al., Reference Sher, Kuzmina and Kuznetsova2002).
These hypothetical age schemes can be discussed based on our preliminary analyses of the Batagaika sequence, although rigorous testing awaits systematic investigations. First, a finite, Late Pleistocene age (36,300±700 14C yr BP) obtained from unit 5 (18.5 m depth) indicates that Batagaika minimally includes the last three MIS. This age was from in situ fine rootlets and is thought to indicate the age of their transition into the frozen state as permafrost aggraded upward into the sediment, as discussed in the context of syngenetic permafrost at Duvanny Yar (Fig. 1a; Murton et al., Reference Murton, Goslar, Edwards, Bateman, Danilov, Savvinov and Gubin2015). This interpretation is consistent with the general interstadial character of the pollen spectra from units 3–5, whose uniformity further suggests that Batagaika possibly encompasses an unusually thick interstadial deposit (scheme 1). The presence of a woody horizon near the top of unit 3 is additional evidence for the establishment of forest or forest-tundra and perhaps represents a mid–MIS 3 optimum that has been noted in more southerly sites. The units 3–5 pollen samples indicate a landscape that was generally open, with Larix probably limited to the most protected sites, a vegetation also inferred to have been present at Bolshoii Khomus-Yuryakh, to the northeast of Batagaika (Fig. 1a). The dominance of graminoid pollen and minor occurrence of woody taxa is characteristic of MIS 3 at Mamontovy Khayata, to the northwest of the study area (Andreev et al., Reference Andreev, Schirrmeister, Siegert, Bobrov, Demske, Seiffert and Hubberten2002). However, Larix is not present in the Lena delta, possibly reflecting spatial and/or temporal variability suggested for northeast Siberia during the last interstade (Lozhkin and Anderson, Reference Lozhkin and Anderson2011).
In terms of scheme 2, the 36,300 14C yr BP age from Batagaika is the only one currently in hand that can be safely assumed to be finite, which precludes firm dating of the underlying lenses of woody debris near the top of unit 3. Nonfinite ages occur in the lower parts of the section, and the age on wood taken from the organic horizon near the top of unit 3 (49,320±3150 14C yr BP) is almost certainly nonfinite. Consequently, evaluations of an MIS 5 or older age for unit 3 require indirect evidence. The nonfinite radiocarbon results certainly open the possibility that the upper unit 3 organic horizon is older than MIS 3 (e.g., MIS 5 or 7). The characteristics of the unit 2 spectra, particularly those of sample 8, indicate interglacial conditions, and these are succeeded upward by spectra indicative of less warmth, likely of interstadial age. Although not definitive given the sampling intervals, the transitional nature of pollen sample 7 suggests that a large temporal disconformity may not necessarily have occurred between units 2 and 3 and that the former unit possibly represents some portion of MIS 5. MIS 5 vegetation reconstructions based on section data from the Yana-Indigirka-Kolyma lowlands indicate the widespread presence of conifer-Betula forest (Lozhkin and Anderson, Reference Lozhkin and Anderson1995), but as mentioned previously, dating control is based on biostratigraphy and terrace location. Better age control is provided by the continuous Lake El’gygytgyn record. MIS 5 pollen assemblages from the lake have high percentages of Betula, Alnus, and at times P. pumila, but lack Larix (Lozhkin et al., Reference Lozhkin, Anderson, Matrosova and Minyuk2007). Although the absence of Larix pollen was initially thought to reflect the lake’s large catchment and the poor distribution and/or preservation of its pollen, Larix is common in spectra from some other core intervals, particularly during the Pliocene (Andreev et al., Reference Andreev, Tarasov, Wennrich and Melles2016). Thus, differences may not relate to pollen depositional issues. The presence/absence of Larix during MIS 5 at Batagaika/El’gygytgyn could represent elevational differences between ~290 and 490 m asl, respectively. Alternatively, they may reflect the far more open and windswept nature of the Chukchi Uplands surrounding Lake El’gygytgyn.
The third age scheme would require the presence of a significant disconformity beneath the lenses of woody debris near the top of unit 3, below which are considerably older sediments. Of the three proposed schemes, this seems least likely. For example, sample 8, although the “warmest” pollen spectrum at Batagaika, is not equivalent to any of the warm events of the Middle Pleistocene, in particular “super interglacials” such as MIS 11 (Melles et al., Reference Melles, Brigham-Grette, Minyuk, Nowaczyk, Wennrich, DeConto and Anderson2012), where Picea sect. Eupicea approaches 60% (Lozhkin et al., Reference Lozhkin, Anderson, Minyuk and Nedorubova2016). Another alternative is that the lower unit is from the Pliocene. Again, this interpretation seems unlikely as the Batagaika vegetation reconstruction is inconsistent with both the Tabalakh Series attributed by Vdovina (Reference Vdovina2002) and Lake El’gygytgyn, where the Pliocene spectra contain abundant Larix and Betula, with lesser Picea and Alnus pollen (Andreev et al., Reference Andreev, Tarasov, Wennrich and Melles2016).
If the interpretation of a predominantly MIS 3 age of the Batagaika section (age scheme 1 given previously) is correct, units 3 to 5 have the potential to reveal a detailed record of the environment of MIS 3 in northeast Siberia. Given the data in hand, this seems the most parsimonious age explanation. However, without further dating and analysis, the older age hypotheses (2 or 3 given previously) cannot be discounted, particularly given the large differences in physical stratigraphy that occur down section.
Scientific significance of the Batagaika section
If the proposed age model (1) for the Batagaika section is correct, the site may prove regionally critical to our understanding of MIS 3 variability. The high-frequency variability of MIS 3 in the Atlantic sector (e.g., Dansgaard et al., Reference Dansgaard, Johnsen, Clausen, Dahl-Jensen, Gun-destrup, Hammer and Hvidberg1993; Rohling et al., Reference Rohling, Mayewski and Challenor2003) and Europe (e.g., Huntley et al., Reference Huntley, Alfano, Allen, Pollard, Tzedakis, de Beaulieu and Gruger2003) represents a series of rapid readjustments of physical and biological systems to ice-sheet dynamics and consequent climate fluctuations. Eastward across Eurasia, the stage is manifest differently in the few sites that record the period. In southern Siberia, Hassaerts et al. (Reference Haesaerts, Chekha, Damblon, Drozdov, Orlova and Van der Plicht2005) reported high-frequency variation in loess sections, typically at millennial to submillennial scales. In the Magadan region (Fig. 1a), pollen data suggest that MIS 3 was characterized by numerous short (≤5000 yr) fluctuations in vegetation (Lozhkin and Anderson, Reference Lozhkin and Anderson2011). In contrast, sites in the northeast Siberian lowlands and in the Chukotka Uplands record two to three long (tens of thousands of years) periods of relatively warmer or cooler conditions (Yana-Indigirka lowland sites and Lake El’gygytgyn). However in the northern sites, sampling resolution is coarse, and it is unclear whether short-term fluctuations are absent or merely unresolved.
Although Batagaika is also a northern site geographically, it may have an unusually thick series of interstadial deposits with the potential to define the nature of MIS 3 conditions in the region. If this is the case, the visual stratigraphy suggests the stage was highly variable, with dynamic landscape changes taking place. In contrast, the small set of pollen samples is remarkably similar, but these are too few to draw firm conclusions about the vegetation variation that may have occurred as units 3 and 4 formed. Further work should resolve this ambiguity. The chronology can be enhanced by searching for cryptic tephra and use of luminescence approaches, and it should be determined if magnetostratigraphic analysis is viable. Whatever age scheme is eventually adopted, the presence of organic-rich layers, finds of mammal remains and ice-wedge ice indicate a potential range of proxy data that can contribute to paleoenvironmental reconstruction.
CONCLUSIONS
We draw the following conclusions about the Batagaika sedimentary sequence: Windblown sand, probably derived from an adjacent floodplain, accumulated incrementally on a hillslope nearby to thicknesses of several tens of meters over many thousands of years. Permafrost developed syngenetically in the aggrading sand sheet, producing numerous syngenetic ice wedges and composite wedges, and two ice complex units. The paleoenvironmental significance of the very high ice content of unit 4 (upper ice complex) is uncertain. Possibilities include changes in climate, eolian dynamics, or topography. A number of paleosols developed during times of reduced sand deposition, with the strongest soil development and weathering associated with two wood-rich horizons. Wood remains from the upper of two forest beds are tentatively attributed to interstadial conditions during MIS 3 (57–29 ka), with the lower forest bed indicative of interglacial conditions during MIS 5 (130–71 ka). An alternative interpretation is that both forest beds are of interglacial status, for example MIS 5 and 7 (243–191 ka), respectively. Sand deposits and paleosols between the forest beds accumulated during MIS 4 (71–57 ka) or, possibly, prior to MIS 5. High-resolution analysis of sediment core at Batagaika has the potential to provide a benchmark record of environmental conditions through an unusually thick sequence of MIS 3—or older—deposits in northeast Siberia.
ACKNOWLEDGMENTS
Research at the North East Interdisciplinary Scientific Research Institute was supported by grants to A. Lozhkin (Russian Foundation for Basic Research 15-05-06420; Russian Academy of Sciences, Far East Branch 15-I-2-067). Research at the Institute of Physicochemical and Biological Problems in Soil Sciences was supported by grants to S. Gubin (Russian Foundation for Basic Researches 15-04-03960a) and O. Zanina (Russian Foundation for Basic Researches 15-05-07686a). We are grateful to Nadia Noeva for translation. We thank two anonymous referees, Thomas Opel and editors Wyatt Oswald and Nicholas Lancaster for their valuable comments on an earlier version of the manuscript.
Supplementary material
To view supplementary material for this article, please visit https://doi.org/10.1017/qua.2016.15