


Introduction
The subject of sustainability has interested scholars at least since the 1983 Brundtland Commission report; the concept of sustainable agriculture became prominent soon thereafter. Over many decades and regions of the world, studies have researched under which conditions farmers adopt sustainable practices. Research on internal conditions has focused primarily on farmer motivations and capacity, while studies examining the external conditions often examine the role of non-profit outreach, the technical assistance sector and public policy (Fujisaka, Reference Fujisaka1994; Glenna, Reference Glenna1999; Gielen et al., Reference Gielen, Hoeve and Nieuwenhuis2003; Lee, Reference Lee2005; Kemp et al., Reference Kemp, Nijhoff-Savvaki, Ruitenburg, Trienekens and Omta2014; Serebrennikov et al., Reference Serebrennikov, Thorne, Kallas and McCarthy2020). More recently, multistakeholder initiatives (MSIs) have emerged as a strategy to use performance metrics to improve supply chain sustainability (Ponte, Reference Ponte2014; Freidberg, Reference Freidberg2017). MSIs are partnerships that bring together stakeholders from agrifood supply chains and civil society organizations, as well as independent experts (Tamm and Bostrom, Reference Tamm and Bostrom2010). Generally, MSIs have developed standards that regulate specific aspects of agriculture (Hatanaka et al., Reference Hatanaka, Bain and Busch2005), such as sustainability, but recently, there has been a shift by MSIs toward the development of metrics and promoting metrics programs (Freidberg, Reference Freidberg2017; Hatanaka et al., Reference Hatanaka, Konefal, Strube, Glenna and Conner2021). In brief, metrics are tools that farmers can use to measure and assess their operations (de Olde et al., Reference de Olde, Oudshoorn, Sørensen, Bokkers and de Boer2016). In this paper, we expand on previous research which focuses on coordinator and manager perspectives of MSIs by exploring farmers' experiences of participating in a leading MSI metrics program, Field to Market. Through survey and interview methodology, this paper examines farmers' motivations, perceived benefits and power dynamics within Field to Market's metrics program.
Literature review
Farmer adoption of sustainable practices
Previous studies that evaluate factors associated with farmer adoption of sustainable practices have typically focused on either internal or external influences. Internal factors include farmer values and motivations, as well as farm firmographics, farmer demographics and risk perceptions. External factors comprise policy, outreach and technical environments. The following sections detail previous research in each dimension.
In terms of internal factors, farmer values and motivations are prominent drivers of adoption in the literature. Not surprisingly, perceived economic benefits play a major role in studies across time and geography. Increasing profit, price premiums and/or cutting costs are common motives, as are obtaining licenses or marketing and branding advantages (Trujillo-Barrera et al., Reference Trujillo-Barrera, Pennings and Hofenk2016). Piñeiro et al. (Reference Piñeiro, Arias, Dürr, Elverdin, Ibáñez, Kinengyere, Opazo, Owoo, Page, Prager and Torero2020) emphasize the need for clear, short-term evidence of economic benefits. Another common theme is social benefits and altruism (e.g., peace, equality, social justice, respect for the earth, animal welfare). Farmers who have pro-environmental values are also more likely to adopt more sustainable practices (Glenna and Jussaume, Reference Glenna and Jussaume2007; Kemp et al., Reference Kemp, Nijhoff-Savvaki, Ruitenburg, Trienekens and Omta2014; Wensing et al., Reference Wensing, Carraresi and Bröring2019). Bopp et al. (Reference Bopp, Engler, Poortvliet and Jara-Rojas2019) find that intrinsic motivations are more effective incentives for adoption for those with pro-environmental attitudes, while those lacking these values need external rewards. Farm attributes also affect adoption. Larger farms (as measured by income and/or acreage) may be better able to adopt more sustainable practices due to more operating capital and better credit access (Shiferaw et al., Reference Shiferaw, Okello and Reddy2009; Kemp et al., Reference Kemp, Nijhoff-Savvaki, Ruitenburg, Trienekens and Omta2014). The extant literature provides more evidence of aforementioned motivational and situational factors than demographic factors of adoption; however, farmers' demographics influence the adoption of agricultural practices, particularly in sustainable production. Age, education, experience, gender and household income are also associated with sustainability (see Hoek et al., Reference Hoek, Malekpou, Raven, Court and Byrne2021 for review).
Adopting new practices can be seen as risky, but information about risks and benefits helps to mitigate these risks and increase adoption. Several studies find tolerance of risk associated with the likelihood of adoption (Trujillo-Barrera et al., Reference Trujillo-Barrera, Pennings and Hofenk2016; Dessart et al., Reference Dessart, Barreiro-Hurlé and van Bavel2019). Other studies find that knowledge, especially through efforts co-designed with research and outreach specialists, increases participation and efficacy of measures (Fujisaka, Reference Fujisaka1994; Gielen et al., Reference Gielen, Hoeve and Nieuwenhuis2003; Lee, Reference Lee2005; Kemp et al., Reference Kemp, Nijhoff-Savvaki, Ruitenburg, Trienekens and Omta2014). Observability and trialability of practices and their impacts decrease risk and increase adoption (Serebrennikov et al., Reference Serebrennikov, Thorne, Kallas and McCarthy2020).
Given the importance of information and risk abatement, the external (outreach and policy) environments significantly impact adoption. One study recommended that practices should be flexible, uncomplicated and supported by technical assistance (Piñeiro et al., Reference Piñeiro, Arias, Dürr, Elverdin, Ibáñez, Kinengyere, Opazo, Owoo, Page, Prager and Torero2020). Another argued that practices should address tangible problems identified by the farmers and have a clear, measurable benefit (Fujisaka, Reference Fujisaka1994). Many scholars cite the need for site-specific, farmer-co-designed ‘one size fits one’ practices that reflect the heterogeneity of farms and farmers' endowments, assets, skills and biophysical conditions rather than top-down ‘one size fits all’ regulations (Shiferaw et al., Reference Shiferaw, Okello and Reddy2009; Piñeiro et al., Reference Piñeiro, Arias, Dürr, Elverdin, Ibáñez, Kinengyere, Opazo, Owoo, Page, Prager and Torero2020).
MSIs have emerged as a leading form of private governance to advance food system sustainability in recent years. Despite widespread socio-cultural beliefs that farmers are inherently good stewards of the land (Calo, Reference Calo2020; Mock, Reference Mock2021), the structure of productivist agriculture means that farmers are systematically paid to extract value from land (Howard, Reference Howard2016). MSIs focused on sustainability recognize this tension between production and conservation and incentivize farmers to adopt sustainable practices and technologies. Whereas MSIs have tended to develop standards that farmers can get certified against, some sustainability MSIs have recently shifted to using metrics (Freidberg, Reference Freidberg2017; Hatanaka et al., Reference Hatanaka, Konefal, Strube, Glenna and Conner2021). Metrics differ from standards in that they do not specify requirements or benchmarks that farmers must comply with. Rather, they are tools that farmers can use to measure and assess their performance and then use the ensuing data to improve their practices (de Olde et al., Reference de Olde, Oudshoorn, Sørensen, Bokkers and de Boer2016).
Since MSIs represent a shift from government regulations to private-interest governance, these programs present new relationships of power and accountability (Cheyns and Riisgaard, Reference Cheyns and Riisgaard2014). Further, MSI programs may, regardless of what developers might have intended, introduce new inequities, similar to how federal subsidies disproportionately benefit farmers who are white men and large-scale commodity producers (Sachs et al., Reference Sachs, Barbercheck, Brasier, Kiernan and Terman2016). For example, agribusiness companies and downstream corporations often have more power in MSIs (Cheyns, Reference Cheyns, Ponte, Gibbon and Vestergaard2011; Fuchs et al., Reference Fuchs, Kalfagianni and Havinga2011). Since MSIs insert values, they also raise questions about whose values are inserted and how buyers may leverage sustainability metrics to indirectly manage on-farm decisions and practices, raising questions about how these programs function and how farmers perceive them.
Case: Field to Market
Field to Market is an MSI metrics program focused on commodity crop agriculture in the United States. It was started in 2006 by a handful of agriculture and environmental stakeholders and has grown to nearly 150 members. Today, its membership consists of stakeholders throughout agrifood supply chains and civil society organizations, including ADM, Bayer, Cargill, Coca Cola, Corteva, John Deere, National Corn Growers Association, Nestlé, PepsiCo, Unilever, Walmart, World Wildlife Fund, the Nature Conservancy and Environmental Defense Fund, as well as several land-grant universities and extension services. Field to Market aims to develop and implement ‘a common framework for sustainability measurement that farmers and the supply chain can use to better understand and assess improvement’ (Field to Market, 2016, 2). The idea is that measurement and assessment will ‘catalyze continuous improvement’ in farmer sustainability through identifying areas where farmers can improve their performance. Currently, Field to Market has 70 active projects across 4.5 million acres (Field To Market, 2021).
This study examines the experiences of U.S. farmers engaged in Field To Market's Fieldprint® Platform program. The Fieldprint® Platform is an environmental sustainability assessment framework that measures and assesses farmer environmental performance. To date, the Fieldprint® Program has developed eight metrics that are integrated into the program: biodiversity, energy use, greenhouse gas emissions, irrigated water use, land use, soil carbon, soil conservation and water quality (Field To Market, 2021). Typically, implementation occurs through Fieldprint® projects in which grower-facing stakeholders, such as commodity buyers, extension offices, or grower's associations, enroll local farmers. In the program, farmers submit field-level farm management information into the Fieldprint® software that computes metrics scores for each farm and shares them with the program coordinator. While program coordinators often provide technical assistance setting up the software program, the labor to input data and the data itself are the farmer's main contributions to the program. With the help of the software, the coordinators create reports that accumulate the metrics score for all farmers within their project. The accumulated scores are then used as benchmarks against which farmers can measure their sustainability performance. By identifying areas of underperformance, metrics and the resulting scores are meant to drive improvements and modifications of farming practices (Konefal et al., Reference Konefal, Hatanaka, Strube, Glenna and Conner2019; Hatanaka et al., Reference Hatanaka, Konefal, Strube, Glenna and Conner2021; Strube et al., Reference Strube, Hatanaka, Konefal and Conner2021). Fieldprint® projects have used a variety of incentives (e.g., premiums, educational opportunities, preferential access to services) and pressures (e.g., restricted market access) to attract growers.
Building on previous literature, we first examine factors behind farmer adoption of sustainable agriculture practices. Next, we look at emerging research on MSIs and digital data in the agrifood system. We then use interview and survey data to identify factors that impact farmers' motivations, perceived benefits and power dynamics within Field to Market's metrics program.
Methods
The research team conducted semi-structured interviews with farmers and administered a survey for farmers participating in the MSI metrics programs. Based on the literature, we posit the following dimensions and indicators of adoption (Table 1).
Table 1. Dimensions and indicators of MSI program adoption

Lists the dimensions and indicators of participants' satisfaction with the Fieldprint® Platform. We include variables for farm-scale, early adoption, motivations, external factors and perceived benefits. We use the results of interview and survey data to explore these relationships.
First, the research team conducted interviews with 11 farmers who either participate or had participated in Field to Market's metrics program. The research team identified initial interviewees through initiative documents (e.g., Field to Market websites and reports) and then used snowball sampling to identify additional participants, including project coordinators. The 11 farmers were part of two Fieldprint® projects in the Midwest. All interviewee names are pseudonyms. We used a set of open-ended questions and ad hoc follow-up questions to inquire about the farmers' experience of using sustainability metrics. In particular, we probed into their perceived benefits and costs of participation.
To complete qualitative analysis, the research team used NVivo to analyze the interviews. Following what Saldaña (Reference Saldaña2013) calls a provisional coding scheme, we transformed indicators from Table 1 into an initial, or provisional, coding list for the first round of coding. We used all variables listed under cited benefits and concerns as codes, as well as ‘likelihood of continuing participation’ and ‘satisfaction with the program.’ We followed the first round of coding, based on predeveloped codes, with the second round of coding, which expanded the provisional codes to allow for emergent codes including ‘relation with seller,’ ‘competition,’ and ‘defining sustainability.’ The codes were then evaluated based on farmers' perceptions and experiences of participating in Field to Market's sustainability metrics program. Farm characteristics were categorized by crops, acres and profitability.
For the survey portion, the research team designed a survey conducted in two phases using two platforms, Lime Survey and Qualtrics. The change in platform occurred because the home university of the second author changed its supported online survey platform. Since there are no accessible lists of all farmers who participate in Field to Market, from which to draw a survey sample, the research team compiled a list of potential respondents through connections and website listings. The first wave took place from January to November 2020. Fieldprint® project coordinators who agreed to promote the survey sent a participation link to the farmers in their programs. The project coordinators were identified on Field to Market's website, through their contributions at Field to Market's assemblies and conferences, or were recommended to the research team by other stakeholders. Field to Market also disseminated the survey among its Fieldprint® project coordinators. Because of this distribution approach, there is no way to calculate the response rate for this phase of survey collection. For the second wave, the project team downloaded a list of spotlight farmers from Field to Market's website and sent paper letters to their addresses with the Qualtrics survey link. Field to Market also sent an email with a survey link to farmers. Farmers were invited to provide their email addresses and enter a drawing for a $25 gift card. In this phase, 25 surveys were distributed, and seven responses were received, resulting in a response rate of 28%.
Survey questions focused on the aforementioned indicators and variables (Table 1). Respondents were asked closed-ended questions about the impacts of participation on profitability and changes in farming practices; ease of joining; their self-rating of adopting new technologies; motivations; perceived benefits; and the regulatory environment. They were then asked to rate several concerns about participation, including data privacy. Finally, they were asked about their acreage, state of residence and crops grown.
The research team utilized SPSS for the survey data analysis. We calculated frequencies for each variable and conducted bivariate analyses, with the likelihood of continuing in the program as the dependent variable (recoded as a binary variable: extremely, very, or somewhat likely coded as one and not sure or unlikely as 0 for comparison of means).
Results
Interview sample description
A total of 11 interviews with farmers were completed. The acres of production ranged from 800 to 4800 acres. Ten farmers reported growing corn and soy, and one reported growing wheat. One corn and soy farmer also reported growing vegetables, and another also produced hay. Farmers were not asked about demographic information in the survey or interviews because this study examined how farmers perceived the MSI metrics program rather than attempting to determine if and how farmers' demographics influenced adoption. Survey respondents were current or past participants of Filed to Market's Fieldprint® program.
Survey sample description
Twenty-two surveys were completed. Despite the small sample, we believe the results are worthwhile because this study is one of the first of its kind. Although the findings from this sample are not generalizable, they are useful in developing concepts and theories that might be developed and tested in future research. Since the survey was anonymous, we do not know if interview and survey subjects overlapped.
The acres of production for farmers who participated in the survey ranged from 350 to 8,100, with a mean of 2738 and a median of 1400. By comparison, the mean farm acreage in the U.S. is 441 acres, according to the 2017 Census of Agriculture (U.S. Department of Agriculture National Agricultural Statistics Service, 2017). Thirteen farmers were from Iowa, with the rest (one each) from Arkansas, Idaho, Illinois, Louisiana and Nebraska. Fifteen reported growing corn and soy; other crops grown include corn silage (four); wheat and peanuts (two each); rice, peas and sugar beets (one each). Therefore, our sample of farmers is larger than average farmers, and the crops grown by the farmers are broader than typical farmers.
Univariate analysis: adoption, benefits and profitability
In the survey, most respondents described themselves as somewhat fast (14) to adopt new practices. Three characterized themselves as very fast, and one as somewhat slow. Interview participants were asked to describe their rate of adoption of new practices as well as rate themselves on a scale of 1 to 5, with 1 rarely implementing changes to being the first to try new approaches. Like the survey, most interview participants reported themselves as faster to adopt new technologies than most, although they rarely consider themselves first adopters. In the survey, most (12) described the impact of participation in the metrics program on their practices as leading to ‘small changes,’ while one said that it had led to large changes, and five said, ‘not at all (I was already implementing the suggested practices).’ These findings are illuminating because arguments in favor of sustainability metrics often assume that farmers become aware of inefficiencies and, subsequently, make changes to become more sustainable (Field to Market, 2021; Hatanaka et al., Reference Hatanaka, Konefal, Strube, Glenna and Conner2021). This study indicates that the earlier adopters of Field to Market's metrics may have already adopted more sustainable practices before participating in the program. We elaborate on the idea that farmers are ‘already sustainable’ when describing the qualitative results.
In the survey, when asked about anticipated benefits of participation, the most common answer was education, followed by price premium (Table 2).
Table 2. Anticipated benefits of participation in fieldprint (survey results: N = 16)

The anticipated benefits somewhat align with realized ones. The most commonly cited benefits are comparing performance with other farms and educational opportunities, followed by better communication of farmer sustainability to consumers (Table 3).
Table 3. Cited benefits of participation in fieldprint (survey results: N = 16)
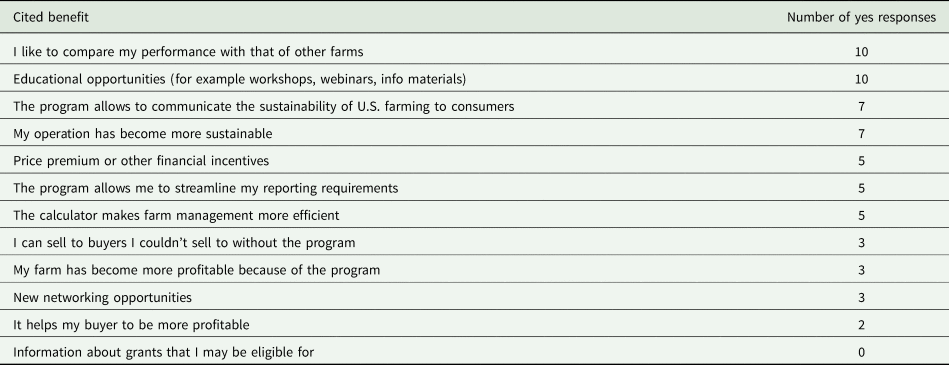
Because farmers in the interview sample were already participating or had participated in the program, the interview did not cover the anticipated benefits but instead focused on the cited benefits. In comparison to the survey findings, interviewees reported comparing performance with other farmers, communicating sustainability, price premium and buyer profitability as the program's key benefits. However, as we discuss in the next section, these benefits differ in magnitude. Additionally, educational opportunities, streamlined reporting, improving management efficiency, networking opportunities, and information about grants were not regularly reported by interviewees. In interviews, participants explicate the relationship between economic benefits, financial incentives and buyer profitability.
Mirroring the survey findings, interview findings demonstrate that farmers appreciated comparing performance with other farmers (benchmarking); however, these comparisons did not necessarily result in farm practices becoming more sustainable. Expanding on the smaller number of survey respondents who noted they were already implementing suggested practices to enhance sustainability (five), most interview participants reported very little change to their operations. Instead, farmers shared that participating in the metrics program was primarily a way to ‘validate’ and ‘recognize’ existing sustainability practices. After receiving the benchmarking metric results, only one interviewee reported adjusting grain hauling locations to reduce mileage traveled. In conceptualizing the metrics program and their operations, farmers already considered themselves as making economically smart decisions, thus supporting the ‘sustainability’ of their farm. This suggests that farmers perceived connections between economic and environmental sustainability. Participating in this program was simply a way to document sustainability for buyers and consumers. As Nick stated, ‘[T]he biggest thing I've seen from it (the metrics program) is that we are already doing sustainable practices, and this is hopefully a way that American consumers can see that we are already doing sustainable practices.’ Thus, most farmers viewed these metrics as a way to ‘prove’ to consumers that U.S. agriculture is ‘sustainable.’ The majority of survey participants and interviewees reported ‘small changes’ or no changes because they already considered their decision-making informed by sustainability, which farmers primarily conceptualized as economic efficiency and farm viability. In this way, sustainable farming decisions appeared to be mainly made independently of participation in the metrics program. The findings regarding the impact of Field to Market's metric program on sustainability decision-making are potentially being influenced by sample selection bias. Until this type of MSI metrics program goes more mainstream, it will likely attract participating farmers already engaging in more sustainable practices. Nevertheless, most of these farmers were equating economically efficient farm management decisions as ‘sustainability’ decisions, which potentially differs from sustainability measures.
Because farmers viewed the metrics program as communicating sustainability, farmers, in turn, conceptualized the metrics program as helping them to be more profitable, thereby supporting their farms' viability. This connection between profitability and communicating sustainability was less apparent in the survey findings since communicating sustainability of U.S. farms and buyer profitability was not selected at equivalent rates (see Table 3). Farmers cited a growing desire among consumers to know how farms produce goods and viewed the metrics programs as companies attempting to respond to this demand. As Dean described, ‘I think it's a great thing to be able to have that information for the end-user…[I]f that results in them (the grain purchaser) being able to have more customers and more satisfied customers, then that's great for us in the end.’ Most of the interviewees viewed the metrics as beneficial to the buyers who could make claims about sustainability, thus driving demand for the farmers' products.
Finally, in the survey, respondents reported the program was relatively easy to join but had a little positive impact on farm profitability. Twelve said it was very (five) or somewhat (seven) easy to join, while six rated joining as somewhat (five) or very difficult (one). No farmer described the impact on profitability as largely positive; 11 described it as a small positive impact, five as no impact and two as largely negative. These results were mirrored in the interviews since most farmers viewed the program as relatively easy to join; however, the ease of joining was related to the fact that companies expected farmers to participate. Further, interviews shed light on farmers' perception of profitability as the price premium played a minor role in farmers' cited benefits. Instead, the continued relationship with the seller was the primary motivation to participate in the metrics program.
Most farmers agreed that the price premium was an acknowledgment of the few days each year required to input the data but that it was not the key motivating factor for them. Several farmers could not recall the exact amount of the premium or if the premium was renewed each contract year. While only three survey respondents reported the cited benefit, ‘I can sell to buyers I couldn't sell to without the program,’ the majority of interviewees described a more intricate relationship with their buyers wherein they were expected to complete the metrics program to continue selling to these buyers. For example, when asked about joining the metrics program, Dean explained, ‘[I]t wasn't really a choice. It's like if you're going to continue to grow corn for [this company], you're going to do this (the metrics program)…either do it, or you're out.’ This farmer went on to say, ‘I didn't have problems with it (the metrics program). It's just part of what we do.’ Similarly, when asked about the difficulty of joining the metrics program, another farmer responded, ‘It's what they want to be done, so I didn't argue.’
The ability to remain a client motivated farmers to participate in the program. However, perspectives on this seller-buyer relationship diverged among interviewees. A few farmers describe participating in the metrics program as more coercive than voluntary. One farmer explained:
[Y] ou're pretty much forced to do it (the metrics program), or they don't let you sell corn to them…. I don't know this for sure, but just from what I've seen and heard people talking about, they did not renew some contracts because people refused to do this.
Similarly, Nick, who also felt somewhat forced to report data, stated, ‘I'm not sure if I don't (participate in the metrics program) if they're going to kick me out or not.’ In this way, participating in the metrics program and sharing data from the farm became a requirement for farmers to do business with certain companies.
Despite a few farmers using words like ‘no choice’ and ‘forced,’ not all farmers reported ‘feeling pressured’ to join the program. Instead, most farmers articulated their participation as an outcome of their relationship with a buyer. When responding to the reasons for participating, Craig stated, ‘No one's forcing us to do anything. We just have to decide whether or not it's worth our time and effort and do it and continue with this company or go elsewhere. And we felt it was worth our time and effort to do so.’ Several farmers were already sharing data, albeit in a much more limited capacity. The formalization of a reporting system through the metrics program did not impact their overall relationship with the buyer. However, even though most farmers did not perceive direct pressure to join, the more subtle form of coercion through a continued relationship with the buyer suggests complex power dynamics within sustainability metrics.
Moreover, farmers who did not express the same relationship to one buyer did not discuss this as a part of their motivation. One farmer, Warren, described a meeting where companies spoke about ‘why it was important for them to do this (sustainability reporting), and their goals, and what they were trying to accomplish.’ This farmer, who did not have a relationship with a single buyer, explained, ‘I like to think I'm pretty conservation-minded anyway, and a lot of this feel-good stuff I don't subscribe to. Pay me, and then I start to get interested.’ Warren ultimately dropped out of the metrics program. As we will discuss in the final section, relationships with buyers appeared to influence whether farmers would likely continue participating in the metrics program.
Concerns and continued participation
When asked about their concerns in the survey, respondents most commonly mentioned a lack of benefits, followed by the accuracy of reports and data privacy (Table 4). Given the level of concern and lack of clear benefits, the respondents were ambivalent about continuing in the program. Only four were extremely likely to continue. Eight were somewhat likely, and a total of three were somewhat or very unlikely (Table 5).
Table 4. Cited concerns about participation in fieldprint (survey results: N = 16)

Table 5. Likelihood of continued participation in fieldprint (survey results: N = 16)

Concerns reported in the interviews expand on the survey findings regarding the likelihood of continued participation. Interview findings closely echo survey findings that farmers' top concerns were insufficient benefits and data accuracy. A few farmers also noted data privacy issues and workload as other concerns but to a lesser extent than inadequate benefits and data accuracy.
As previously discussed, the benchmarking function that allowed farmers to compare their results to peers was cited as a benefit by both survey and interview participants. Nevertheless, some argued that the meaning of the benchmarking reports was not fully explained. Tom described the data interpretation issue:
I frankly still look at that fingerprint spiderweb (the benchmarking report), and I really don't know what it's telling me. I know it's different for a lot of different fields, but I know it has something to do with the number of passes I go and my tillage practices, and all those things impact what that fingerprint looks like. I've not comprehended or sat down and studied the thing to really understand what I'm looking at. I just know somebody is, or I hope they are because it's a lot of work.
In other words, despite being cited most frequently as a benefit, farmers did not necessarily understand how to analyze and apply the information from the benchmarking reports, which demonstrates a limitation of one of the critical benefits conceptualized by the Field to Market metrics program. Further, farmers questioned the benchmarking function due to concerns about data accuracy. Dean stated, ‘It's difficult for our farm to be extremely precise as far as supplying information because we do so many different things in so many different places.’
All interviewees agreed that reporting the data required some initial effort to learn how to use the software and time each year to input the information. However, while the workload was an inconvenience, it was not an overall deterrent to participation. Nevertheless, this may be due to the oversampling of farmers who were still participating in the program. One farmer who dropped out of the program cited insufficient benefits (minimal price premium and limited use of the benchmarking reports) based on the amount of data required (workload) as the primary reasons for leaving. While a few described the data reporting as complicated, improvements to the program after the first year made entering data more user-friendly, making this less of a concern for interviewees. Finally, no interviewees discussed the timing of data reporting as an issue.
Bivariate analysis
We compared the mean values for the dependent variable, the likelihood of continued participation, to the following independent variables
• Benefit: My operation has become more sustainable (yes/no)
• Positive economic impact (coded (yes) 1 in impact was positive, 0 (no) otherwise)
• Ease of joining (coded (yes) 1 if very or somewhat easy, 0 otherwise)
• Concern: I don't benefit sufficiently from the program (yes/no)
Table 6 highlights the different likelihoods of continuation in the program. The mean value of likelihood of continuing (extremely, very, or somewhat likely) was coded as 1, and not sure or unlikely was coded as 0). Only those with a P-value lower than 0.05 are included here. All of those who report that the program made their farms more sustainable plan to rejoin. Large majorities of those who note positive economic impact and ease of joining are likely to rejoin. All of those who do not sufficiently benefit are unsure or unlikely to rejoin.
Table 6. Results of bivariate analysis

Likelihood of Participation (Dependent Variable) by Selected Independent Variables.
Given that the primary motivation for farmers to join the program was the continued relationship with an existing buyer, qualitative findings expand the results of the bivariate analysis. Participating in the metrics program for those farmers who relied on a primary buyer for their contracts meant that this project was no longer an ‘opt-in.’ The sharing of data and metrics reporting became a base requirement to do business with certain companies. Although farmers were unsure about the explicit fallout from not participating, a few farmers reported hearing that contracts were not renewed for those who did not join the program. This, of course, has only been a concern for farmers who depend on buyers who tie their Fieldprint® programs to the purchasing of premium products. Farmers can simply sell their products to a different buyer for open-market commodities.
Most interviewees noted they would be strongly likely to continue in the metrics program, but they articulated their continued participation in relation to the company currently buying their products. For example, Nick explained he would not participate unless the company he sells to required it. Nevertheless, he continued to participate because he wanted to ‘continue to grow for [the company]’ and ‘saw value in that’ continued business relationship. Similarly, Jim stated he would continue ‘as long as the company would let’ him. As the likelihood of continuing was phrased in relation to the farmers' current buyer, any dissatisfaction with the program was less influential compared to the ability to maintain the buyer-seller relationship. Craig articulated this point:
I'm satisfied enough to continue using (the metrics program) … It's not something that would make me part ways with [the company], nothing like that at all. So, I'm sure they will always be updating and trying to find ways to make it a more user-friendly experience. But they've done a good job to this point, and I'm sure they'll continue to improve the software.
Thus, as discussed in the previous section, this buyer-seller relationship tends to outweigh insufficient benefits, concerns about data accuracy, privacy and workload associated with data entry. Qualitative analysis suggests that being a client of companies involved in Field to Market's metrics program was the primary economic factor for participating and continuing the metrics program.
Discussion
This paper discusses farmers' experiences engaging in sustainability metrics through an MSI metrics program. A few key results emerge. First, the farmers who enrolled in the metrics program viewed themselves as quick to adopt new practices and found the program was relatively easy to join but yielded few substantial economic benefits. Instead of using the data generated from the metrics program to identify areas of improvement toward sustainability, the interviewees viewed their farming practices as sustainable regardless of participating in the metrics program. Some perceive that the benefits accrue mainly to buyers and only indirectly to farmers through demand for their products. For the most part, farmers' benefits align well with their motivations: they were motivated by educational and benchmarking opportunities and reported benefits in those areas. However, many reported not gaining tangible benefits from participation, such as being unable to understand the benchmarking results; thus, there was ambivalence about continuing. Bivariate survey results suggest a clear connection between realized benefits and intent to continue in the program. Those who reported economic benefit and believed it made their farms more sustainable were significantly more likely to continue the program or rejoin. In contrast, those who saw no benefit were unlikely to rejoin. Ease of joining also made future participation more likely. Finally, qualitative findings show that the bivariate analysis regarding continued participation and economic benefits remains embedded in farmers being able to continue selling to buyers who were now participating in the MSI metrics program and seeking sustainability data from farmers. Farmers viewed reporting sustainability metrics as key to their continued economic relationship with buyers and felt that because companies wanted these metrics, joining the program was relatively easy. As such, farmers' initial and continued participation was primarily shaped by investment in these sustainability metrics by companies involved in the MSI metrics program.
Our results largely mirror but add nuance to previous studies. As found previously, participating farmers saw themselves as innovators/early adopters (Trujillo-Barrera et al., Reference Trujillo-Barrera, Pennings and Hofenk2016; Dessart et al., Reference Dessart, Barreiro-Hurlé and van Bavel2019). Fieldprint® Platform's ease of use is a positive factor in adoption, as seen in prior research (Serebrennikov et al., Reference Serebrennikov, Thorne, Kallas and McCarthy2020). However, after implementation, assistance appeared to diminish, which hampered farmers' ability to apply data results, thereby affecting long-term adoption as farmers struggled to implement any knowledge gained from the sustainability metrics. At the early stages of these programs, the most technologically savvy and motivated farmers engage and continue with the program. Once the MSI metrics programs seek to become more mainstream, the companies trying to enlist new farmers may find it more challenging to continue to attract additional farmers.
Like other studies (Trujillo-Barrera et al., Reference Trujillo-Barrera, Pennings and Hofenk2016), we found that monetary economic incentives in the form of premiums were inadequate for farmers to consider them significantly beneficial. We found that some farmers listed educational benefits and sustainability benchmarks as more important than any available monetary benefits, echoing prior studies on the benefits of learning opportunities for some farmers (Fujisaka, Reference Fujisaka1994; Gielen et al., Reference Gielen, Hoeve and Nieuwenhuis2003; Lee, Reference Lee2005; Kemp et al., Reference Kemp, Nijhoff-Savvaki, Ruitenburg, Trienekens and Omta2014). Additionally, farmers expressed concerns about data inaccuracy, which may deter these farmers from viewing the program as helpful in guiding farming decisions. However, because companies still use the data to make sustainability claims—regardless of the farmer's concerns about accuracy—farmers wanted to be compensated for sharing their data. Strube et al. (2021) highlight that farmers involved in MSI metrics programs have come to recognize that their data is turning into a commodity and that they desire compensation for sharing their data. Overall, the lack of clear and measurable benefits seems to inhibit future participation unless participation in the program was perceived as a requirement for business contracts. Indeed, our results suggest that clearly articulated and realized benefits are vital for continuing the program.
Our study makes several contributions to the literature. First, it builds on prior efforts (Konefal et al., Reference Konefal, Hatanaka, Strube, Glenna and Conner2019; Strube et al., 2021) to document farmers' experiences in an MSI metrics program. It measures the relative importance of factors shaping continuation in the program, finding that economic and sustainability benefits and ease of use are most important. It adds nuance to the concept of economic benefit since farmers believed that the buyers benefitted from meeting consumer demands regarding product information, which some farmers identified as benefiting their profitability indirectly through increased demand. Further, farmers broadly conceptualized the economic benefits as continuing a relationship with buyers who were now asking farmers to join the metrics program and report data. This suggests a power imbalance in the supply chain, which indicates the relationships may be more complex and raises concerns about the long-term viability of such programs when participants express concerns about coercion. There is disagreement among Field to Market's stakeholders as to how much coercion, and from whom, should be used to enroll farmers into Fieldprint programs or adopt sustainable agriculture practices. While some stakeholders argue that participation should be entirely voluntary, others think that more pressure is needed for agriculture to become sustainable quickly. Some call on the state to pass corresponding legislation, while others prefer companies to use their market power to improve farmer participation. Overall, we found that the relationships between farmers and buyers affect if and how farmers are willing to participate in metrics programs, share data and shift practices. Companies and other stakeholders may need to invest in these relationships if these actors want farmers to engage in sustainability programs.
Based on our results, we posit a few implications for practice, outreach and future research. First, MSI metrics programs should ensure and articulate an equitable distribution of benefits. Farmers may prefer metrics that increase understanding of economic performance. Benchmarks may benefit farmers who wish to measure and compare their farms' performances. There is also an opportunity to leverage learning opportunities and programming to utilize benchmarks for comparison among farms and encourage friendly competition among one another. Friendly competition must be differentiated between coercive or punitive competition that excludes certain farmers from market opportunities. Nevertheless, friendly competition could both motivate participation and induce innovation to improve performance. However, metrics and benchmarks alone are not incentive enough (Strube et al., 2021); farmers may be more willing to do it if they receive other incentives, particularly substantial cash payments or cost shares. Additionally, MSI metrics programs would benefit from improved technical assistance, ensuring the programs are easier to use and understand. Given the importance of relationships in sustainability adoption, MSI metrics programs may choose to invest time, money and effort to build and strengthen relationships between farmers and downstream supply chain actors.
Given these findings, several future research projects emerge. First, continued research is needed to ensure that MSI metrics improve sustainability and increase efficiency, cost savings and increased market access. Findings illustrate that farmers rarely reported making changes, except when reporting that ‘improved sustainability’ on farms undergirded their motivation to continue participating. Qualitative results suggest that most farmers in this program viewed their decisions and practices as sustainable, independent of metrics, or viewed the metrics as potentially inaccurate, limiting their utility. Further, farmers suggest that these sustainability metrics demonstrate to consumers that farming is sustainable prior to the documentation of these claims by the sustainability metrics. This subtle explanation of the ‘uneducated consumer’ demonstrates a more pervasive issue in the agrifood industry: farmers are—by nature—environmental stewards and will invest in environmental sustainability on their farms (Mock, Reference Mock2021). Although this view is steeped in Jefferson Agrarianism and the yeoman myth (Calo, Reference Calo2020), the reality is that farmers—commodity producers in particular—are locked into a farming structure that systematically pays them to overproduce and extract as much output as possible from their land (Howard, Reference Howard2016). Because many of the farmers in the sample do not view their production as unsustainable and conceptualize sustainability in terms of economic efficiency, MSI metrics programs must reckon with the potential disconnects between farmers' definition and perception of sustainability and the measurable outcomes documented in sustainability metrics. Expanding research evaluating the sustainability outcomes of such programs would address a potential danger of reification, where MSI metrics and benchmarks are treated as sustainability itself, ignoring the contradictions of more nuanced measures. In addition, care should be taken to address and control for selection bias in who participates in MSI metrics programs (e.g., early adopters who believe they are already sustainable versus those who feel pressure from buyers to adopt).
Additionally, examining other MSI metrics programs would also provide valuable comparisons. For example, some interviewees were fearful that not participating in the program would result in their contracts not being renewed. As Tyson has demonstrated in poultry production, contracts are a powerful tool for systematically retaining preferred farmers and removing ‘undesirable’ farmers (Leonard, Reference Leonard2014). As such, studies of the social implications of these programs should include farmers who have not continued participating in order to examine the power dynamics of these programs more effectively. Furthermore, a study that considers demographic variables may be able to identify how these programs may support certain demographics of farmers. Farmers who are white men disproportionately receive federal financial support for farming (Sachs et al., Reference Sachs, Barbercheck, Brasier, Kiernan and Terman2016), but how MSI metrics programs may replicate or attend to inequity in the agrifood system is less well understood.
In sum, MSI metrics programs are an emerging approach to promoting agricultural sustainability. By bringing together various actors and implementing sustainability programs, MSI metrics programs offer fruitful avenues to reinsert environmental and social values into the agrifood supply chain. However, our analysis raises concerns regarding farmers' perspectives toward measuring sustainability metrics and the relationships with actors in MSI programs. Our findings demonstrate that as a newly emerging approach to promoting sustainability, MSI metrics programs may replicate power inequities and fail to distribute benefits evenly across the supply chain. Future MSI metrics program design and implementation must consider how to grapple with these issues and unintended consequences as these efforts are scaled-up and mainstreamed.
Financial support
This work was supported by a USDA-AFRI grant (Award Number 2017-68006-26235).
Conflict of interest
The authors declare none.


 Open access