Introduction
Waterhemp [Amaranthus tuberculatus (Moq.) J. D. Sauer] is a major weed occurring in fields throughout the U.S. Midwest, including Nebraska. It is a summer annual weed species of the Amaranthaceae family and native to North America (Sauer Reference Sauer1967). Many features contribute to the success of A. tuberculatus as a troublesome weed in crops, such as dioecious reproduction with prolific seed production, C4 physiology with a fast growth habit, extended germination window, and an abundance of field-evolved herbicide-resistance cases (Heap Reference Heap2018; Horak and Loughin Reference Horak and Loughin2000; Sauer Reference Sauer1957; Schultz et al. Reference Schultz, Chatham, Riggins, Tranel and Bradley2015; Steckel Reference Steckel2007; Werle et al. Reference Werle, Sandell, Buhler, Hartzler and Lindquist2014).
Amaranthus tuberculatus populations have evolved resistance to a number of herbicide mechanisms of action. Biotypes resistant to acetolactate synthase (ALS), photosystem II (PSII), protoporphyrinogen oxidase (PPO), auxin receptor, 4-hydroxyphenylpyruvate dioxygenase (HPPD), and 5-enolpyruvylshikimate-3-phosphate synthase (EPSPS) inhibitors have been documented across the United States, including Nebraska (Bell et al. Reference Bell, Hager and Tranel2013; Bernards et al. Reference Bernards, Crespo, Kruger, Gaussoin and Tranel2012; Crespo et al. Reference Crespo, Wingeyer, Kruger, Riggins, Tranel and Bernards2017; Heap Reference Heap2018; Jhala et al. Reference Jhala, Sandell, Rana, Kruger and Knezevic2014; Oliveira et al. Reference Oliveira, Gaines, Dayan, Patterson, Jhala and Knezevic2018a; Schultz et al. Reference Schultz, Chatham, Riggins, Tranel and Bradley2015; Shergill et al. Reference Shergill, Barlow, Bish and Bradley2018; Vennapusa et al. 2018; Vieira et al. Reference Vieira, Samuelson, Alves, Gaines, Werle and Kruger2018). Glyphosate-resistance mechanisms reported in A. tuberculatus include EPSPS gene amplification, EPSPS target-site mutation, and a non–target site resistance mechanism with reduced glyphosate uptake and translocation (Lorentz et al. Reference Lorentz, Gaines, Nissen, Westra, Strek, Dehne, Ruiz-Santaella and Beffa2014; Nandula et al. Reference Nandula, Ray, Ribeiro, Pan and Reddy2013; Schultz et al. Reference Schultz, Chatham, Riggins, Tranel and Bradley2015). EPSPS gene amplification is the major glyphosate-resistance mechanism reported in Nebraska (Chatham et al. Reference Chatham, Bradley, Kruger, Martin, Owen, Peterson, Mithila and Tranel2015; Sarangi et al. Reference Sarangi, Tyre, Patterson, Gaines, Irmak, Knezevic, Lindquist and Jhala2017). Resistance associated with the 2,4-D-resistant A. tuberculatus population has been attributed to rapid 2,4-D metabolism, likely mediated by 55 cytochrome P450 enzymes (Figueiredo et al. Reference Figueiredo, Leibhart, Reicher, Tranel, Nissen, Westra, Bernards, Kruger, Gaines and Jugulam2018). The predominant PSII-inhibitor resistance mechanism reported in A. tuberculatus from Nebraska is related to atrazine and is metabolism-based resistance with fast atrazine conjugation via glutathione S-transferase (GST) activity (Vennapusa et al. 2018).
Previous work has hypothesized that herbicide-resistance traits in weeds could be associated with fitness cost and competitive disadvantages in the absence of herbicide selection (Vila-Aiub et al. Reference Vila-Aiub, Neve and Roux2011, Reference Vila-Aiub, Goh, Gaines, Han, Busi, Yu and Powles2014; Wu et al. Reference Wu, Davis and Tranel2018). It has been suggested that potential fitness costs associated with herbicide-resistance traits are dependent on the molecular and biochemical basis of the herbicide-resistance mechanism (Vila-Aiub et al. Reference Vila-Aiub, Gundel and Preston2015; Wu et al. Reference Wu, Davis and Tranel2018). Vila-Aiub et al. (Reference Vila-Aiub, Neve and Powles2005) reported that rigid ryegrass (Lolium rigidum Gaudin) populations with metabolic herbicide resistance via cytochrome P450 activity had physiological fitness cost in the absence of herbicide selection when compared with a susceptible biotype. The fitness cost was more evident in the vegetative stage (aboveground biomass), suggesting that fitness cost was likely compensated in the reproductive growth stage.
Conversely, Vila-Aiub et al. (Reference Vila-Aiub, Goh, Gaines, Han, Busi, Yu and Powles2014) reported that glyphosate-resistant Palmer amaranth (Amaranthus palmeri S. Watson) with an EPSPS gene-amplification resistance mechanism did not exhibit fitness cost (plant height, vegetative and reproductive aboveground biomass) in the absence of glyphosate selection. Wu et al. (Reference Wu, Davis and Tranel2018) reported in a multigenerational study that no fitness cost (resistance frequency) was associated with atrazine (non–target site mechanism), PPO inhibitors, HPPD inhibitors (non–target site mechanism), and glyphosate resistance in an artificially generated A. tuberculatus population in the absence of herbicide selection. However, a fitness cost was observed with ALS resistance, as the resistant-allele frequency was reduced across generations (Wu et al. Reference Wu, Davis and Tranel2018). Although the evolution of ALS resistance was identified to carry an allele-frequency fitness cost, Sibony and Rubin (Reference Sibony and Rubin2003) reported similar plant biomass and relative total yield were achieved between weed populations resistant and susceptible to ALS inhibitors. Therefore, the identification, detection, and reporting of fitness cost associated with herbicide resistance is convoluted due to the nonuniversal fitness cost expression (Vila-Aiub et al. Reference Vila-Aiub, Neve and Powles2009).
Amaranthus tuberculatus interference studies have been conducted in a range of cropping systems and environmental conditions (Feltner et al. Reference Feltner, Hurst and Anderson1969; Hager et al. Reference Hager, Wax, Stoller and Bollero2002). Steckel and Sprague (Reference Steckel and Sprague2004a) reported 11% to 74% yield loss in corn (Zea mays L.) with season-long A. tuberculatus interference. Cordes et al. (Reference Cordes, Johnson, Scharf and Smeda2004) reported that high densities of late-emerging A. tuberculatus resulted in up to 36% corn yield loss, whereas low densities of late-emerging plants had minimal impact on corn yield. Bensch et al. (Reference Bensch, Horak and Peterson2003) reported up to 56% yield loss in soybean [Glycine max (L.) Merr.] with A. tuberculatus interference (8 plants m−1 row) using a rectangular hyperbola model approach. Steckel and Sprague (Reference Steckel and Sprague2004b) reported that soybean row width and A. tuberculatus emergence timing had a direct impact on A. tuberculatus density, biomass accumulation, seed production, and soybean yield loss. Amaranthus tuberculatus density was reduced with later emergence times and interference on soybean was diminished in narrow-row in comparison to wide-row soybean. Further research across the Midwest and Midsouth indicated that narrow-row soybean and a high soybean seeding rate increased canopy coverage, resulting in reduced end-of-season Amaranthus spp. growth characteristics, including height, biomass, and seed production, but A. tuberculatus density was not impacted (Butts et al. Reference Butts, Norsworthy, Kruger, Sandell, Young, Steckel, Loux, Bradley, Conley, Stoltenberg, Arriaga and Davis2016).
Given the diverse genetic background of the species, it can be inferred that many traits such as germination time, growth plasticity, C4 photosynthesis, prolific seed production, and herbicide resistance could influence A. tuberculatus competitiveness with crops. However, few to no studies have investigated the competitiveness of different A. tuberculatus populations under the same experimental conditions. An additive design in crop–weed competition studies is considered the most suitable approach to determine potential crop yield losses, although the results could be highly influenced by the experimental edaphic and environmental conditions (Swanton et al. Reference Swanton, Nkoa and Blackshaw2015). Therefore, the objective of this study was to evaluate the competitive ability of herbicide-resistant A. tuberculatus populations with soybean in the absence of herbicide selection under greenhouse conditions.
Materials and Methods
Experimental Design
A greenhouse experiment was conducted at the University of Nebraska–Lincoln Pesticide Application Technology Laboratory located at the West Central Research and Extension Center (WCREC) in North Platte, NE. The experiment was conducted using the additive crop–weed competition treatment design (Swanton et al. Reference Swanton, Nkoa and Blackshaw2015) with four replications spatially organized in a completely randomized experimental design and two replications temporally (April 4, 2017; June 5, 2017). The treatments were composed of three A. tuberculatus populations (2,4-D and atrazine resistant [2A-R], glyphosate and PPO resistant [GP-R], and 2,4-D, atrazine, glyphosate, and PPO susceptible [2AGP-S]), five target A. tuberculatus densities (0, 2, 4, 8, and 16 plants pot−1), and two harvest times (R1 and R7 soybean growth stages; Fehr et al. Reference Fehr, Caviness, Burmood and Pennington1971) for a total of 26 treatments.
Plant Materials and Growth Conditions
Nursery pots (356-mm diameter by 285-mm deep, 24.7 L) were filled with a mixture of field soil and commercial potting mix (Berger™ BM7 Bark Mix, 121 1e Rang, Saint-Modeste, Québec G0L 3W0, Canada) at a 1:1 ratio (v/v). The field soil (Holdrege silt loam [fine-silty, mixed, superactive, mesic Typic Argiustolls], pH=6.2, 1.0% organic matter) was collected in a fallow area from the WCREC dryland farm located in North Platte, NE. A sample of this field soil was taken for a nutrient analysis, and from the results, no additional fertilizer was supplied until the R1 soybean reproductive growth stage (ET Paparozzi, personal communication).
Soybean seeds (‘39RY25,’ Dyna-Gro, 319 JF Edwards Drive, Geneseo, IL 61254) were inoculated using Bradyrhizobium from Dyna-Start® Max (Loveland, 3005 Rocky Mountain Avenue, Loveland, CO 80538) and sowed into the pots at a depth of ~4 cm. Soybean seedlings were thinned to 3 plants pot−1 about 1 wk after emergence. The 3 soybean plants pot−1 density was selected to create a realistic soybean cropping system environment competitive for A. tuberculatus based on the following assumptions: (1) the 24.7 L pots were filled to 80% to 85% capacity with soil and (2) there would be 2,000,000 L of soil ha−1 in the top 20 cm. Based on these assumptions, the 3 plants pot−1 density would equate to an in-field density of approximately 300,000 plants ha−1. Similarly, the 2 and 16 plants pot−1 A. tuberculatus densities would equate to an in-field density of approximately 20 and 160 plants m−2.
Seeds from the 2A-R population were collected from southeastern Nebraska in 2010 from a production field of little bluestem (Schizachyrium scoparium Michx. Nash) (Bernards et al. Reference Bernards, Crespo, Kruger, Gaussoin and Tranel2012; Crespo et al. Reference Crespo, Wingeyer, Kruger, Riggins, Tranel and Bernards2017). The GP-R population and 2AGP-S population were collected in 2014 from soybean fields in Cass County and Fillmore County, NE, respectively (Vieira et al. Reference Vieira, Samuelson, Alves, Gaines, Werle and Kruger2018). Seeds were randomly collected from at least 10 mature A. tuberculatus plants in the field, cleaned, and stored in plastic bags at 4 C until used. Amaranthus tuberculatus seeds of each population were placed in between layers of moist filter paper in plastic petri dishes to stimulate germination. Once the majority of the A. tuberculatus seeds had a visible radicle, the seedlings were transplanted at the desired density (0, 2, 4, 8, and 16 plants pot−1) plus an additional 50% in their respective experimental pots where the soybean plants were in the vegetative emergence stage. Extra A. tuberculatus seedlings greater than the target densities were removed once emerged; however, in some instances, not all actual per-pot densities matched the target per-pot density. Actual per-pot densities were recorded at harvest times and used throughout analyses.
Before the soybean R1 growth stage, plants were overhead irrigated as needed with tap water. Following the soybean R1 growth stage, plants were irrigated and fertilized with a 5-1-4 liquid fertilizer solution (Wilbur-Ellis Agribusiness, 3300 South Parker Road, Suite 500, Aurora, CO 80014) that was blended with water at 0.2% v/v and applied through overhead irrigation. Pots were treated with Bacillus thuringiensis (DiPel®, Valent, 1600 Riviera Avenue, Suite 200, Walnut Creek, CA 94596) for Lepidoptera control. LED growth lights (520 µmol s−1, Philips Lighting, Somerset, NJ 08873) provided supplemental lighting to ensure a 16-h photoperiod. Daytime temperatures were 26 ± 3 C and nighttime temperatures were 22 ± 2 C with an overall average relative humidity of 70 ± 12%.
Data Collection and Statistical Analyses
At each respective harvest time, the 3 soybean plants pot−1 were severed at the soil surface, placed in paper bags, and oven-dried at 60 C to constant final mass. At the R7 harvest time, soybean pods were stripped from the plant at time of harvest and counted. All soybean data per individual plant were pooled within each experimental unit (pot). Amaranthus tuberculatus stem diameter was measured at the soil surface at the soybean R1 and R7 growth-stage harvest times for each individual plant using a digital Vernier caliper (CP8806-T, Carrera Precision), and A. tuberculatus shoot biomass data were collected similarly to soybean. All A. tuberculatus data were pooled and averaged per pot, then divided by the number of plants to provide an average per-plant value.
A nonlinear regression analysis was conducted to estimate yield loss (e.g., biomass reduction) of soybean and A. tuberculatus as weed densities increased. Soybean biomass per pot at the R1 and R7 harvest times and the number of soybean pods per pot were first converted to percent reduction values using Equation 1:
 $$\,\%\,{\rm Red} = \left( {{\rm }1{\minus} {T \over C}{\rm }} \right){\rm {\asterisk}}100$$
where %Red is the percent reduction of the respective response variable, T is the observed treatment value, and C is the control (no A. tuberculatus) treatment value for the respective repetition.
After data conversion, the Cousens rectangular hyperbola model (Cousens Reference Cousens1985) was fit individually for each A. tuberculatus population to the soybean %Red response variables using R (v. 3.4.1) statistical software (R Foundation for Statistical Computing, Vienna, Austria) with the dose–response package and the Michaelis-Menten model command (Ritz and Streibig Reference Ritz and Streibig2016). The Cousens model (Equation 2) is a re-parameterization of the Michaelis-Menten model in terms of parameters A and I:
 $$Y_{L} = {{Id} \over {1{\plus}Id/A}}$$
where Y L is percent yield loss, d represents weed density, A is the percent yield loss as d approaches infinity, and I is the percent yield loss per unit weed density as d approaches zero.
Amaranthus tuberculatus biomass and stem diameter at the R1 and R7 harvest times were converted to average per-plant measurements for each treatment before model fitting. An asymptotic decay model (Equation 3) (Shinozaki and Kira Reference Shinozaki and Kira1956; Weiner and Freckleton Reference Weiner and Freckleton2010) was then fit to the average per-plant data using the NLIN procedure in SAS (SAS v. 9.4, SAS Institute, Cary, NC).
 $$w^{{{\minus}1}} = a {\plus} bd$$
The model parameters of Equation 3 are defined where w represents yield per plant, d is weed density, and a and b are defined constants. The biological implications of the a and b constants have previously been discussed in the literature (Willey and Heath Reference Willey and Heath1969). In short, the inverse of the a parameter may be an indicator of genetic potential and the inverse of the b parameter may give the yield potential of a given environment. A greater a parameter value indicates greater genetic potential (e.g., greater biomass and number of pods) in the absence of competition. A lower b parameter value as weed densities approach infinity indicates reduced environmental capacity due to the inability of the limited resources within the controlled environment to support more competitive plants.
Models were fit individually to each A. tuberculatus population across response variables using actual weed density per pot. A global F-test and delta Akaike information criterion (ΔAIC) values within each response variable were used to determine whether individual A. tuberculatus population models and a pooled population model were similar at α=0.1 (Archontoulis and Miguez Reference Archontoulis and Miguez2015; Barnes et al. Reference Barnes, Jhala, Knezevic, Sikkema and Lindquist2018; Oliveira et al. Reference Oliveira, Pereira, Ferreira, Santos, Knezevic and Werle2018b; Onofri et al. Reference Onofri, Carbonell, Piepho, Mortimer and Cousens2010; Ritz et al. Reference Ritz, Baty, Streibig and Gerhard2015). The ΔAIC values were calculated as follows: individual model AIC – global model AIC. A negative number indicates the individual model AIC was lower and, therefore, an overall better model fit.
Results and Discussion
Amaranthus tuberculatus–Soybean Interspecific Competition
Cousens (Reference Cousens1985) yield loss models indicated the percent reduction of soybean biomass at R1, biomass at R7, and number of pods asymptotically increased as A. tuberculatus density increased, regardless of the response variable. The global F-test (P=0.9791) and ΔAIC values (7.5359) (Table 1) indicated no difference between the individual A. tuberculatus population models and the pooled model for soybean shoot biomass reduction at the R1 harvest time, indicating no intercompetitive differences with soybean across A. tuberculatus populations (Figure 1). At the R1 harvest time, the A parameter estimates across the three A. tuberculatus populations indicated a potential maximum soybean biomass reduction of 46% to 59% (Table 2). Additionally, the I parameter estimates across the three A. tuberculatus populations indicated soybean biomass reduction increased by 4.5% to 6.3% with an increase of 1 A. tuberculatus plant pot−1 when A. tuberculatus density was near zero.
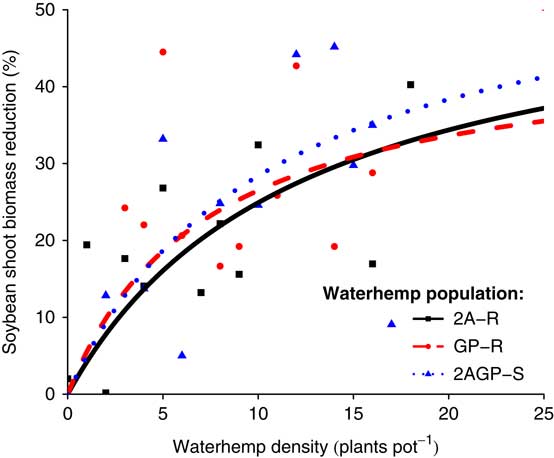
Figure 1 Soybean shoot biomass reduction (%) at the R1 harvest time as density of three A. tuberculatus populations (2,4-D and atrazine resistant [2A-R], glyphosate and PPO-inhibitor resistant [GP-R], and 2,4-D, atrazine, glyphosate, and PPO-inhibitor susceptible [2AGP-S]) increased.
Table 1 Global F-test results and ΔAIC values of individual and pooled model parameter estimates across response variables.Footnote a

a Cousens (Reference Cousens1985) yield loss models and asymptotic decay models (Shinozaki and Kira Reference Shinozaki and Kira1956; Weiner and Freckleton Reference Weiner and Freckleton2010) were fit to the soybean and Amaranthus tuberculatus response variables, respectively.
b ΔAIC values were calculated as follows: individual model AIC − global model AIC. A negative number indicates the individual model AIC was lower and, therefore, an overall better model fit.
Table 2 Cousens (Reference Cousens1985) yield loss model parameter estimates (A and I) and standard errors (SE) for each soybean response variable as affected by three Amaranthus tuberculatus populations.

a Abbreviations: 2A-R, 2,4-D- and atrazine-resistant population; GP-R, glyphosate- and PPO-inhibitor-resistant population; 2AGP-S, 2,4-D-, atrazine-, glyphosate-, and PPO-inhibitor-susceptible population.
At the R7 harvest time, soybean biomass (P=0.0006, ΔAIC=−12.7396) and number of soybean pods (P=0.0934, ΔAIC=−0.3875) were influenced by interspecific competitive differences between A. tuberculatus populations. After a full season of interspecific competition, the 2AGP-S population had greater reduction in soybean biomass compared with the other A. tuberculatus populations, especially at densities <16 weeds pot−1 (Figure 2). Moreover, at lower A. tuberculatus per-pot densities, the 2AGP-S population had greater reduction in number of soybean pods compared with the other A. tuberculatus populations (Figure 3). The 2AGP-S population had a greater rate of reduction of both soybean biomass and number of pods, as the maximum yield loss was observed at lower A. tuberculatus densities compared with the 2A-R and GP-R populations.
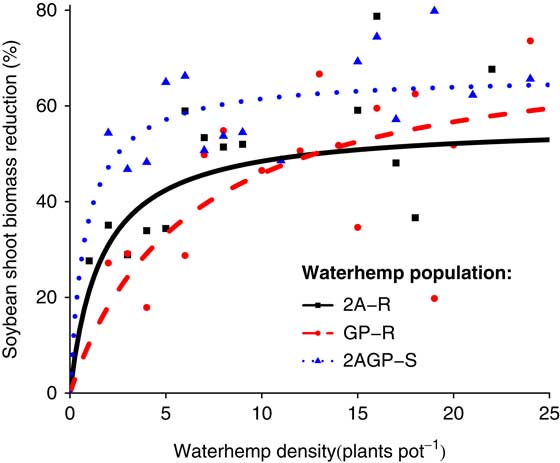
Figure 2 Soybean shoot biomass reduction (%) at the R7 harvest time as density of three A. tuberculatus populations (2,4-D and atrazine resistant [2A-R], glyphosate and PPO-inhibitor resistant [GP-R], and 2,4-D, atrazine, glyphosate, and PPO-inhibitor susceptible [2AGP-S]) increased.

Figure 3 Soybean pod reduction (%) as density of three A. tuberculatus populations (2,4-D and atrazine resistant [2A-R], glyphosate and PPO-inhibitor resistant [GP-R], and 2,4-D, atrazine, glyphosate, and PPO-inhibitor susceptible [2AGP-S]) increased.
Upon review of the model A parameter estimates, maximum predicted yield loss of soybean biomass occurred from competition with the GP-R population (74.2%) followed by the 2AGP-S (66.5%) and 2A-R (56.4%) populations (Table 2). The maximum predicted yield loss for the GP-R population would require extrapolation beyond weed densities observed in this research; therefore, within the bounds of this research, the 2AGP-S population was considered the most competitive. The maximum predicted yield loss in regard to number of soybean pods was generally similar across the three A. tuberculatus populations (59.2% to 66.6%). Although maximum predicted soybean yield losses were relatively similar across A. tuberculatus populations, the rate at which the models achieved maximum yield loss differed. The I parameter estimate for the 2AGP-S population soybean biomass reduction model was 46.8 and 69.0 percentage points greater than those of the 2A-R and GP-R population models, respectively. Additionally, the I parameter estimate for the 2AGP-S population pod reduction model was 90.0 and 95.4 percentage points greater than those of the 2A-R and GP-R population models, respectively. The I parameter estimates show that the 2AGP-S population reaches maximum yield loss at lower A. tuberculatus densities compared with the 2A-R or GP-R populations and therefore has an interspecific competitive advantage, especially in low weed density situations.
Amaranthus tuberculatus Density-Dependent Response within a Soybean Cropping System
Asymptotic decay plant competition models (Shinozaki and Kira Reference Shinozaki and Kira1956) were individually fit for each A. tuberculatus population across the A. tuberculatus biomass and stem diameter per plant. The density-dependent A. tuberculatus response was evaluated within a competitive soybean cropping system environment to provide realistic competitive differences. Across response variables and A. tuberculatus populations, A. tuberculatus biomass and stem diameter per plant decreased asympototically as A. tuberculatus density increased.
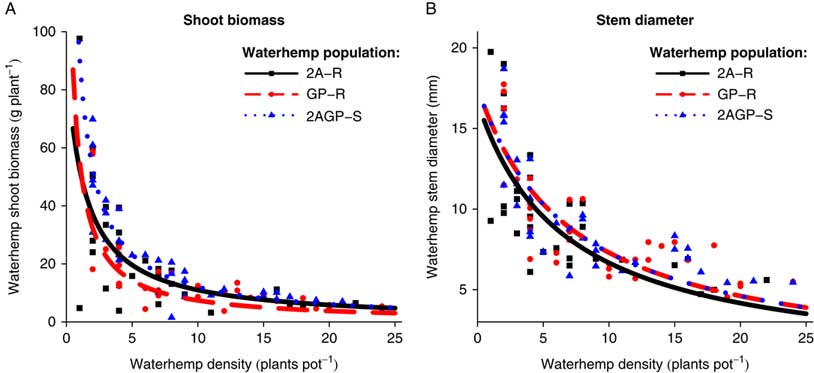
At the R1 soybean growth stage harvest time, A. tuberculatus biomass (P=0.0065, ΔAIC=−7.0376) and stem diameter (P=0.0004, ΔAIC=−13.4685) were influenced by density-dependent differences between A. tuberculatus populations (Table 1). Amaranthus tuberculatus biomass and stem diameter per plant was greatest for the 2AGP-S population, followed by the GP-R and 2A-R populations, respectively, at densities <4 plants pot−1 (Figure 4). Assessment of the inverse model parameters further validate this biological result. The a parameters indicated the maximum estimated biomass per plant in a competition-free environment was 11.6, 5.3, and 3.4 g plant−1, and the maximum estimated stem diameter per plant in a competition-free environment was 15.2, 12.5, and 9.4 mm plant−1 for the 2AGP-S, GP-R, and 2A-R populations, respectively (Table 3). An inverse trend emerged in regard to the b parameter, an indication of environmental capacity. The A. tuberculatus biomass per plant estimated environmental capacity was 47.6, 62.5, and 90.9 g pot−1 for the 2AGP-S, GP-R, and 2A-R populations, respectively. Moreover, A. tuberculatus stem diameter estimated environmental capacity of the 2AGP-S population was reduced by 33.4% and 22.3% compared with the 2A-R and GP-R populations, respectively. From these results, it can be inferred that the 2AGP-S population has the potential to be the most competitive A. tuberculatus population, followed by the GP-R and 2A-R populations, respectively, as estimated plant sizes were greater in a simulated competition-free environment. Additionally, the similar environment these populations were maintained in would not be able to sustain the size or quantity of 2AGP-S plants compared with the GP-R and 2A-R populations, as competition for environmental resources would be greater, and therefore, the environmental capacity would be reduced (Willey and Heath Reference Willey and Heath1969). The negative influence of the evolution of herbicide resistance on plant competition contradicts previous Amaranthus spp. herbicide-resistance fitness cost research that identified little to no difference between herbicide-susceptible and herbicide-resistant populations (Vila-Aiub et al. Reference Vila-Aiub, Goh, Gaines, Han, Busi, Yu and Powles2014; Wu et al. Reference Wu, Davis and Tranel2018). However, little previous research evaluated competition as a factor of fitness among herbicide-resistant A. tuberculatus populations.

Figure 4 Amaranthus tuberculatus (A) shoot biomass (g plant−1) and (B) stem diameter (mm plant−1) at the R1 harvest time as density of the three A. tuberculatus populations (2,4-D and atrazine resistant [2A-R], glyphosate and PPO-inhibitor resistant [GP-R], and 2,4-D, atrazine, glyphosate, and PPO-inhibitor susceptible [2AGP-S]) increased within a constant soybean population.
Table 3 Asymptotic Amaranthus tuberculatus yield per plant model (Shinozaki and Kira Reference Shinozaki and Kira1956; Weiner and Freckleton Reference Weiner and Freckleton2010) parameter estimates (a and b) and standard errors (SE) for each response variable as affected by the three populations and two soybean growth stage harvest times.

a Abbreviations: 2A-R, 2,4-D- and atrazine-resistant population; GP-R, glyphosate- and PPO-inhibitor-resistant population; 2AGP-S, 2,4-D-, atrazine-, glyphosate-, and PPO-inhibitor-susceptible population.
At the R7 soybean growth stage harvest time, the global F-test and ΔAIC values indicated the individual A. tuberculatus population models and the pooled model were different for A. tuberculatus biomass (P=0.0433, ΔAIC=−2.3769), but were not different for A. tuberculatus stem diameter (P=0.7869, ΔAIC=6.1682). In general, few differences were observed in both A. tuberculatus biomass and stem diameter as densities increased across the three A. tuberculatus populations (Figure 5). The a parameters for the stem diameter models estimated that maximum stem diameter per plant in a competition-free environment ranged from 16.7 to 17.5 mm, and the b parameters estimated that the environmental capacity ranged a maximum of 11.1% across the three A. tuberculatus populations, indicating similar resource requirements (Table 3). The A. tuberculatus biomass per plant estimated environmental capacities for the 2A-R and 2AGP-S populations were similar, while the GP-R population environmental capacity was 38.5% less. Although models for A. tuberculatus biomass generally appeared similar, the a parameter indicated differences for A. tuberculatus biomass that may have contributed to the individual population model significance. The estimated maximum biomass per plant in a competition-free environment as determined by the model a parameters was 90.9, 200.0, and 333.3 g plant−1 for the 2A-R, GP-R, and 2AGP-S populations, respectively. The major deviances between models occurred when A. tuberculatus densities were <1 plant pot−1, which is unreasonable in practical terms. This impractical biological assessment of model parameters at low plant densities was previously noted as one downfall to this specific model (Weiner and Freckleton Reference Weiner and Freckleton2010). Therefore, it was concluded that minimal to no differences between the A. tuberculatus populations were observed in regard to A. tuberculatus biomass and stem diameter per plant at the R7 soybean growth stage harvest time.
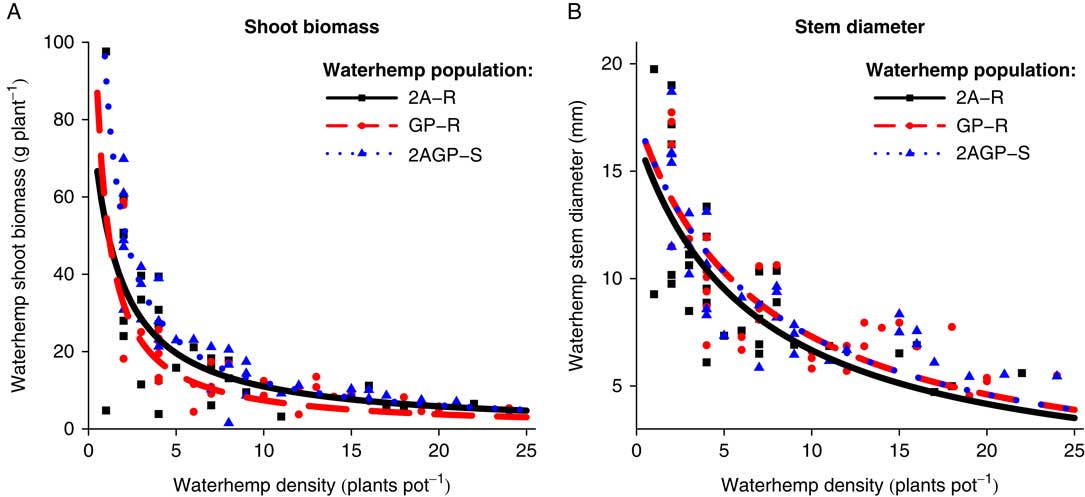
Figure 5 Amaranthus tuberculatus (A) shoot biomass (g plant−1) and (B) stem diameter (mm plant−1) at the R7 harvest time as density of three A. tuberculatus populations (2,4-D and atrazine resistant [2A-R], glyphosate and PPO-inhibitor resistant [GP-R], and 2,4-D, atrazine, glyphosate, and PPO-inhibitor susceptible [2AGP-S]) increased within a constant soybean population.
Conclusions drawn from these results are constrained by the different genetic backgrounds of each of the A. tuberculatus populations (Giacomini et al. Reference Giacomini, Westra and Ward2014) and the fact that the A. tuberculatus populations were not fully screened for other herbicide resistances. The three tested A. tuberculatus populations originated from within an 8,000-km2 area in southeastern Nebraska. Due to the relatively close proximity of origin and the rampant gene flow from A. tuberculatus populations (Sarangi et al. Reference Sarangi, Tyre, Patterson, Gaines, Irmak, Knezevic, Lindquist and Jhala2017), it is not unreasonable to assume a relatively similar genetic background. Herbicide dose–response bioassays confirmed that only one A. tuberculatus population was glyphosate resistant (Vieira et al. Reference Vieira, Samuelson, Alves, Gaines, Werle and Kruger2018), and EPSPS gene amplification was confirmed as the resistance mechanism, and no Pro-106-Ser mutation was identified (University of Illinois, Plant Clinic Molecular Testing). However, a non–target site resistance mechanism with reduced glyphosate uptake and translocation could also be present in this population (Sammons and Gaines Reference Sammons and Gaines2014). The 2A-R population was identified as resistant to ALS-inhibiting herbicides through a target-site mechanism and resistant to 2,4-D and atrazine through non–target site (metabolic) mechanisms (cytochrome P450–mediated and potentially GST activity, respectively) (Crespo et al. Reference Crespo, Wingeyer, Kruger, Riggins, Tranel and Bernards2017; Figueiredo et al. Reference Figueiredo, Leibhart, Reicher, Tranel, Nissen, Westra, Bernards, Kruger, Gaines and Jugulam2018; Vennapusa et al. 2018). Conversely, the 2A-R population was confirmed susceptible to glyphosate and PPO-inhibiting herbicides (Crespo et al. Reference Crespo, Wingeyer, Kruger, Riggins, Tranel and Bernards2017). The GP-R and 2AGP-S populations were previously confirmed t0 be atrazine susceptible (Vennapusa et al. 2018), and it was assumed these two populations were ALS-inhibitor resistant due to the prevalence of this herbicide resistance in A. tuberculatus (Schultz et al. Reference Schultz, Chatham, Riggins, Tranel and Bradley2015) and initial herbicide-resistance screening efforts (unpublished data). Although Wu et al. (Reference Wu, Davis and Tranel2018) identified ALS-inhibitor resistance fitness cost pertaining to resistant-allele frequencies within populations across multiple generations, previous research showed no growth characteristic fitness cost, as similar plant biomass and relative total yield were achieved between weed populations resistant and susceptible to ALS inhibitors (Sibony and Rubin Reference Sibony and Rubin2003). Therefore, the presence of ALS-inhibitor resistance within these three A. tuberculatus populations was deemed negligent in this research, as growth characteristics (biomass and stem diameter) were the measured plant responses to determine competitive disadvantages and fitness cost. Furthermore, the GP-R population was confirmed PPO-inhibitor resistant, while the 2AGP-S population was confirmed PPO-inhibitor susceptible (University of Illinois, Plant Clinic Molecular Testing). Initial herbicide-resistance screening indicated that only the one population was 2,4-D resistant, and no HPPD-inhibiting or dicamba herbicide resistances among these three populations were observed (unpublished data).
These results provide initial evidence that the evolution of 2,4-D, atrazine, glyphosate, and PPO-inhibitor resistance within A. tuberculatus can cause a reduction in their interspecific competitive ability. Moreover, this research validated previous hypotheses that the evaluation of plants at different growth stages may increase the possibilities of identifying fitness cost (Osipitan and Dille Reference Osipitan and Dille2017). Generally, across measured response variables, the 2A-R population was the least competitive A. tuberculatus population, while the 2AGP-S population was the most competitive. Previous research suggests the competitive disadvantage of the 2A-R population may be attributed to the cytochrome P450–mediated metabolic resistance mechanism (Vila-Aiub et al. Reference Vila-Aiub, Neve and Powles2005). Additionally, atrazine-resistant smooth pigweed (Amaranthus hybridus L.) was associated with competitive disadvantages, specifically in regard to plant growth characteristics, although the mechanism of resistance was not discussed (Ahrens and Stoller Reference Ahrens and Stoller1983; Jordan Reference Jordan1996). EPSPS gene amplification was not attributed to any fitness cost in A. palmeri (Giacomini et al. Reference Giacomini, Westra and Ward2014; Vila-Aiub et al. Reference Vila-Aiub, Goh, Gaines, Han, Busi, Yu and Powles2014); however, our research suggests this GP-R A. tuberculatus population had reduced competitive ability, but to a lesser extent than the 2A-R population. Further research is needed to fully characterize and validate the influence of herbicide-resistance evolution on the competitive ability of A. tuberculatus by establishing a similar genetic background across A. tuberculatus biotypes except for the gene or genes that confer the specific herbicide resistance (Vila-Aiub et al. Reference Vila-Aiub, Gundel and Preston2015).
Overall, results from this research indicated there was an interspecific competitive disadvantage among A. tuberculatus populations that may be attributed to the evolution of herbicide resistance. However, the authors recognize these results are limited for the specific populations tested (2AGP-S, GP-R, and 2A-R), and further studies with additional herbicide-resistant and herbicide-susceptible populations would be required to further validate these findings. No differences in soybean biomass were observed across A. tuberculatus populations at the R1 soybean growth stage harvest time. At the R7 soybean growth stage harvest time, the 2AGP-S population caused greater yield loss as measured by soybean biomass and number of pods compared with the GP-R and 2A-R populations at densities of <16 plants pot−1. The 2AGP-S population had the greatest biomass and stem diameter per plant, followed by the GP-R and 2A-R populations, respectively, at A. tuberculatus densities <8 plants pot−1 at the R1 soybean growth stage harvest time. At the R7 soybean growth stage harvest time, no observed differences in A. tuberculatus biomass and stem diameter trends between populations as densities increased were observed. Therefore, it was concluded that the 2AGP-S population had greater early-season biomass accumulation and stem diameters (e.g., more competitive) compared with the other A. tuberculatus populations, which resulted in greater late-season reduction in soybean biomass and number of pods. This information is critical for growers combating herbicide-resistant A. tuberculatus. Focus should be placed on effective use of cultural weed management practices to enhance crop competitiveness, especially early in the season, as results demonstrated this could lead to increased suppression of herbicide-resistant A. tuberculatus. This research indicates there may be evidence of a competitive fitness cost associated with the evolution of 2,4-D, atrazine, glyphosate, and PPO-inhibitor resistance in A. tuberculatus, although this hypothesis needs to be further investigated, as populations had different genetic backgrounds.
Acknowledgments
This project was partially supported by the Nebraska Agricultural Experiment Station with funding from the Hatch Multistate Research capacity funding program from the USDA National Institute of Food and Agriculture. The authors would like to thank the undergraduate and graduate students and the research support staff in the Pesticide Application Technology Laboratory located at the West Central Research and Extension Center in North Platte, NE, for their assistance with research establishment, maintenance, and data collection. No conflicts of interest have been declared.