


Introduction
The global prevalence of obesity and adiposity-related non-communicable diseases has greatly risen in recent decades, with 2 billion adults now living with overweight or obesity(1), compared with just over 100 million in 1975(2). An increasing concern in relation to rising levels of obesity-related disease has been the nutrition transition during the same time period, away from minimally processed foods (MPF), and towards greater consumption of ultra-processed foods (UPF)(Reference Popkin and Ng3). The most commonly used food processing classification, but not necessarily the most validated, is the NOVA classification (not an acronym). As defined by NOVA as foods made using extracts and components of whole foods, UPFs typically contain five or more ingredients, produced using industrial methods and ingredients not used in the home, such as bulking agents, emulsifiers and additives(Reference Monteiro, Cannon and Levy4). The nutrition transition and rising sales of UPFs has been driven by economic development, with urbanisation, shifts in workplace dynamics, expansion of multinational corporations, and with rising income levels at the national and individual level(Reference Popkin and Ng3,Reference Baker, Machado and Santos5) . As such, UPF sales are increasing around the world, with sales in middle-income countries (MIC) rapidly rising to the levels sold in high-income countries (HIC)(Reference Monteiro, Moubarac and Cannon6,Reference Vandevijvere, Jaacks and Monteiro7) .
Higher intakes of UPF are associated with a range of adverse health outcomes including obesity, type 2 diabetes, cardiometabolic disease and all-cause mortality(Reference Dicken and Batterham8,Reference Pagliai, Dinu and Madarena9) . As a result, health organisations and national dietary guidelines including the American Heart Association and Brazilian Dietary Guidelines recommend limiting UPF intake(Reference Lichtenstein, Appel and Vadiveloo10,11) , and calls have been made for systemic, national and international-level change to support individuals to reduce their UPF intake(Reference Dicken and Batterham12). However, to understand the effectiveness of universal strategies to reduce UPF intake, or whether regional policy action or targeted UPF interventions may differentially benefit certain sociodemographic groups, it is crucial to determine which individuals are consuming large quantities of UPF, and therefore who is at greatest risk of future health problems.
Previous reviews and studies suggest that higher UPF intakes are associated with male gender, younger age, lower education level and higher incomes(Reference Popkin and Ng3,Reference Baker, Machado and Santos5,Reference Zhang and Giovannucci13–Reference Marino, Puppo and Del Bo’15) . However, previous studies are subject to a number of methodological limitations. National food balance sheets provide a minimalist tool to understand national-level trends in food consumption(Reference Vandevijvere, Monteiro and Krebs-Smith16), but preclude the ability to consider sociodemographic differences in food intake. Household Budget and Expenditure Surveys based on food purchases can be used as a proxy to estimate household or individual intakes and allow for sociodemographic stratification, but still include biases such as food waste and food loss, and preclude the ability to determine food consumption by specific individuals in the household(Reference Vandevijvere, Monteiro and Krebs-Smith16). Dietary assessment using food consumption tools (e.g. 24-h dietary recalls, food diaries and food frequency questionnaires (FFQ)) are considered optimal measures to assess individual-level food consumption(Reference Vandevijvere, Monteiro and Krebs-Smith16).
Many of the large-scale, health-based cohort studies that assess individual-level UPF intake and their relationship with health outcomes also consider sociodemographic associations with UPF consumption(Reference Dicken and Batterham8). Such studies use convenience sampling methods that may include biases such as a healthy volunteer selection bias, or lead to underrepresentation or exclusion of sociodemographic strata, resulting in such samples not being generalisable to the national population. Smaller samples from cities or specific regions may be representative of such regions but are also unlikely to accurately represent the national population. In combination with food consumption assessments, nationally representative samples typically obtained with complex, multistage probabilistic sampling are needed to provide country-level distributions of UPF intake by sociodemographic factors.
No study has systematically reviewed and formally synthesised papers assessing the association between sociodemographic factors and individual-level UPF intake from nationally representative samples. Current reviews of sociodemographic predictors of individual-level UPF intake are not systematic(Reference Zhang and Giovannucci13,Reference Crimarco, Landry and Gardner14) , and do not focus on studies that are nationally representative(Reference Zhang and Giovannucci13), or consider only age and gender(Reference Marino, Puppo and Del Bo’15) or systematically review nationally representative samples without considering sociodemographic predictors of UPF intake(Reference Martini, Godos and Bonaccio17).
The objective of this review was to systematically synthesise the evidence regarding sociodemographic characteristics associated with a high, individual-level UPF intake as defined by NOVA, in nationally representative samples.
Methods
This systematic review was pre-registered on PROSPERO (CRD42022360199), and conducted according to Preferred Reporting Items for Systematic Reviews Meta-Analysis (PRISMA) guidelines(Reference Page, McKenzie and Bossuyt18). The checklist is provided in the supplementary materials. The protocol was unchanged from pre-registration.
Eligibility criteria
Eligibility criteria were considered based on the population, exposure, comparator, outcome (PECO) approach: population: nationally representative sample of adults (with or without children) from any country; exposure: any sociodemographic measure; comparator: other levels or strata of a sociodemographic measure; outcome: absolute or relative individual-level consumption of UPF, defined by the NOVA classification.
Studies were included if they were: written in English; an original article published in a peer-reviewed journal; from any date; a cross-sectional or longitudinal observational study; a nationally representative sample of adults (with or without children) from any country; statistically assessing the association between sociodemographic characteristics and UPF intake; with individual-level, relative or absolute UPF intake analysis (e.g. g/d, %kJ/d). defined by the NOVA classification(Reference Monteiro, Cannon and Levy4), using detailed food consumption assessment tools.
Papers were excluded if they: were not in English; were not published in a peer-reviewed journal; were a review, ecological study, interventional trial, laboratory study or animal study; were not a nationally representative sample of adults or a subgroup of a nationally representative sample (e.g. elderly adults only or females only); did not provide statistical measures of the association between sociodemographic variables and UPF intake; did not define UPF intake using the NOVA classification (or used NOVA, but the dietary outcome was determined using principal component or latent class analysis); only measured a subgroup of UPFs (e.g. only sugar-sweetened beverages, only sweet UPFs); did not directly assess individual-level dietary intake (e.g. UPF intake based on sales, household purchases).
Search strategy and study selection
Identification of papers was achieved by searching PubMed/MEDLINE until 7 September 2022. No filters or limits were placed on searches. PubMed/MEDLINE was searched with the terms: ‘ultra-processed’ OR ‘ultraprocessed’ OR ‘ultra-processing’ OR ‘ultraprocessing’, producing 1131 results. Results were obtained and imported into Excel by S.J.D.
The selection process was independently conducted by two authors (S.J.D. and S.Q.). To select papers, the authors developed a flowchart for full-text selection from title and abstract review, and a flowchart for full-text review to determine inclusion into the systematic review (provided in the supplementary materials). Flowcharts were based on the inclusion/exclusion criteria. Titles and abstracts were independently screened by both authors for relevance using the flowcharts. Full papers were then retrieved for eligibility analysis. All papers were manually screened, with no automation tools. After full-text screening, both authors met to discuss any disagreements. S.J.D. then screened the references and citations of included papers, which were then agreed upon by two authors (S.J.D. and S.Q.). As the selection process was predetermined prior to data extraction, all papers from the same nationally representative survey were considered for inclusion, as different papers from the same country and survey may report different sociodemographic predictors and/or cover different time periods. If papers were deemed eligible for the systematic review based on inclusion/exclusion criteria but contained no statistical assessment of UPF intake across sociodemographic variables (e.g. confidence intervals of mean intake across strata, p-values of proportions across quantiles of UPF intake), the authors were contacted to provide statistical detail.
Outcomes included absolute or relative (to total energy or food intake by weight) individual-level UPF intake (such as servings/d, kJ/d, percent (%) kJ/d or g/d). Studies needed to report at least one unit of measurement for inclusion. The effect measures were the statistical assessments of an association between sociodemographic variables and UPF intake (e.g. for inferential statistics: beta coefficients or odds ratios and confidence intervals and/or p-values, for descriptive statistics: mean intakes and/or intakes across quantiles and confidence intervals and/or p-values, correlations and p-values).
Data extraction
Two authors (S.J.D. and S.Q.) independently and manually extracted data using a pre-specified template. The data extracted by the authors included: title; authors; date of publication; country; cohort; sampling method; analytical sample size; dietary assessment method; sociodemographic assessment method; primary measure of UPF intake; average UPF intake for the sample; sociodemographic variables; unadjusted or adjusted measures of association; UPF intake across sociodemographic strata and/or statistical measures of association.
Assessment of methodological quality
Risk of bias was assessed using the Newcastle–Ottawa Scale (NOS) method adapted for cross-sectional observational studies (supplementary materials). Risk of bias was independently conducted by two authors (S.J.D. and S.Q.), with disagreements resolved through discussion. No formal assessments were conducted for risk of reporting bias due to missing results.
A certainty assessment was conducted by considering the risk of bias scores, limitations in included studies, and gaps in the narrative analysis across each grouping (number of countries, range of sociodemographic predictors, range of multivariate analyses).
Data synthesis
Papers were presented in tabular format, reporting the key characteristics of each study, including risk of bias. No data conversion or handling of missing data was conducted prior to data presentation. Results are presented as a narrative synthesis due to the varied reporting methods and statistics across studies. Results are reported in terms of the number of distinct countries, number of distinct surveys and number of unique analyses. Papers were grouped for narrative analysis according to study characteristics from the variables extracted during data collection to assess heterogeneity of associations: by country, across countries, by sociodemographic variable, by country-level income and by multivariate analyses. Simple descriptive fractions are provided of which predictors were significantly associated with UPF intake, and which were not. No sensitivity analyses were planned. For papers from the same survey, during the same years and with the same predictors, the multivariate analyses were prioritised in the narrative review.
Results
Study selection
The database search retrieved 1131 results. Two-hundred forty-five results were retained for full-text screening. Fifty-five studies were included in the systematic review. The results are detailed in the PRISMA flowchart (Fig. 1).
PRISMA Flow diagram of the systematic search process and study selection.

Several studies appeared to meet the inclusion criteria but were excluded as: authors did not respond to emails requesting further detail on statistical associations(Reference Liu, Steele and Li19,Reference Shim, Shim and Cha20) , statistical values were not available after request(Reference Pestoni, Habib and Reber21) or were not nationally representative(Reference Li and Shi22,Reference Teo, Tso and van Dam23) . One study was excluded, as despite being a nationally representative cohort the authors explicitly outlined that the analytical sample could not be considered nationally representative(Reference Huang, Huang and Lo24). One case–control study was not deemed to be nationally representative, although the authors suggested it was(Reference El Kinany, Huybrechts and Hatime25). One paper from Brazil was excluded on the basis of the use of a crude FFQ, reporting the frequency of consumption of ten items to determine UPF intake(Reference Costa, Steele and Faria26). One paper from Mexico was included as participants were randomly selected from a nationally representative cohort, despite the small sample size(Reference Oviedo-Solís, Monterrubio-Flores and Rodríguez-Ramírez27).
Study characteristics
In total, fifty-five studies were included in the systematic review, covering thirty-two countries and thirty-six nationally representative surveys. Fifty-four studies were from seventeen individual countries from nineteen nationally representative surveys, with one additional study spanning twenty-two European countries(Reference Oviedo-Solís, Monterrubio-Flores and Rodríguez-Ramírez27–Reference Shim81). The main study characteristics are reported in Table 1. Sample size varied from 359(Reference Harris, Rose and Soares-Wynter32) to 57 423(Reference Shim, Shim and Cha50). Five of the studies were included after considering citations of the included papers from the systematic search(Reference Grech, Rangan and Allman-Farinelli28,Reference Louzada, Levy and Martins35,Reference Nilson, Ferrari and Louzada39,Reference Bertoni Maluf, Bucher Della Torre and Jotterand Chaparro61,Reference Madruga, Steele and Reynolds63) .
Studies included in the systematic review, and study-level associations of sociodemographic predictors and UPF intake.

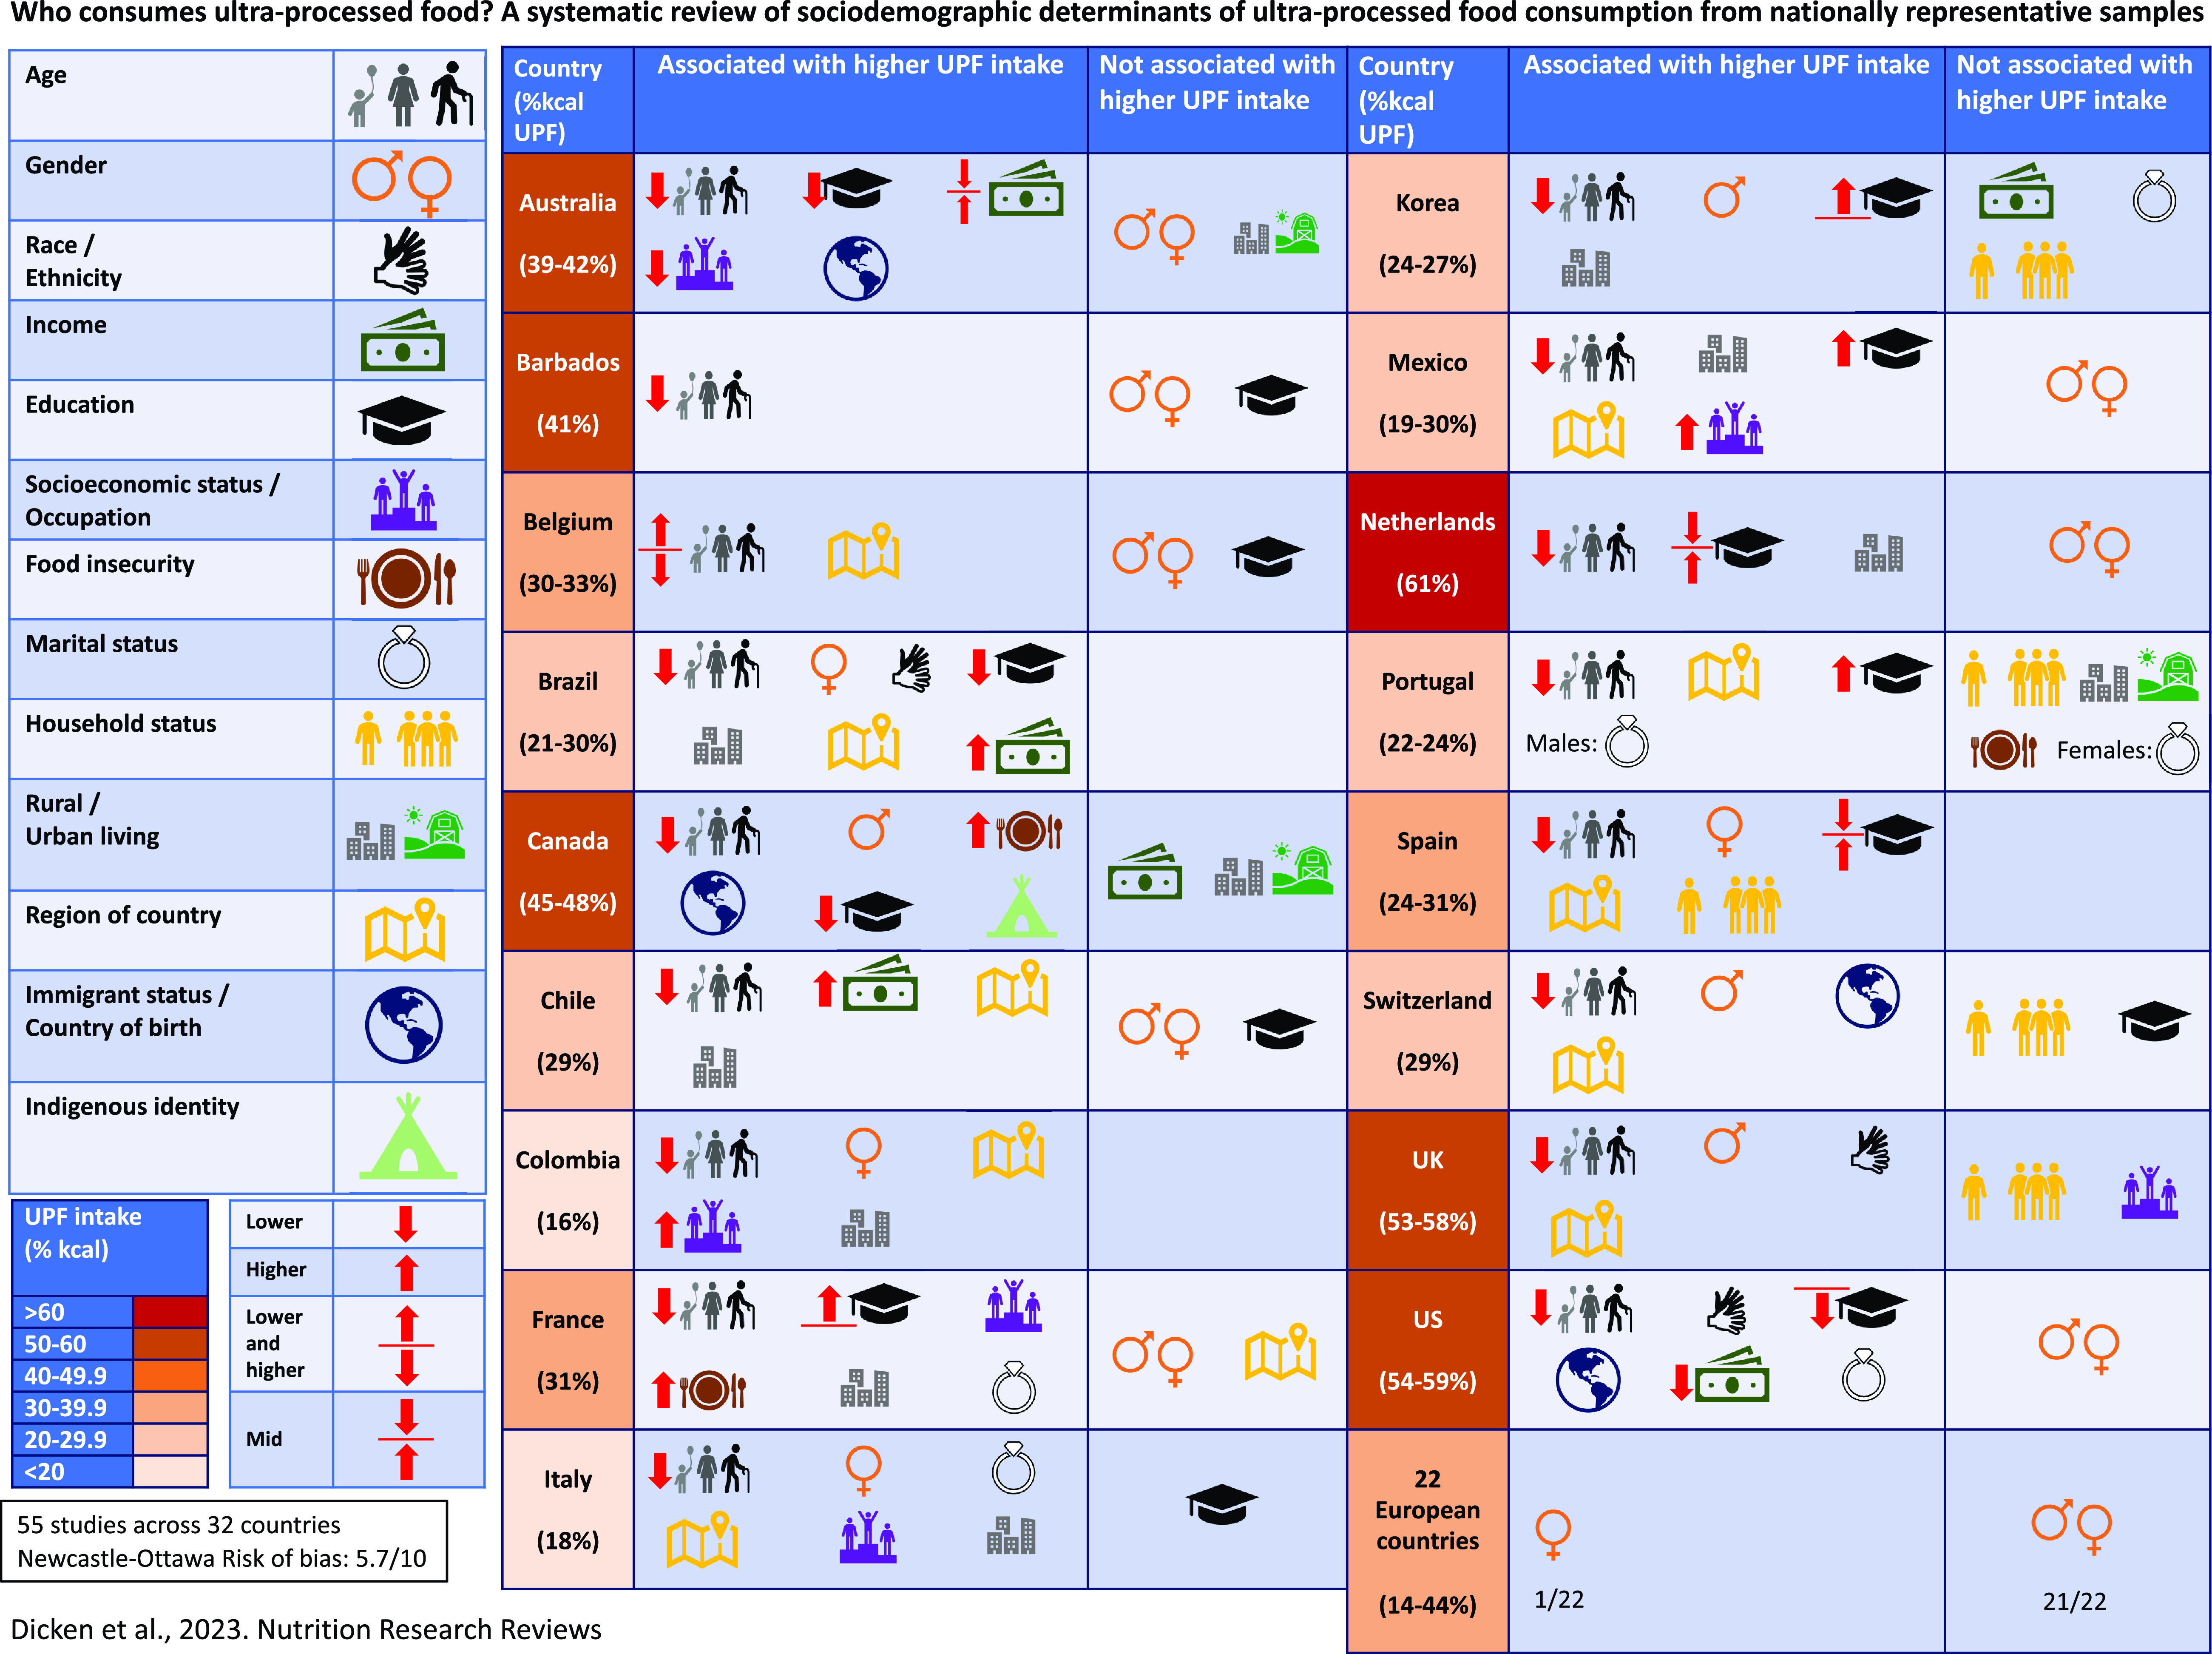
Thirteen sociodemographic characteristics were assessed as predictors of UPF, including age, gender, race/ethnicity, income, education level, socioeconomic status/occupation/occupational social class, food security, marital status, household status (number and type of individuals (child, adult, elderly), rural/urban location, region of the country, immigrant status/country of birth and indigenous identity. One sociodemographic association was reported in fifteen countries, and at least three sociodemographic associations were reported in seventeen countries. Seven or more sociodemographic associations were reported in eight countries.
The included studies are detailed in Table 1, with statistical associations between sociodemographic variables and UPF intake reported in each study presented in Table 2.
Statistical associations between sociodemographic variables and UPF intake reported in each study. Adjusted estimates are reported where provided, or else unadjusted measures are reported

Associations by country
Australia
In Australia, average UPF intake was 38·8% of total energy (standard error (SE): 0·2)(Reference Marchese, Livingstone and Woods31). In unadjusted models, younger age, male gender, second/third/fourth household income quintiles (the combined income of all household members), a lower education level, a lower Socio-Economic Index for Areas (SEIFA) (greater area-level disadvantage), living in inner regional Australia (versus living in a major city of Australia) and being Australian born or from an English-speaking country were associated with higher intakes of UPF(Reference Grech, Rangan and Allman-Farinelli28–Reference Marchese, Livingstone and Woods31). The associations remained unchanged in adjusted models (adjusted for all other sociodemographic variables and diet quality)(Reference Marchese, Livingstone and Woods31), except for gender and rurality/urbanisation, which were no longer significant.
In the adjusted model, 19–30-year-olds consumed 8·3% (95% confidence interval (CI): 6·4, 10·3) more UPF as a proportion of total energy than 51–70-year-olds(Reference Marchese, Livingstone and Woods31). The middle quintiles (second, third and fourth) of income had the highest intakes of UPF, with the highest income quintile associated with the lowest intake of UPF, 4·6% less than the second quintile (36·5% (SE: 0·7) versus 41·1% (SE: 0·8))(Reference Marchese, Livingstone and Woods31). Individuals with the lowest education level (incomplete high school education or lower) consumed 2·3% (95% CI: 0·2, 4·5) more UPF as a proportion of total energy than individuals with the highest levels of education (tertiary qualification) (39·9% (SE: 0·7) versus 37·6% (SE: 0·6)).
Barbados
In Barbados during 2012–2013, the average intake of UPF was 41% of total energy (3506 kJ from UPF/d (95% CI: 3310, 3703)). A younger age was associated with a roughly 20% greater UPF intake (25–44 years old: 3712 kJ/d (95% CI: 3498, 3941), 45–64 years old: 3084 kJ/d (95% CI: 2900, 3268), but gender and level of education were not significantly associated with UPF intake(Reference Harris, Rose and Soares-Wynter32).
Belgium
In Belgium, the average UPF intake was 29·9% (95% CI: 29·0, 30·8) in 2014–2015(Reference Vandevijvere, De Ridder and Fiolet33,Reference Vandevijvere, Pedroni and De Ridder34) . Unadjusted UPF intakes were higher with a younger age, but there was no difference in UPF intakes across education levels or between genders (males: 29·6% (95% CI: 28·0, 31·0) versus female: 29·2% (95% CI: 28·0, 30·9))(Reference Vandevijvere, De Ridder and Fiolet33,Reference Vandevijvere, Pedroni and De Ridder34) . However, in 2004, males had a higher UPF intake than females (32·3% (95% CI: 30·9, 34·3) versus 28·9% (95% CI: 27·1, 30·2))(Reference Vandevijvere, De Ridder and Fiolet33).
In adjusted models (adjusted for age, region, BMI and breakfast consumption frequency), age and region of Belgium were significantly associated with UPF intake. It was found that 3–5- and 51–64-year-olds consumed approximately 6–8% more UPF as a proportion of total energy than 6–50-year-olds, with 3–5-year-olds consuming 8·6% (SE: 2·1) more UPF as a proportion of total energy than 35–50-year-olds. Individuals living in Brussels region (+6·1% (SE: 1·2)) or Walloon region (+8·1% (SE: 0·8)) also had significantly higher UPF intakes than individuals living in Flanders region(Reference Vandevijvere, De Ridder and Fiolet33).
Brazil
In Brazil during 2008–2009, average UPF intake varied across studies, from 20% to 30% of total energy (20·5% (95% CI: 20·2, 20·8)(Reference Canella, Louzada and Claro38), 22·1%(Reference Louzada, Levy and Martins35), 23·8%(Reference Verly-Jr, Pereira and Marques36), 29·6%(Reference Louzada, Baraldi and Steele37)). A younger age, female gender, white ethnicity (versus African-descendent or other ethnicity), higher income, higher education level, urban residence and living in the South and South East regions of Brazil were associated with higher intakes of UPF, or were more likely to be in the highest versus lowest quintile of UPF intake ((≥44% versus ≤13% of TEI)(Reference Louzada, Levy and Martins35–Reference Louzada, Baraldi and Steele37,Reference Louzada, Baraldi and Steele37) .
In unadjusted associations, females (21·8% (95% CI: 21·3, 22·2)) consumed 2·6% more UPF as a proportion of total energy than males (19·2% (95% CI: 18·7, 19·7)). It was found that 20–39-year-olds consumed 6·3% more energy as UPF than adults 60 years or older (21·3% (95% CI: 20·8, 21·9) versus 15·0% (95% CI: 14·2, 15·8)), and 10–19-year-olds (26·8% (95% CI: 26·1, 27·6)) consumed over 11% more. Individuals in the highest-income tercile consumed over 10% more UPF as a proportion of total energy compared with individuals in the lowest income tercile (26·3% (95% CI: 25·7, 26·9) versus 15·1% (95% CI: 14·6, 15·5)). Similar magnitude differences in UPF intake were seen across the highest (28·5%) versus lowest (15·7%) terciles of income in another study (p < 0·001)(Reference Louzada, Levy and Martins35), and when grouped by multiples of minimum wage (MW), with individuals earning >3× MW consuming 30·3% of total energy from UPF, compared with those earning <0·5 MW, who consumed 16·3% of total energy from UPF(Reference Verly-Jr, Pereira and Marques36). Individuals living in an urban residence also consumed nearly 10% more total energy from UPF than individuals in rural settings (22·1% (95% CI: 21·7, 22·5) versus 12·7% (95% CI: 12·3, 13·2)). Those in South and Southeast Brazil consumed 25·7% (95% CI: 25·0, 26·4) and 23·6% (95% CI: 23·0, 24·2) of energy as UPF, respectively, approximately 10% more than in the North (14·8% (95% CI: 14·3, 15·4)) and North East (14·9% (95% CI: 14·5, 15·3)) regions(Reference Canella, Louzada and Claro38).
In 2017–2018, a younger age was associated with a higher UPF intake. It was found that 15–19-year-old males (25·1% (95% CI: 23·3, 26·9)) consumed relatively over 100% more UPF than males aged 80+ (12·7% (95% CI: 10·5, 15·0)), and over a 50% relative increase in 15–19-year-old females (26·2% (95% CI: 24·5, 28·0)) compared with older females (80+) (17·9% (95% CI: 13·7, 22·1))(Reference Nilson, Ferrari and Louzada39).
Canada
In Canada in 2004, a younger age, male gender, lower education level, rural residence and non-immigrant status were associated with greater unadjusted intakes of UPF(Reference Moubarac, Batal and Louzada40–Reference Polsky, Moubarac and Garriguet42). Sociodemographics remained significantly associated with UPF intake in the adjusted model (adjusted for age, gender, education, income, physical activity, smoking status, immigration status and residential area), except for rural residence, which became non-significant(Reference Nardocci, Leclerc and Louzada41). Family income per capita was not significantly associated with UPF intake in either unadjusted or adjusted models from 2004(Reference Moubarac, Batal and Louzada40,Reference Nardocci, Leclerc and Louzada41) . Non-immigrants consumed over 10% more energy from UPF than non-immigrants (47·8% (SE: 0·3) versus 36·5% (SE: 0·3), p < 0·05)(Reference Nardocci, Leclerc and Louzada41).
In 2015, the average UPF intake in 2015 was approximately 46–47% (45·7% (95% CI: 45·0, 46·4)(Reference Polsky, Moubarac and Garriguet42), 46·8% (SE: 0·4)(Reference Nardocci, Polsky and Moubarac44)). A younger age, male gender, higher income, lower education level, higher level of food insecurity, rural residence, non-immigrant status and Indigenous identity were associated with higher intakes of UPF, or were more likely to be in the highest versus lowest tercile of UPF intake (72·8% versus 24·4%)(Reference Polsky, Moubarac and Garriguet42–Reference Nardocci, Polsky and Moubarac44).
Adult males (45·4% (95% CI: 43·8, 47·0)) consumed more energy from UPFs than adult females (41·6% (95% CI: 40·2, 43·0)), with no significant difference between males and females aged 55 or older(Reference Polsky, Moubarac and Garriguet42). Income was associated with UPF intake in 2015 (p = 0·0143), with the highest income quintiles more likely to be in the highest versus lowest tercile of UPF intake(Reference Nardocci, Polsky and Moubarac44). One paper in 2015 reported age and gender associations with UPF intake across levels of food insecurity(Reference Hutchinson and Tarasuk43). Males (47·0% (SE: 3·7)) and females (45·8% (SE: 2·4)) aged 19–64 with severe food insecurity consumed approximately 8–10% more of total energy from UPFs than males (37·5% (SE: 0·66)) and females (37·6% (SE: 0·56)) aged 19–64 with food security (both comparisons p < 0·05, p-trend across levels of food insecurity: males 0·009, females 0·003)(Reference Hutchinson and Tarasuk43).
In trend analyses from 2004 to 2015, UPF intake significantly increased in older (55 or older) males (from 42·5% (95% CI: 41·5, 43·6) to 45·3% (95% CI: 43·9, 46·7)) and females (from 41·7% (95% CI: 40·6, 42·8) to 45·2% (95% CI: 44·0, 46·4)), but significantly decreased in children aged 2–12, adolescent males and females aged 13–18, and adult males and females 19–54(Reference Polsky, Moubarac and Garriguet42).
Chile
In Chile in 2010, the average UPF intake was 28·6% (95% CI: 27·7, 29·6)(Reference Cediel, Reyes and da Costa Louzada45). A younger age, higher family income, urban residence and living in the Metropolitan region were associated with higher intakes of UPF in both unadjusted and adjusted (for all other sociodemographic variables) models(Reference Cediel, Reyes and da Costa Louzada45). Gender and the level of education of the head of the household were not significantly associated with UPF intake in either unadjusted and adjusted models.
In the adjusted model, 2–19-year-olds consumed over double the quantity of UPF of adults 65 or older (2–19-year-olds: 38·6% (95% CI: 36·7, 40·6) versus 65 or older: 18·3% (95% CI: 16·8, 19·8)). There was a linear trend, with 20–49-year-olds consuming 26·7% (95% CI: 25·2, 28·2) and 50–64-year-olds consuming 21·8% (95% CI: 19·7, 24·0) of total energy from UPFs (p-trend <0·001)(Reference Cediel, Reyes and da Costa Louzada45). There was also a linear trend in UPF intake across family incomes. Individuals from families with the highest incomes consumed over 4% more of total energy from UPFs than individuals from families with the lowest family incomes (≥6× MW: 30·1% (95% CI: 27·7, 29·6), 3–5× MW: 30·0% (95% CI: 27·8, 32·2), 2× MW: 28·7% (95% CI: 27·2, 30·3), 1× MW: 25·8% (95% CI: 24·0, 27·6)). Individuals living in urban residences consumed 29·3% (95% CI: 21·9, 25·5) of total energy from UPFs, compared with 23·7% (95% CI: 28·3, 30·4) in rural residences, nearly a 25% greater relative intake. Individuals living in the Metropolitan region of Chile had the highest UPF intakes of all regions (30·2% (95% CI: 28·6, 31·8)), approximately 2–3% greater than other regions, and significantly greater than the South, where the average adjusted UPF intake was 26·7% (95% CI: 24·8, 28·6)(Reference Cediel, Reyes and da Costa Louzada45).
Colombia
In Colombia, average UPF intake was 15·9% of total energy in 2005, spanning from 0·2% to 41·1% across quintiles of UPF intake(Reference Khandpur, Cediel and Obando46). A younger age, female gender, higher socioeconomic status (based on the System for the Selection of Beneficiaries of Social Programs (SISBEN) composite index), urban residence and living in Bogotá were significantly associated with higher intakes of UPF in unadjusted and adjusted (adjusted for all aforementioned sociodemographic variables) models(Reference Khandpur, Cediel and Obando46).
In the adjusted model, 2–19-year-olds consumed nearly 8% more UPF as a proportion of total energy than adults aged 50 or over (2–19-year-olds: 19·3% (SE: 0·3), 10–19-year-olds: 19·3% (SE: 0·2), 50 or over: 11·4% (SE: 0·4)). Individuals in the highest socioeconomic level (22·8% (SE: 1·0)) consumed nearly twice the quantity of UPF (over 10% more as a proportion of total energy) of individuals in the lowest socioeconomic level (12·7% (SE: 0·3)). There was a small but significant difference between genders, whereby males consumed 15·5% (SE: 0·2) of total energy from UPF compared with 16·2% (SE: 0·2) in females (p = 0·007). Individuals living in urban residences (17·3% (SE: 0·2)) had 4·6% and 6·1% higher intakes of UPF than people from central (12·6% (SE: 0·5)) or rural (11·2% (SE: 0·6)) residences, respectively (both comparisons, p < 0·001). Regionally, the highest intakes of UPF were in residents of Bogotá (21·6% (SE: 0·5)) followed by the Eastern region of Colombia (18·1% (SE: 0·4)). The lowest intakes were in the Atlantic region of Colombia (12·7% (SE: 0·3)), nearly half the levels reported in Bogotá(Reference Khandpur, Cediel and Obando46).
France
The average UPF intake in France was 31·1% (95% CI: 30·3, 31·9) in 2006–2007(Reference Calixto Andrade, Julia and Deschamps47), and 30·6% (standard deviation (SD): 15·8) in 2014–2015(Reference Salomé, Arrazat and Wang48). In 2006–2007, a younger age, a complete high school or greater education level, occupation (management/intermediate profession, self-employed/farmer, manual worker/employee, homemaker or disabled person or other versus retired persons) and urban residence were associated with higher intakes of UPF(Reference Calixto Andrade, Julia and Deschamps47). It was found that 18–39-year-olds consumed nearly double the amount of UPF as a proportion of total energy than adults aged 60 or older (39·1% (95% CI: 37·8, 40·5) versus 21·6% (95% CI: 20·4, 22·8)). Homemakers, disabled persons and other occupations had the highest UPF intake (35·9% (95% CI: 34·1, 37·7)), followed by management or intermediate professions (32·2% (95% CI: 30·9, 33·4)), manual workers or employees (32·7% (95% CI: 31·3, 34·2)) and self-employed individuals or farmers (28·1% (95% CI: 25·1, 31·2)). Retired individuals had significantly lower UPF intake than all other occupations, approximately a third less, at 22·3% of total energy (95% CI: 21·1, 23·5). Individuals with complete high school education (32·9% (95% CI: 31·8; 34·1)), completing a technical course (32·2% (95% CI: 30·3, 34·0) or university education (31·9% (95% CI: 30·4, 33·4)) had similarly high intakes, whereas individuals with an incomplete high school education had approximately 6% lower intake as a proportion total energy (26·5% (95% CI: 24·9, 28·1)), a roughly 20% lower relative intake(Reference Calixto Andrade, Julia and Deschamps47). Urban residents consumed 3% more UPF as a proportion of total energy than rural residents (31·9% (95% CI: 30·9; 32·8) versus 28·9 (95% CI: 27·4, 30·4)).
During 2014–2015, age, education level, occupation, marital status, food insecurity and rurality/urbanisation were associated with higher intakes of UPF(Reference Salomé, Arrazat and Wang48). Individuals in the highest versus lowest tercile of UPF intake (34·1–78·9% versus 0·1–20·6% of energy from UPF) were more likely to be younger, have middle or secondary school education, be an employee, manual worker, have an intermediate profession or be inactive, have moderate or severe food insecurity, be single or in an unmarried couple, or live in a city with 100 000 or more inhabitants(Reference Salomé, Arrazat and Wang48). Individuals in the lowest versus highest tercile of UPF intake were more likely to be older, have a primary school education, be retired, a farmer, craftsman, shopkeeper or business owner, have a rural residence, be married or widowed or have food security(Reference Salomé, Arrazat and Wang48).
Across both 2006–2007 and 2014–2015, UPF intake did not significantly differ with gender(Reference Calixto Andrade, Julia and Deschamps47,Reference Salomé, Arrazat and Wang48) , nor with the region of France in 2014–2015.
Italy
In Italy in 2010–2013, the average unadjusted UPF intake among Italian adults (aged 20–97) was 17·3% of total energy (95% CI: 17·1, 17·6), rising to 25·9% (95% CI: 24·8, 27·0) in children and adolescents aged 5–19. A younger age, female gender, occupation other than being retired, marital status, urban residence and region of Italy were associated with higher intakes of UPF in the adjusted model (adjusted for the aforementioned sociodemographic predictors, education level, smoking, physical activity and disease history)(Reference Ruggiero, Esposito and Costanzo49). Education level was not significantly associated with UPF intake.
In the adjusted model, differences in adult UPF intake across levels of sociodemographics varied by approximately 10% as a relative proportion of UPF intake(Reference Ruggiero, Esposito and Costanzo49). It was found that 20–40-year-olds consumed 3·1% (95% CI: 1·8, 4·4) more of total energy from UPF than adults aged 65 or older. Females consumed 1·28% (95% CI: 0·68, 1·89) more UPF than males. Individuals who were unmarried (+1·26% (95% CI: 0·37, 2·15)), separated or divorced (+1·88% (95% CI: 0·38, 3·38)) and widowed (+1·16% (95% CI: 0·07, 2·24)) consumed more energy from UPF than individuals who were married. Individuals in North Italy consumed 0·73% (95% CI: 0·14, 1·32) more UPF as a proportion of total energy than individuals in South Italy, but intakes in North or South Italy did not significantly differ to those living in Central Italy. Urban residents consumed 1·64% (95% CI: 0·87, 2·42) more UPF as a proportion of total energy than rural residents(Reference Ruggiero, Esposito and Costanzo49), and retired persons consumed significantly less UPF than all other occupations (manual, non-manual, housewife, student or unemployed), nearly 2% less than manual occupations (−1·87% (95% CI: −0·91, −2·83)).
Korea
In Korea across 2010–2018, the average UPF intake was 24·9% (SE: 0·1)(Reference Shim, Shim and Cha50). A younger age, male gender, lower income, mid/high education level and urban residence were associated with higher unadjusted intakes of UPF. All sociodemographic predictors remained significant in the adjusted model (adjusted for all aforementioned sociodemographics), except for household income(Reference Shim, Shim and Cha50).
In the adjusted model, there was a linear trend of decreasing UPF with increasing age (p-trend <0·05). Adolescents (13–19-year-olds) consumed the highest amount of UPF, over double the amount of UPF of adults 65 or older as a proportion of total energy (33·8% (95% CI: 32·9, 34·6) versus 16·3% (95% CI: 15·8, 16·7)). Individuals with a high school (26·4% (95% CI: 25·9, 26·9)), or college or higher education level (26·3% (95% CI: 25·8, 26·9)) consumed about 10% relative greater UPF intake than individuals with a middle school or lower education level (23·4% (95% CI: 23·0, 23·8)). Males and urban residents consumed 3% more UPF relatively than females and rural residents, respectively (both comparisons: 25·8% (95% CI: 25·5, 26·1) versus 25·0% (95% CI: 24·4, 25·6))(Reference Shim, Shim and Cha50).
In 2016–2018, a younger age (greatest in adolescents), male gender, mid/high education level, living alone and urban residence were associated with higher unadjusted intakes of UPF, or were more likely to be in the highest (43·6%) versus lowest (6·9%) tercile of UPF intake(Reference Shim, Shim and Cha50–Reference Shim, Kim and Shim52,Reference Shim81) . Unadjusted UPF intakes did not significantly vary across household income levels in 2016–2018 in two smaller KNHANES samples (n = 7364, aged 19–64(Reference Sung, Park and Oh51), and n = 9188, aged 30–79(Reference Shim, Kim and Shim52)). However, UPF intake did significantly vary in a larger sample from 2016 to 2018 (n = 19 216, aged 1 or older)(Reference Shim, Shim and Cha50), whereby individuals in the second and third quartiles (26·7% (95% CI: 26·1, 27·2)) or highest quartile (27·2% (95% CI: 26·5, 27·8)) of household income had significantly higher UPF intakes than individuals in the lowest household income quartile (22·0% (95% CI: 20·9, 23·1)). In the only study reporting adjusted (adjusted for aforementioned sociodemographics, smoking, alcohol and physical activity) UPF intakes from 2016 to 2018, where the average UPF intake was 26·8% (SE: 0·3), age, gender and education level remained significantly associated with UPF intake, but household income, household status, marital status and rurality/urbanisation were not significantly associated with UPF intake(Reference Sung, Park and Oh51). Adjusted intakes of UPF in males were 1·4% higher than females (27·6% (SE: 0·4) versus 26·2% (SE: 0·4)), p = 0·0165). It was found that 19–29-year-olds consumed two-thirds more UPF than 50–64-year-olds (34·6% (SE: 0·8) versus 20·6% (SE: 0·4)), p < 0·0001), with a linear trend of decreasing UPF intake with older age (p-trend <0·0001). Similar to the associations in 2010–2018, individuals with a high school education (27·6% (SE: 0·4), p < 0·01), or college or higher education (26·8% (SE: 0·4), p < 0·05), consumed about 10% more UPF relative to individuals with a middle school or lower education level (25·0% (SE: 0·4), p < 0·05)(Reference Sung, Park and Oh51).
Average UPF intake increased over time in Korea, from 23·1% (95% CI: 22·7, 23·5) in 2010–2012, to 25·5% (95% CI: 25·1, 25·9) in 2013–2015, to 26·1% (95% CI: 25·7, 26·5) in 2016–2018 (p < 0·0001). UPF intake significantly increased across all sociodemographic strata (age, gender, rural/urban residence, education level and household income). In particular, 20–49-year-olds increased their UPF intake to the greatest extent, by 5% from 2010 to 2018, from 24·8% (95% CI: 24·3, 25·4) to 29·8% (95% CI: 29·2, 30·4)(Reference Shim, Shim and Cha50).
Mexico
In Mexico in 2012, the average UPF intake (aged 1 or older) was 29·8% (SE: 0·4) of total energy(Reference Marrón-Ponce, Sánchez-Pimienta and Louzada54). A younger age, higher head of household education level, higher socioeconomic status, urban residence and living in the Northern region of Mexico were more likely to be in the highest (64·2% (range: 51·8–100%)) versus lowest (4·5% (range: 0–11·8%)) quintile of UPF intake (all sociodemographic variable distributions across quintiles p < 0·001)(Reference Marrón-Ponce, Flores and Cediel53). Sociodemographic variables remained significantly associated with UPF intake after adjustment for all other sociodemographic variables(Reference Marrón-Ponce, Sánchez-Pimienta and Louzada54). However, gender was not significantly associated with UPF intake in unadjusted or adjusted models(Reference Marrón-Ponce, Flores and Cediel53,Reference Marrón-Ponce, Sánchez-Pimienta and Louzada54) .
In one study of adults only from ENSANUT, adults younger than 60 consumed 21·4% of total energy from UPF (95% CI: 18·8, 24·0), compared with 14·2% (95% CI: 10·7, 17·6) in adults 60 or older, a 50% relative increase(Reference Oviedo-Solís, Monterrubio-Flores and Rodríguez-Ramírez27). In the adjusted model across all age groups, pre-school-aged children (+12·5% (95% CI: 10·9, 14·1)), school-aged children (+3·8% (95% CI: 2·2, 5·4)) and adolescents (+3% (95% CI: 1·1, 4·9)) all consumed greater amounts of UPF than adults. Individuals in North Mexico and Central Mexico consumed 8·4% (95% CI: 6·6, 10·1) and 2·7% (95% CI: 1·2, 4·1) more UPF as a proportion of total energy than individuals in South Mexico. Individuals from households with the highest head of household education level (college education) consumed 7·8% (95% CI: 4·3, 11·4) more UPF as a proportion of total energy than individuals from a household with a head of household without any education. Individuals from a household with a head of household with an intermediate education level consumed 1·9% (95% CI: −0·5, 4·3) (elementary), 3·4% (95% CI: 0·8, 6·1) (middle school) and 4·3% (95% CI: 1·1, 7·4) (high school) more UPF as a proportion of total energy than individuals from a household with a head of the household without any education. Individuals in the middle and highest terciles of socioeconomic status (index based on household characteristics and basic goods and services) consumed 4·5% (middle tercile: 95% CI: 2·8, 6·2, highest tercile: 95% CI: 2·5, 6·5) more UPF as a proportion of total energy than individuals in the lowest tercile. Urban residents also consumed 5·6% (95% CI: 4·2, 7·0) more UPF as a proportion of total energy, compared with rural residents(Reference Marrón-Ponce, Sánchez-Pimienta and Louzada54).
The Netherlands
In the Netherlands in 2012–2016, the average UPF intake was 893 g of UPF per 8368 kJ (95% CI: 879, 907), or 61% of total energy intake(Reference Vellinga, van Bakel and Biesbroek55). A younger age, middle education level (versus low or high) and urban residence were associated with higher UPF intake, whereas gender was not significantly associated with UPF intake(Reference Vellinga, van Bakel and Biesbroek55).
Children and adolescents consumed approximately double the amount of UPF as older adults, and approximately 30–50% more than younger and middle-aged adults. For example, 4–8-year-olds consumed 1252 g of UPF per 8368 kJ (95% CI: 1217, 1288), compared with 962 g of UPF per 8368 kJ (95% CI: 921, 1003) in 19–30-year-olds, and 632 g of UPF per 8368 kJ (95% CI: 607, 656) in 71–79-year-olds. Individuals with a middle education level (intermediate vocational or higher secondary education) consumed approximately 8–10% more UPF relatively than individuals with lower (primary, lower vocational or advanced elementary) or higher (higher vocational or university education) education levels, consuming 939 g of UPF per 8368 kJ (95% CI: 916, 962), compared with 871 g (95% CI: 838, 903) in individuals with a low education level, and 850 g (95% CI: 830, 871) in individuals with a high education level. Individuals living in regions with a high degree of urbanisation (≥1500 addresses/km2) consumed 916 g of UPF per 8368 kJ (95% CI: 891, 942), compared with 876 g of UPF per 8368 kJ (95% CI: 856, 896) in individuals living in regions with a low degree of urbanisation (<1000 addresses/km2) and 898 g of UPF per 8368 kJ (95% CI: 868, 928) in individuals living in regions with a moderate degree of urbanisation (1000–1500 addresses/km2)(Reference Vellinga, van Bakel and Biesbroek55).
Portugal
In Portugal in 2015–2016, average UPF intake was 23·8% of total energy, or 257 g (interquartile range: 141, 426) per day(Reference Magalhães, Severo and Correia57). Younger adults consumed more UPF than elderly adults(Reference Miranda, Rauber and Moraes56). Other associations were stratified by male and female gender(Reference Magalhães, Severo and Correia57). In unadjusted models stratified by gender, crude UPF intake was significantly higher with a younger age (highest in adolescents), mid-high education level, in single, divorced or widowed individuals, individuals living in a larger household and living in Lisbon and Azores regions of Portugal(Reference Magalhães, Severo and Correia57). All variables remained significantly associated with UPF intake in adjusted (adjusted for age, education level and non-UPF intake) models, except for household status in both males and females, and marital status in females, which became non-significant. Rurality/urbanisation and food insecurity were not significantly associated with UPF intake in unadjusted or adjusted models(Reference Magalhães, Severo and Correia57).
In the adjusted models, adolescents (aged 10–17) had the highest UPF intake, with female adolescents consuming 192 g (95% CI: 135, 249) more than female older adults, and male adolescents consuming 327 g (95% CI: 277, 377) more than male older adults (aged 45–64). Female and male older adults (aged 45–64) consumed 63 g more (95% CI: 34, 91) and 51 g more (95% CI: 9, 93) than elderly females and males (aged 65–84). The difference in UPF intake across ages was greater in males than females(Reference Magalhães, Severo and Correia57). Females in Alentejo (+50 g (95% CI: 9, 90)) and Algarve regions (+36 g (95% CI: 1, 70)) consumed more UPF than females in North Portugal, and males from Lisbon consumed 76 g (95% CI: 19, 133) more UPF than males in North Portugal. Males and females with the highest level of education (more than 12 years) consumed 68 g (95% CI: 12, 124) and 51 g (95% CI: 16, 86) more UPF/d than males and females with the lowest level of education (6 years or less), respectively, a roughly 20–25% relative increase. However, a lower education level was associated with a higher UPF intake in children. Single, divorced or widowed males consumed 48 g (95% CI: 1, 96) more UPF/d than married males, or males in a couple.
Spain
In Spain, the average intake of UPF significantly increased from 1991 to 2008, accounting for 24·4% (SD: 14·0) of total energy in 1991, 25·6% (SD: 16·3) in 1996, 27·5% (SD: 19·2) in 2004, and 31·1% (SD: 19·0) in 2008(Reference Romero Ferreiro, Cancelas Navia and Lora Pablos58).
In 1991, a younger age was inversely related with higher intakes of UPF (ρ = −0·53, p < 0·0001)(Reference Romero Ferreiro, Martín-Arriscado Arroba and Cancelas Navia59). In 2008–2010, Individuals in the highest (42·8% (SE: 0·2)) versus lowest (8·7% (SE: 0·1)) quartile of UPF intake were more likely to be younger and have a primary level education, compared with individuals in the lowest versus highest quartile of UPF intake, who were more likely to have no formal education and be living alone(Reference Blanco-Rojo, Sandoval-Insausti and López-Garcia60). Gender proportions did not significantly differ across quartiles of UPF intake.
In the adjusted model (adjusted for year of cohort, age, gender, BMI and total energy intake) across 1991 to 2008, a younger age (−0·15% (SE: 0·01) per year of age) and female gender (1·1% (SE: 0·3) greater UPF intake than males) had significantly higher UPF intakes(Reference Romero Ferreiro, Cancelas Navia and Lora Pablos58). UPF intake also varied across regions. In 2008, UPF intake was more than 30% of total energy in all regions, but 5% higher in North Spain (36·0% (SD: 18·3)) than South or Central South Spain (South: 31·3% (SD: 18·3), Central South: 30·2% (SD: 17·1))(Reference Romero Ferreiro, Cancelas Navia and Lora Pablos58).
Switzerland
In Switzerland during 2014–2015, the average UPF intake was 28·7% of total energy (interquartile range (IQR): 19·9, 38·9)(Reference Bertoni Maluf, Bucher Della Torre and Jotterand Chaparro61). In unadjusted associations, a younger age, living in the German-speaking region (versus French- or Italian-speaking regions) and Swiss nationality (versus non-Swiss) were significantly associated with a higher intake of UPF(Reference Bertoni Maluf, Bucher Della Torre and Jotterand Chaparro61). After adjustment for other sociodemographics including income, male gender also became significantly associated with higher UPF intake. Household size and education level were not significant in adjusted or unadjusted models.
Across ages, unadjusted median UPF intakes were 8·5% higher as a proportion of total energy in 18–29-year-olds (34·8% (IQR: 24·5, 45·0), compared with 65–75-year-olds (26·3% (IQR: 17·1, 35·0), p = 0·001). Individuals from German-speaking region (29·6% (IQR: 20·9, 39·6)) also consumed 1·5–2·5% more UPF than other regions (French-speaking: 27·2% (IQR: 17·7, 37·1); Italian-speaking: 28·0% (IQR: 16·9, 39·4), p = 0·002). Swiss nationals consumed relatively approximately 12% more UPF as a proportion of total energy than non-Swiss nationals (29·2% (95% CI: 20·3, 39·0) versus 26·1% (IQR: 17·5, 37·1), p = 0·002)(Reference Bertoni Maluf, Bucher Della Torre and Jotterand Chaparro61).
UK
In the UK, average UPF intake was 51·3% (SD: 13·1) in 2008–2009 (≥19 years)(Reference Lam and Adams62), 53·1% across 2008–2012 (≥18 years)(Reference Adams and White64), 56·8% (SE: 0·2) across 2008–2014 (≥1·5 years)(Reference Rauber, Louzada and Steele65), 54·3% (SE: 0·4) across 2008–2016 (19–96 years)(Reference Rauber, Steele and Louzada66), and 54·0% in 2014–2016 (≥4 years)(Reference Souza, Andrade and Rauber67). From 2008 to 2016, UPF intakes have been relatively consistent, with no significant linear trends in UPF intake across sociodemographic strata(Reference Madruga, Steele and Reynolds63).
In 2008–2009, a younger age was significantly associated with higher intakes of UPF (−0·16% (95% CI: −0·24 to −0·09) per year of age), but gender, occupational social class (routine and manual or intermediate versus managerial and professional) and household status (living with other adults or living with children) were not significantly with higher intakes of UPF in adjusted models (adjusted for the aforementioned sociodemographic variables and food preparation skill/behaviours)(Reference Lam and Adams62). Across 2008–2012, a younger age (−0·18% (95% CI: −0·21, −0·14) per year of age) and male gender (1·38% (95% CI: 0·09, 2·67)), but not occupational social class, were significantly associated with higher intakes of UPF in adjusted models (adjusted for aforementioned variables and percentage of energy intake from alcohol)(Reference Adams and White64). Across 2008–2014, younger ages were significantly associated with higher intakes of UPF, with the highest intakes in 11–18-year-olds (68·0% (SE: 0·4)) then 1·5–10-year olds (63·5 (SE: 0·34)) and lowest in adults (19–64: 54·9% (SE: 0·4)) and the elderly (≥65: 53·0% (SE: 0·52)) (all p < 0·001 with 1·5–10 years as reference)(Reference Rauber, Louzada and Steele65). In 2014–2016, children (65·7% (95% CI: 64·2, 67·1)) and adolescents 67·1% (95% CI: 65·7, 68·5)) consumed greater quantities of UPF than adults (54·0% (95% CI: 53·0, 55·0))(Reference Souza, Andrade and Rauber67). Across 2008–2016, a younger age, male gender, white ethnicity (versus non-white ethnicity), lower occupational social class and living in Northern Ireland were associated with higher intakes of UPF as a proportion of TEI(Reference Rauber, Steele and Louzada66). It was found that 19–29-year-olds (59·2% (SE: 1·3)) consumed approximately 8% more UPF as a proportion of total energy than adults aged 60 or older (51·5% (SE: 0·5)), and 5% more than 30–59-year-olds (54% (SE: 0·4)). Males consumed 3% more UPF as a proportion of energy intake than females (55·9% (SE: 0·6) versus 52·8% (SE: 0·4)). White ethnicity was associated with a 10% higher intake of UPF as a proportion of total energy than other ethnicities (55·4% (SE: 0·4) versus 45·4% (SE: 1·2)). Individuals in routine and manual occupations consumed 57·3% of energy from UPF, compared with 53·4% (SE: 0·8) in intermediate occupations, 53·8% (SE: 0·7) in lower managerial and professional occupations, and 50·3% (SE: 0·7) in higher managerial and professional occupations (p-trend <0·05). Individuals living in Northern Ireland consumed 58·7% of total energy (SE: 0·8) from UPF, compared with 51·7% (SE: 0·6) in individuals living in the South of England (including London), who had the lowest intakes of UPF. Average UPF consumption in North England, Central England/Midlands, Scotland and Wales was approximately 55–57% of total energy(Reference Rauber, Steele and Louzada66).
USA
In the USA, average UPF intake increased from 53·5% (95% CI: 52·5, 54·6) in 2001–2002 to 57% (95% CI: 55·0, 58·9) in 2017–2018(Reference Juul, Parekh and Martinez-Steele69).
In 1988, individuals in the highest (5·2 to <29·8 times/d) versus lowest quartile (0 to <2·6 times/d) of frequency of UPF intake were more likely to be younger, male, non-Hispanic white, and were less likely to be Mexican or other ethnicity, have an education below high school level or have a high income/poverty ratio (≥350% the poverty level)(Reference Kim, Hu and Rebholz68).
Across 2005 to 2018, younger age, non-Hispanic white or Black ethnicity, a lower income/poverty ratio (<350% of the poverty level) were significantly associated with a higher UPF intake, or were more likely to be in the highest quantile of UPF intake(Reference Juul, Martinez-Steele and Parekh70–Reference Martínez Steele, Juul and Neri73,Reference Zheng, Sun and Yu75–Reference Kim, Rebholz and Wong79) . Income was not significant in one study from 2013 to 2014(Reference Kim, Rebholz and Wong79). Hispanics and other ethnicities including non-Hispanic Asians and non-Hispanic Asian Americans had low UPF intakes, or were less likely to be in the highest quantile of UPF intake(Reference Juul, Martinez-Steele and Parekh70–Reference Martínez Steele, Juul and Neri73,Reference Zheng, Sun and Yu75,Reference Martínez Steele, Khandpur and Sun76,Reference Buckley, Kim and Wong78,Reference Kim, Rebholz and Wong79) . Non-Hispanic Asians consumed nearly 20% less unadjusted UPF (39·3% (95% CI: 38·1, 40·5)) than non-Hispanic white (57·7% (95% CI: 56·9, 58·5)) or Black (60·1% (95% CI: 58·8, 61·3)) ethnicities(Reference Pachipala, Shankar and Rezler77). Education was also significantly associated with UPF intake, typically with higher UPF intakes with a mid-low education level(Reference Juul, Parekh and Martinez-Steele69–Reference Baraldi, Martinez Steele and Canella71,Reference Pachipala, Shankar and Rezler77) , or mid-level education(Reference Martínez Steele, Juul and Neri73,Reference Zheng, Sun and Yu75,Reference Martínez Steele, Khandpur and Sun76) . One paper stratifying by ethnicity reported higher UPF intakes were seen in non-Hispanic Asian Americans with higher education levels (lowest versus highest: 32·1% (95% CI: 29·2, 35·1) versus 39·7% (95% CI: 38·3, 41·1)), whereas higher UPF intakes were seen in non-Hispanic white or non-Hispanic other ethnicities at lower education levels (non-Hispanic white lowest versus highest: 61·7% 95% CI: 59·9, 63·5) versus 53·3% (95% CI: 52·2, 54·5); non-Hispanic other lowest versus highest: 62·0% (95% CI: 55·9, 68·0) versus 50·6% (95% CI: 46·7, 54·6)), and higher UPF intakes in non-Hispanic Blacks at mid-low education levels(Reference Pachipala, Shankar and Rezler77). Similarly a higher income/poverty ratio, was associated with a higher UPF intake in non-Hispanic Asian Americans (lowest versus highest: 35·0% (95% CI: 31·9, 38·1) versus 40·8% (95% CI: 39·2, 42·4)), but associated with a lower UPF intake in non-Hispanic whites (lowest versus highest: 61·1% (95% CI: 59·7, 62·4) versus 55·8% (95% CI: 54·8, 56·8))(Reference Pachipala, Shankar and Rezler77).
Across 2011–2016, USA-born individuals consumed over 12% more UPF as a proportion of total energy (adjusted for age, gender, family income/poverty ratio, education level and race/ethnicity) than foreign-born individuals (USA-born: 57·9% (95% CI: 57·3, 58·5) versus foreign-born: 45·4% (95% CI: 44·0, 46·8))(Reference Martínez Steele, Khandpur and Sun76). This difference was seen across all sociodemographics (age, gender, income/poverty ratio, education level, ethnicity). Differences between USA- and foreign-born UPF intakes were smaller at the highest income/poverty ratio and education levels (approximately a 10% difference compared with approximately a 15% difference at low and middle income/education levels), where UPF intake in foreign-born individuals tended to be higher at a higher income/poverty ratio or education level compared with lower levels, whereas UPF intake in USA-born individuals tended to be lower at a higher income/poverty ratio or education level compared with lower levels (p-interaction 0·001). USA-born non-Hispanic Blacks also consumed 50% more relative UPF as a proportion of total energy than foreign-born non-Hispanic Blacks (60·7% (95% CI: 59·7, 61·8) versus 40·4% (95% CI: 37·0, 43·8), p < 0·001)(Reference Martínez Steele, Khandpur and Sun76).
With marital status, unmarried, single or widowed individuals were more likely to be in the highest quartile of UPF intake, compared with being married or living with a partner(Reference Juul, Martinez-Steele and Parekh70,Reference Zheng, Sun and Yu75) . Across ethnicities, the association was present within non-Hispanic Asian American, non-Hispanic Black and Hispanic ethnicities, but not in non-Hispanic white or other ethnicities(Reference Pachipala, Shankar and Rezler77).
Gender was not significantly associated with UPF intake in most studies(Reference Baraldi, Martinez Steele and Canella71–Reference Yang, Zhang and Steele74,Reference Martínez Steele, Khandpur and Sun76–Reference Kim, Rebholz and Wong79) ; but across 2005–2014, females were more likely to be in the highest quantile of UPF intake(Reference Juul, Martinez-Steele and Parekh70,Reference Zheng, Sun and Yu75) , and across 2011–2016, gender proportions across quartiles of UPF intake significantly differed, with no clear relationship(Reference Zheng, Sun and Yu75).
Adjusted mean intakes (adjusted for age, gender, education, family income/poverty ratio and race/ethnicity) from 2007 to 2012 show that younger ages (2–9- and 10–19-year-olds) consumed two-thirds of total energy from UPF (2–9: 65·9% (95% CI: 65·0, 66·8), 10–19: 66·8% (95% CI: 65·9, 67·7)), 13–14% more than adults aged 60 or older (52·8% (95% CI: 51·9, 53·7)). It was found that 20–39-year-olds also consumed nearly 60% of total energy from UPFs (59·5% (95% CI: 58·7, 60·3)), and 40–59-year-olds over 55% (55·2% (95% CI: 54·1, 56·4))(Reference Baraldi, Martinez Steele and Canella71). Non-Hispanic white (60·2% (95% CI: 59·4, 60·9)) and Black ethnicities (60·6% (95% CI: 59·7, 61·5)) had the highest adjusted UPF intakes, 5% more than Mexican-Americans (54·8% (95% CI: 53·2, 56·3)) and 8% more than other Hispanics (52·0% (95% CI: 50·3, 53·7)), with all other races having the lowest UPF intake (49·6% (95% CI: 47·3, 51·8)), more than 10% lower than non-Hispanic white or Black ethnicities. Individuals with a college level education or higher (55·9% (95% CI: 54·6, 57·2)) consumed nearly 4% less UPF as a proportion of total energy than individuals with a high school education (59·7% (95% CI: 59·1, 60·3)) or individuals with less than a high school education (59·5% (95% CI: 58·4, 60·6))(Reference Baraldi, Martinez Steele and Canella71). Across the lowest to highest levels of family income/poverty ratios, there was a 2% difference in UPF intake as a proportion of total energy (≤1·30: 59·6% (95% CI: 58·6, 60·7) versus >3·5: 57·7% (95% CI: 56·9, 58·6)).
From 2001 to 2018, adjusted trends in UPF intake (adjusted for age, gender, race/ethnicity, education level and income/poverty ratio) showed that males (+4·3%) and females (+2·7%) increased their UPF intake over time, to 57·2% (95% CI: 55·2, 59·1) in males and 56·8 % (95% CI: 54·6, 59·1) females in 2017–2018 (p-trend 0·001 and 0·002, respectively)(Reference Juul, Parekh and Martinez-Steele69). UPF intake increased across all ages (aged 19 or older). Older adults (60 or older) had the lowest UPF intake in 2001–2002 (51·7% (95% CI: 49·4, 54·0)), but the highest in 2017–2018 (57·4% (95% CI: 54·3, 60·4)). UPF intake increased in non-Hispanic Black or white individuals (p-trend 0·001), but not Hispanics (p-trend 0·081). Hispanics consistently consumed approximately 5% less UPF than non-Hispanic Black or white individuals. Adults of all income levels increased their UPF intake from 2001 to 2018 (p-trends all <0·05), and UPF intake increased across all education levels (p-trends all <0·05), with the lowest intake in college graduates across time, about 5% lower than adults with lower education levels(Reference Juul, Parekh and Martinez-Steele69).
Multinational
Across twenty-two European countries (Austria, Belgium, Croatia, Cyprus, Czech Republic, Denmark, Estonia, Finland, France, Germany, Greece, Hungary, Ireland, Italy, Latvia, Portugal, Romania, Slovenia, Spain, Sweden, the Netherlands and the UK), gender was not significantly associated with UPF intake when expressed as a proportion of total energy, except for in Portugal (p < 0·01), where females had higher intakes than males (24·5% versus 19·8%). UPF intakes typically varied by 1–4% between genders within each country.
Associations by sociodemographic predictor
Sociodemographic associations with UPF intake by country are presented in Table 3.
Country-level summary associations between each sociodemographic predictor and UPF intake

Age
Age was assessed across seventeen countries. There was a consistent association of a younger age (in adults, or in adults and children) having higher UPF intakes in all countries, with some studies showing the highest intakes in adolescents. Differences in absolute UPF intake across ages were large, typically between 5% and 20% as a proportion of total energy, reflecting 15–100% relative differences in UPF intake. Two studies in the USA(Reference Juul, Parekh and Martinez-Steele69), and Belgium(Reference Vandevijvere, De Ridder and Fiolet33), also reported relatively high UPF intakes in the elderly or in older adults.
Gender
Gender was assessed across thirty-two countries. Most of the national differences in UPF intake between genders were not significant, or varied in significance across studies within the same country (eight countries). Where significant differences were seen in Australia, Korea, Canada, Switzerland and the UK, males consumed approximately 1–4% more as a proportion of total energy. In Brazil, Colombia, Italy, Portugal and Spain, females consumed approximately 1–3% more UPF as a proportion of total energy.
Race/ethnicity
Three countries assessed race/ethnicity (Brazil, the UK and the USA). Significant and large differences in UPF intake were seen across race/ethnicities, with 10–20% absolute differences in UPF intake as a proportion of total energy in the UK and the USA, corresponding to 20–50% relative differences in UPF intake. In Brazil, the lowest quintile (≤13% of total energy) of UPF intake constituted 34% white and 64% African-descendent, compared with 57% white and 41% African-descendent in the highest quintile (≥44% of total energy)(Reference Louzada, Baraldi and Steele82).
Income
Income was assessed in six countries (Australia, Brazil, Canada, Chile, Korea and the USA). Five countries reported significant associations between income and UPF intake.
A higher income was associated with a higher UPF intake in Chile and Brazil, with 10–15% absolute differences in UPF consumption as a proportion of total energy across the highest and lowest income levels in Brazil, and over 4% absolute differences in Chile, reflecting a 15–100% relative increase in UPF intake with higher income.
In Australia, the second, third and fourth income quintiles had 2–3% higher adjusted absolute intakes of UPF as a proportion of total energy, compared with the lowest quintile(Reference Marchese, Livingstone and Woods31). In the USA, there was a 2% difference in adjusted UPF absolute intake as a proportion of total energy across income:poverty levels, increasing with lower income:poverty levels(Reference Baraldi, Martinez Steele and Canella71). The association between income and UPF intake in the USA differed on the basis of ethnicity. In Korea, there was a 4–5% crude difference in UPF intake between low and mid-to-high incomes across 2010–2018, but adjusted mean intakes were non-significantly different(Reference Shim, Shim and Cha50). In Canada, income levels significantly differed across terciles of UPF intake in 2015, but no difference was seen in 2004.
Education level
Education level was assessed in fifteen countries, with no assessment in individual studies from Colombia or the UK. There was a significant association between education level and UPF intake in 10 countries, with no significant association in Barbados, Belgium, Chile, Italy or Switzerland.
A lower education level was associated with a higher UPF intake in Australia (adjusted: 2·3% absolute difference, 6% relative difference) and Canada (adjusted: 1·8% absolute difference, 4% relative difference), and in the USA after 2001. Some US studies showed higher UPF intakes with mid-low versus high education levels (adjusted: 4% absolute difference, 7% relative difference)(Reference Baraldi, Martinez Steele and Canella71), or middle education levels(Reference Martínez Steele, Juul and Neri73,Reference Martínez Steele, Khandpur and Sun76) . The association between education level and UPF intake in the USA also differed on the basis of ethnicity.
In the Netherlands, a middle education level (intermediate vocational education, higher secondary education) was associated with about an 8–10% greater relative UPF intake than lower or higher education levels (in grams of UPF per 8368 kJ). In France, a mid-high education level had the highest UPF intakes in 2006–2007, with the lowest intakes in the lowest education level (6% absolute difference, 20% relative difference). By 2014–2015, middle education levels were more likely, and low education levels less likely, to be in the highest UPF intake quartile in France. Similarly, in Spain, low education levels (no formal education) were less likely to be in the highest quartile of UPF intake, and mid-level (primary) education were more likely be in the highest quartile of UPF intake, with similar proportions of individuals with a high education level (secondary or higher education) across quartiles of UPF intake(Reference Blanco-Rojo, Sandoval-Insausti and López-Garcia60).
A higher education level was associated with a higher UPF intake In Brazil (across quartiles), Korea (adjusted: 2–3% absolute difference, 10% relative difference), Mexico (adjusted: 7·8% absolute difference, 25% relative difference) and Portugal (adjusted: 20–25% relative difference in grams), ranging from 2% to 8% higher as an adjusted proportion of total energy from UPF.
Socioeconomic status
Socioeconomic status, assessed via indices of occupation, social class or deprivation, was assessed in six countries, with significant but varying associations with UPF intake in all six countries.
A higher socioeconomic status was associated with higher UPF intake in Colombia (adjusted: 10% absolute, 80% relative) and Mexico (adjusted: 4·5% absolute, 15% relative).
A lower compared with higher socioeconomic status was associated with a higher UPF intake in Australia (adjusted: 2·5% absolute difference) and in the UK across 2008–2016 (based on occupational social class; 7% absolute difference, 14% relative difference)(Reference Rauber, Steele and Louzada66), but not in 2008–2009(Reference Lam and Adams62), or across 2008–2012(Reference Adams and White64).
Based on occupation in Italy and France, retired individuals had the lowest UPF intakes (Italy adjusted: 1·9% lower absolute intake than manual occupations, 10% lower relative intake; France in 2006: 6–13% lower absolute intake, 20–40% lower relative intake), with broadly similar intakes or higher proportions in the highest terciles of UPF intake in manual occupations, non-manual occupations, unemployed individuals or students (proportions of professional executives were similar across terciles of UPF intake in France in 2014–2015).
Food insecurity
Food insecurity was assessed in three countries (Canada, France and Portugal). Higher levels of food insecurity were associated with a higher UPF intake in Canada (10% absolute difference, 20–25% relative increase in UPF across age–gender groups) and more likely to be in the highest tercile of UPF intake in France. Food insecurity was not significantly associated with UPF intake in Portugal.
Marital status
Marital status was assessed in five countries, with significant differences reported in four countries (France, Italy, the USA and in Portuguese males), and tended to find unmarried, single, separated or divorced individuals had higher UPF intakes, or were more likely to be in the highest quantiles of UPF intake, compared with married individuals or individuals living together. Marital status was not significant in Korea, after adjustment for other sociodemographic factors, or in Portuguese females.
Household status
The number of individuals in the household was assessed in five countries, with a significant association with UPF intake in one country. In Spain, people living alone were less likely to be in the highest quartile of UPF intake, but household status was not significant in Switzerland, the UK, Korea or Portugal after adjustment for other sociodemographic factors or health behaviours.
Rural/urbanisation
The level of urbanisation was assessed in eleven countries, with higher UPF intakes typically being reported in more urban than rural residences in eight countries: Brazil (10% absolute difference, 80% relative difference), Colombia (6% absolute difference, 50% relative difference), Chile (6% absolute difference, 25% relative difference), France (3% absolute difference, 10% relative difference), Italy (1·6% absolute difference, 10% relative difference), Korea in 2010–2018 (0·8% absolute difference, 3% relative difference), Mexico (5·6% absolute difference, about 20% relative difference) and the Netherlands (5% relative difference). Urbanisation was not significant in Korea during 2016–2018, after adjustment for other sociodemographic factors and health behaviours.
Individuals from rural residences were more likely to be in the highest tercile of UPF intake in Canada in 2015, but there was no significant association in 2004 after adjustment for other sociodemographic factors and health behaviours. Living in inner regional Australia was crudely associated with a higher UPF intake, and living in a major city associated with a lower intake, but did not remain significant after adjustment for other sociodemographic factors. Urbanisation was also not significantly associated with UPF intake in Portugal.
Region of country
Region of country was assessed in eleven countries, with ten countries demonstrating regional differences in UPF intake, typically varying by 5–10% as a proportion of total energy, or a 25–75% relative difference in UPF intake: Belgium (adjusted: 6–8% absolute difference, 20–25% relative difference), Brazil (10% absolute difference, 75% relative difference), Chile (adjusted: 4% absolute difference, 13% relative difference), Colombia (adjusted: 9% absolute difference, 70% relative difference), Italy (adjusted: 0·1% absolute difference, 9% relative difference), Mexico (adjusted: 8% absolute difference, 33% relative difference), Portugal (20% relative difference in grams), Spain (in 2008: 5% absolute difference, 20% relative difference), Switzerland (2·4% absolute difference, 8% relative difference) and the UK (7% absolute difference, 14% relative difference). There was no significant difference in UPF intake across regions of France.
Immigrant status/country of birth
Immigrant status or country of birth was assessed in four countries. Home-born versus foreign-born individuals in the USA (adjusted: 12% absolute difference, 28% relative difference), home-born and English-speaking country born individuals versus other individuals in Australia (6–9% absolute difference, 20–30% relative difference), Swiss nationals versus non-Swiss nationals in Switzerland (3% absolute difference, 12% relative difference) and non-immigrants versus immigrants in Canada (11% absolute difference, 30% relative difference), had approximately 3–13% higher absolute intakes of UPF as a proportion of total energy, or a 10–30% higher relative UPF intake.
Indigenous identity
Indigenous identity was assessed in Canada only. Individuals with Indigenous identity were more likely to be in the highest tercile of UPF intake(Reference Nardocci, Polsky and Moubarac44).
Associations by country-level income and adjusted analyses
When considering upper-middle income countries (Brazil, Colombia and Mexico), a higher socioeconomic score was associated with higher UPF intake in Colombia and Mexico, a higher income with higher UPF intake in Brazil, higher education level with higher UPF intake in Brazil and Colombia, and a higher UPF intake in all three countries in a more urban residence.
When considering multivariate adjusted associations only, nineteen studies across thirteen countries reported sociodemographic associations adjusted for other sociodemographic characteristics and health behaviours. The majority of the significant crude associations between sociodemographic variables and UPF intake remained significant with adjustment for other variables. Further details are provided in the supplementary materials.
Assessment of methodological quality
Risk of bias scores for each study are presented in Table 1. Most studies scored a 5 or 7 out of 10 (average: 5·7/10), depending on whether adjustment was made for one or more sociodemographic variables. Risk of bias scores were higher (indicating a lower risk of bias) for studies performing adjustment for other sociodemographic factors.
Discussion
This systematic review included fifty-five nationally representative studies, spanning thirty-two countries and three decades of dietary intake. Average UPF intake varied greatly across countries, from 14% to 16% of total energy intake in Italy, Romania and Colombia, to 61% in the Netherlands. Intakes also varied greatly within countries, with several sociodemographic factors being independently associated with UPF intake.
Age (being highest in either younger adults, or adolescents and children) demonstrated a consistent inverse association with UPF intake, with a large magnitude difference in UPF intake with age. Other sociodemographic characteristics associated with large magnitude differences in UPF intake across strata included race/ethnicity, income, country of birth, region of the country, rural/urban living and food insecurity. Despite only a few studies reporting on race/ethnicity, ethnic differences in UPF intake were large, with 10–20% absolute differences as a proportion of total energy. Similar magnitude differences were seen in the small number of countries reporting UPF intake based on country of birth or food insecurity, except no difference in UPF intake seen in Portugal across levels of food insecurity.
Living in an urban residence and being unmarried, single, separated or divorced were typically associated with a higher UPF intake, whereas education level, income and socioeconomic status showed varying directions of association with UPF intake, depending on country. Gender was generally not significantly associated with UPF intake in most countries, and neither was the number of individuals in the household. At least one multivariate adjusted association was reported in thirteen countries, showing largely unchanged estimates from the crude associations. These findings indicate that the significant and large differences in UPF intake across levels of sociodemographic variables are independent of other sociodemographic variables.
The results from this systematic review confirm and contrast with the findings from previous reviews. Similar to the results in this systematic review, a systematic review that included non-nationally representative samples suggested minimal differences in UPF intake with gender, but with higher intakes in younger ages(Reference Marino, Puppo and Del Bo’15). One review suggested links between a younger age, urban residence, male gender, lower education level, lower household income and food insecurity with higher UPF intake(Reference Zhang and Giovannucci13). Another review suggested links between age, gender, education and income with UPF intake, and also a varying association of socioeconomic status depending on country-level income(Reference Crimarco, Landry and Gardner14). This review also identified urban living as an important predictor of greater UPF intake, which is also in line with the findings from global UPF sales and household purchases(Reference Popkin and Ng3,Reference Baker, Machado and Santos5) . However, male gender was not consistently associated with higher UPF intakes, and the association between education level and UPF intake varied across countries. Indeed, in upper middle-income countries (UMIC), higher education levels, incomes and socioeconomic status tended to have higher UPF intakes, but the association between education level and UPF intake across HICs varied. In the USA, differences in UPF intake across levels of education and income also showed contrasting associations across ethnic groups, and in Portugal, the association between education level and UPF intake differed on the basis of age. These findings indicate the need for more detailed assessments in other countries to tease apart the sociodemographic inter-relationships with UPF intake. Race/ethnicity, region of the country and country of birth were all significant predictors of UPF intake in this systematic review but had largely been unconsidered in previous reviews. Given the lack of studies assessing the association between food insecurity and UPF intake, and the large differences in food insecurity across ethnic groups(Reference Odoms-Young83), these highlight important and understudied sociodemographic associations for the consumption of UPF intake.
Meta-analyses demonstrate significantly increased risks of poor health with each 10% increment in UPF intake as a proportion of total energy in the diet, including a 15% increased risk of all-cause mortality(Reference Suksatan, Moradi and Naeini84), 7% higher risk of overweight, 6% higher risk of obesity, 5% higher risk of abdominal obesity(Reference Moradi, Entezari and Mohammadi85) and 15% higher risk of type 2 diabetes(Reference Moradi, Hojjati Kermani and Bagheri86). Meta analyses comparing the highest versus lowest quantiles of UPF intake from prospective cohort studies also show a 25% higher risk of all-cause mortality, 29% higher risk of cardiovascular disease incidence and mortality, 11% higher risk of overweight or obesity, 20% higher risk of depression(Reference Pagliai, Dinu and Madarena9) and 23% higher risk of hypertension(Reference Wang, Du and Huang87). The magnitude of the absolute differences in UPF within several sociodemographic variables reported in this systematic review were typically in the range of 5–20% of total energy intake (e.g. across age, race/ethnicity, income, country of birth and region of the country) and independent of other sociodemographic variables. These independent differences in UPF intake correspond with the differences in UPF exposure that are associated with significantly increased risks of non-communicable disease reported in meta-analyses. The findings from this systematic review highlight existing health inequalities across sociodemographic subgroups associated with increased UPF intake, and future sociodemographic differences in non-communicable disease incidence. Furthermore, by considering each of the independent sociodemographic associations produces striking differences in mean UPF intake across specific sociodemographic populations. For example, in Mexico, the average male adult, living in a rural residence in the south of the country, with a low socioeconomic status and from a household with no head of household education consumes 39·3% less UPF as a proportion of total energy than the average female pre-school child, living in an urban residence in North Mexico with a medium-high socioeconomic status and from a household with a head of the household with a college graduate education (25·2% versus 64·5%)(Reference Marrón-Ponce, Sánchez-Pimienta and Louzada54). Given the growing epidemics of obesity and cardiometabolic disease, these results present an alarming picture regarding the incidence of future adiposity-related cardiometabolic disease.
Notably, no studies included in this review were from Africa or Asia, accounting for over half of the global population. Non-nationally representative samples from Asian countries also demonstrate sociodemographic associations with UPF intake, supplementing the global picture of national UPF intake patterns. With almost a fifth of the global population, results from the China Health and Nutrition Survey across 1997–2009 (CHNS; 12 451 adults sampled using a random, complex multistage methodology across nine of thirty-one Chinese provinces, but not considered to be nationally representative(Reference Popkin, Du and Zhai88)) showed that the highest UPF consumers (≥50 g UPF/d) versus non-consumers versus (0 g/d) were more likely to be male, have a higher income, have a higher education level and live in an urban residence(Reference Li and Shi22), similar to the UMICs in this review. Age was not significantly associated with UPF intake. However, another CNHS study reported similar findings, except age was positively associated with UPF intake, in contrast to the findings here(Reference Li and Shi89). Other Asian samples report differences in UPF intake with a younger age, higher education level and race/ethnicity, with variable gender associations. In Jakarta, Indonesia, a younger age was associated with increased UPF intake(Reference Setyowati, Andarwulan and Giriwono90), and in a multicentric study from Iran, being under 40 (versus 40 or older) and having a higher level of education were associated with higher intakes of UPF, but there was no difference in UPF intake with gender(Reference Haghighatdoost, Hajihashemi and Mohammadifard91). In middle-aged Japanese adults, people who were never married, living alone, in regular full-time work and with a lower income had higher UPF intakes, but no difference was seen with age, gender or number of children(Reference Koiwai, Takemi and Hayashi92). In the Singaporean multi-ethnic cohort study, the highest versus lowest quartiles of UPF intake (85·9% versus 51·8% of total energy) were more likely to be younger, male and of Malay or other ethnicity, and less likely to be of Indian or Chinese ethnicity(Reference Teo, Tso and van Dam23). In the Taiwan, a higher UPF intake was seen with a younger age and a higher education level, but gender was not significant(Reference Huang, Huang and Lo24). Improving the understanding the sociodemographic patterns of individual-level UPF intake in African and Asian nations represents a key research focus for understanding the global implications of UPF consumption.
Strengths and limitations
This review builds upon previous reviews by systematically reporting sociodemographic predictors of individual-level UPF intake from nationally representative samples, reducing biases resulting from convenience sampling, increasing the generalisability of results to each nation. The use of food consumption surveys strengthens the confidence in assessing individual-level UPF intake, compared with household purchase data. This review reported all sociodemographic predictors from included studies, including those which were not associated with UPF intake, and provided absolute and relative quantitative estimates of differences in UPF intake across sociodemographic strata. Multivariate analyses were conducted in several countries in this review, allowing for the identification of independent sociodemographic associations, separate to other sociodemographic characteristics and health behaviours.
However, some limitations must be considered. First, the lack of complete reporting of all sociodemographic predictors precludes determining the most important sociodemographic determinants of UPF intake. Within each country, most studies considered age and gender, but other sociodemographic predictors were not consistently reported across all studies, and multivariate adjustments in assessing associations were not performed in all countries. In addition, different metrics and stratifications were used across papers to report the same sociodemographic factor (e.g. different methods of assessing socioeconomic status), limiting comparability. Other sociodemographic influences were also not considered, such as work shift pattern. Second, the use of food consumption surveys was a criterion for inclusion, but are time intensive and costly. Combined with the requirement for nationally representative sampling methodology, the inclusion criteria biased towards including higher-income countries with the resources to conduct such studies. This means that many countries were not included in this review, particularly those from middle- and low-income countries. Third, UPF intake was self-reported, as was the assessment of sociodemographic variables, which may have introduced recall bias or bias from misreporting. The dietary assessment method used to assess UPF intake is an important factor. Accurate classification requires extensive details on a food item, which is typically more than what is provided in an FFQ. FFQs also do not allow for the ability to categorise similar foods into different NOVA groups (for example, a single item in the FFQ for all breads or lasagne). Multiple-day, 24-h recalls or food diaries have greater potential to identify UPFs and estimate habitual UPF intake from detailed, open-ended, questions, connected to a database of several thousand food items. All but one study in this analysis used 24-h recalls or food diaries with an extensive food database coded into NOVA to estimate UPF intake, and most assessed intakes over multiple days. Only one cohort assessed UPF intake with a standalone FFQ. This reduced the risk of misclassification that may occur with less detailed FFQs. However, misclassification is still possible, and the classification of specific foods into NOVA processing groups may vary across studies from coding error. Some studies used a single 24-h recall, which, whilst providing more granular detail than an FFQ, may not accurately reflect habitual intake. Fourth, despite the NOVA classification being used extensively in research and implemented in national dietary guidelines or health organisation recommendations, there is still disagreement regarding the utility and validity of measuring UPF intake using the NOVA classification. Fifth, bias may have been introduced through excluding participants with missing data for complete case analyses in the adjusted models, or in reports of unadjusted cohort characteristics, depending on the specific outcome of interest in the study. However, agreement amongst samples was high, and the consistency within each country indicates that the impact of exclusion bias across samples was minimal. Most studies did not compare the characteristics of excluded and included samples, resulting in lower risk of bias scores, making it unclear as to the extent of this bias. Adjustment in multivariate models for confounding factors can allow for the determination of independent associations, but not all studies considered all potential sociodemographic factors in multivariate models. Furthermore, some studies also adjusted for non-sociodemographic factors, such as health behaviours, diet quality or BMI, which may bias the estimates for sociodemographic variables. Fifth, the methodological rigour required to meet the inclusion criteria of this systematic review increased the certainty of the evidence examining the relationship between sociodemographic factors and individual-level UPF intake during specific times or across time in nationally representative samples. However, it is not possible to ascertain the extent to which differences within surveys that span different time periods are due to bias, changes in measurement methodology, different analytical approaches, or from genuine changes in UPF intake. Finally, the narrative synthesis limits the ability to determine overall associations within countries and across sociodemographic variables. It was not possible to synthesise papers quantitatively, due to differences in the reporting of sociodemographic associations (e.g. reporting mean UPF intakes or associations across quantiles of UPF intake), and whether papers analysed a single cross-sectional sample, repeated cross-sectional samples or trends over time.
Implications and further research
The systematic assessment of sociodemographic determinants of UPF intake in this review indicates that UPF intake is unevenly distributed within nations, varying on the basis of previously identified factors such as age and income, but also with previously unconsidered factors such as race/ethnicity or by region of each country. Furthermore, sociodemographic predictors such as gender appear to be less important than previously suggested, and others, such as education or income, are more nuanced than previously suggested. The results here have implications for health policy and research, indicating that certain groups may obtain greater benefit from policy action and targeted/directed interventions. Importantly, the associations between UPF intake and sociodemographic factors are likely to be a reflection of social injustice, and the adverse associations linked with UPF a result of such inequalities. These findings indicate a need to consider social, cultural and geographical influences on UPF intake, and how barriers to reducing UPF intake and accessing MPF may vary across sociodemographic populations within each country. Whether a given food may be considered as UPF can vary across countries, depending on the typical processing method. For example, breads are typically considered as processed food in Australia, but as UPF in the UK. Such cultural differences need to be taken into account when considering public health interventions regarding UPF intake. Still little is known about the actual consumption of UPF within many populations(Reference Walls, Johnston and Mazalale93). There is a need for more nationally representative samples assessing individual-level dietary intake that perform multivariate adjustments of a wider range of sociodemographic predictors of UPF intake, particularly in middle- and low-income countries, and in Africa and Asia.
Conclusion
Average UPF intake varies greatly across countries, but within each country, a number of sociodemographic variables are independently associated with UPF intake, including age, race/ethnicity, marital status, education level, income, rural/urbanisation and region of the country. These are likely a reflection of social injustice. Gender and household status were largely not significantly associated with UPF intake. The magnitude of the differences in UPF intake across sociodemographic levels are comparable to the magnitudes associated with increased risks of obesity, cardiometabolic disease and all-cause mortality, highlighting the importance of policy action and interventions to minimise the health inequalities relating to social injustice.
Supplementary material
For supplementary material accompanying this paper visit https://doi.org/10.1017/S0954422423000240
Data availability
Further details on the review process and materials are in the supplementary materials. Additional details can be made available upon request.
Funding
S.J.D. is funded by a Medical Research Council grant (MR/N013867/1). S.Q. is funded by the National Institute for Health Research and Sir Jules Thorn Charitable Trust. R.L.B. is funded by the National Institute for Health Research, Sir Jules Thorn Charitable Trust and Rosetrees Trust.
Competing interests
The authors declare no competing interests.
Author contributions
S.J.D.: conceptualisation, search, screening, data extraction, data/scientific analysis, first draft of manuscript; S.Q.: screening, data extraction, manuscript review; R.L.B.: supervision, manuscript review


 Open access