

The concentration of top British incomes has attracted considerable scholarly interest since the start of the twentieth century. However, despite substantial recent research, the data sources for the pre-1914 era are essentially those familiar to pioneer investigators such as Bowley (Reference Bowley1914, Reference Bowley1920, Reference Bowley1937) and Stamp (Reference Stamp1914, Reference Stamp1920). This study is based on an extensive survey of Inland Revenue (hereafter IR) files at The National Archives, Kew. We present an unpublished official survey of the distribution of personal incomes above £160 for 1911, plus data that provide more detailed disaggregation for top incomes in 1937. The principal difference in our rediscovered official 1911 estimation, compared to previous estimates, is a substantial increase in numbers, and income shares, for those on above £5,000 per annum (37 percent more tax units, with 42 percent more income), together with a small proportional reduction in numbers and incomes in the £160–£5,000 range.
The 1911 estimation is also important as the only pre-1937 British estimate of the contributions of earned and capital income to total top incomes. We are thus able to examine the relative importance of earned and unearned incomes to the substantial fall in top income shares in Britain during the first half of the twentieth century and compare these trends with other western nations (Atkinson, Piketty, and Saez Reference Atkinson, Piketty and Saez2011; Piketty Reference Piketty2003; Piketty and Saez Reference Piketty and Saez2003, Reference Piketty and Saez2006, Reference Piketty and Saez2013) using a pre-1914 starting point.
We focus on changes in the incomes of the top 0.001 to 5 percent of the British income distribution. Top incomes are important because income redistributions in western countries are typically dominated by changes in the shares of this group, especially within the top percentile (Piketty and Saez Reference Piketty and Saez2006, pp. 201–202). Changes in top income shares have also been identified as key potential drivers of income inequality reduction in Britain during the first half of the twentieth century, given the very limited changes in inequality among wage/salary-earners (Lindert Reference Lindert, Anthony B. and Bourguignon2000, p. 169; Gazeley et al. Reference Gazeley and Reynolds2017; Townsend Reference Townsend1979, p. 139; Routh Reference Routh1965, pp. 51–108). Examining top incomes is thus crucial to explaining the apparent paradox between a relatively stagnant income distribution among the bulk of the British population and the generally-assumed trend towards a more equal pre-tax income distribution (Lindert Reference Lindert, Anthony B. and Bourguignon2000, p. 169).
We first focus in detail on the 1911 income distribution estimate and its methodology—as this data was not published, appears to have been confidential, and (to the best of our knowledge) has not been identified in previous studies. We then compare income shares using the 1900–1950 benchmark years for which British income estimates are available (1911, 1918, 1919, 1937, and 1949). The 1911, 1937, and 1949 distributions (the only ones in this period that disaggregated personal income between “earned” and “unearned” components) are used to examine the contribution of falling capital income—that dominated the declining income shares of the rich—to the overall decrease in income inequality. Finally, we explore the factors behind the fall in top capital incomes. Our findings are in line with other recent studies, that the redistribution was driven primarily by shocks, policy responses, and non-market mechanisms, rather than technological change. We also find that declining capital and land factor incomes directly benefited lower-income groups (e.g., through lowering house prices and rents).
A REDISCOVERED SET OF ESTIMATES
The long-term decline in British inequality is often dated from just prior to WWI (with a possible slight decline from 1867–1911) (Lindert Reference Lindert, Anthony B. and Bourguignon2000, pp. 174–85). However, there are no published official classifications of the taxable income distribution before 1918. Nineteenth-century British tax statistics only showed incomes collected under different “Schedules” (real property, salaries, and wages, etc.),Footnote 1 which could not be consolidated for particular individuals or total income classes. Tax system reforms by the 1906 and 1910 liberal governments introduced super-tax for higher taxable incomes (originally more than £5,000), together with differentiated and graduated taxation (Daunton Reference Daunton2001, pp. 361, 367). Tabulations of total gross taxable incomes were produced from 1908, together with information on the amount of tax levied at different tax rates and abatements, which enabled rough calculations regarding incomes between £160 (the tax threshold) and £700 (beyond which abatements were not available). Meanwhile the introduction of “super-tax” (renamed “surtax” in 1929) on incomes of more than £5,000, provided information on very top incomes—although this was not adjusted to a gross taxable income basis.Footnote 2
The 1920 Finance Act made income distribution estimates using IR tax data impracticable, with the exception of the super-tax brackets.Footnote 3 Moreover, both the super-tax data and the 1908–1919 data for incomes at the lower end of the income tax spectrum, based on graduated income tax and abatements, have been regarded as potentially problematic. As Lydall (Reference Lydall1959, p. 1) noted, “The estimates of national income and its composition from these sources were inevitably a patch-work, the seams of which are only too obvious…” Income tax data relate to tax years, starting in April. However, given lags between the receipt and reporting of incomes for tax purposes, almost all the income recorded was for the calendar year when the tax year began or, for some kinds of income (such as Schedule D), even earlier. We therefore followed established practice in referring to income tax data as covering the year in which the tax year of assessment began (Atkinson Reference Atkinson, Anthony and Piketty2007, pp. 128–34).
IR personal income estimates typically show taxable income—net of any charges on that income (such as loan interest or ground rent). This excludes depreciation; part of government transfers; the investment income of life assurance and superannuation funds, plus not for profit bodies; employers’ and most employees’ contributions to national insurance and private pensions (although income from all retirement pensions are included); most income in kind; part of the imputed rent of owner-occupied houses; and interest on National Savings Certificates (Lydall Reference Lydall1959, pp. 28–29; UK, Inland Revenue 1946, pp. 28–29).
Britain’s first official attempt to derive an income distribution from the income tax, super-tax, and other relevant tax data, was an unpublished IR exercise for 1911, for use, “in making confidential estimates, especially in connection with any legislation… Estimates affecting particular ranges of income can only be satisfactory when it is possible to see how they fit in with all other incomes dealt with.”Footnote 4 Unlike later official estimates, the 1911 estimation was kept confidential. The reasons for this are not discussed in the surviving records, but probably reflected the extreme political sensitivity of Britain’s high concentration of income and wealth, in the wake of the new land taxes introduced in Lloyd George’s 1909 “People’s Budget” and the political storm and constitutional crisis this created (Offer Reference Offer1981, pp. 317–400).
The 1911 estimate covered people above the income tax threshold (£160 per annum) throughout the United Kingdom, including Ireland (and cannot be adjusted to exclude Ireland, as geographically disaggregated data are not available). The estimation was based on the income tax and super-tax returns (and, for unearned income, estate duty, settlement estate duty, and probate data) with a series of adjustments for estimated incomes that fell outside the tax data. Total taxable income comprised £322,531,000 of earned income and £543,923,000 of unearned income—from which was deducted an estimated £1,000,000 of unearned income for people below the tax threshold, plus £65,454,000 of “impersonal income” for companies and similar bodies. Total personal incomes of more than £160 thus amounted to approximately £866,454,000 minus £66,454,000, that is, £800,000,000.Footnote 5 The IR regarded their income estimates between £160 and £700 to be “based on sufficiently accurate income tax figures to be beyond question,” as they were calculated using income tax liabilities net of tax abatements.Footnote 6 However, classifying incomes between £700 and £5,000 was acknowledged to be more problematic, as this could only be done by taking a curve between these two points. When this was done for earned and unearned income the curves seemed implausible, as the unearned line sloped gradually, while the earned line dropped sharply.Footnote 7
Moreover, the unearned income line cast doubt on the accuracy of estimated incomes of more than £5,000, derived from the super-tax data. Starting from a total unearned income of £525 million, it was noted that the income distribution should broadly correspond to the capital disclosed by each income group. In addition to around £280 million of capital declared for estate duty, there was an estimated £80 million not declared, as probate and settlement estate duty had been previously paid in respect of it.Footnote 8 The original “red line” estimate was based on the assumption that this hidden capital was distributed by income in the same proportion as declared capital. However, as officials noted, “In reality… the proportion of Settled Capital is higher in the larger estates, where great blocks of land etc., pass under settlement.”Footnote 9 Further support for this correction was drawn from the fact that, while the line of total income ought to gradually approach the “unearned” line, the unearned line actually crossed the red total income line at £12,000, “thus giving the result that the unearned hypothetical income left after this point exceeds the corresponding total income declared for Super-Tax.”Footnote 10 Thus a corrected “blue-line” estimate for unearned incomes was calculated, which was extended to all incomes above £700.
Incomes exceeding £5,000 were also adjusted by the deduction of life assurance premium tax allowances. Total insurance premium income allowed to income tax payers was £11,882,213, of which £1,500,000 was attributed to taxpayers with total incomes exceeding £5,000. Of this sum, £200,000 was estimated to apply to incomes of £5–6,000, some of which were exempted from super-tax by the deduction of insurance premiums. Assuming the true income of the £5–6,000 group to be around £25,000,000, a “liberal estimate” of £13,500,000 was taken as exempted from super-tax by the deduction of insurance premiums. The published super-tax incomes were therefore adjusted as follows:
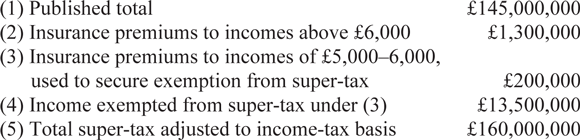
Earned income for the above £5,000 group (£49,231,000) was estimated by subtracting earned income for income taxpayers below this threshold from total earned income; although direct estimates from the tax schedules produced a similar figure (around £50,000,000).Footnote 11 In determining unearned incomes, the aggregate capital declared for Estate Duty (£280,000,000) was adjusted upwards by an estimated £80,000,000 for capital not declared because probate and settlement estate duty had previously been paid in respect of it—concentrated among the larger estates. This revised “blue ink line” estimation raised incomes of more than £5,000 from being represented by log 8.204 = £160,000,000 to log 8.333 = £215,300,000.Footnote 12 This revision may still have under-estimated the income share of the very rich, as settlement estate duty—on which the revised calculations were made, was said to be commonly avoided (Mandler Reference Mandler1997, p. 174).
Table 1 shows the IR’s corrected “blue line” 1911 income distribution estimate, together with estimates of total personal incomes and the total U.K. population of “tax units”: either a single adult (or a single minor with income in his or her own right), or a husband and wife, along with their dependents (Lydall Reference Lydall1959, p. 6). This includes tax units who did not pay any income tax. It also shows net income tax and the average virtual (effective) income tax rate for each income group.
THE INLAND REVENUE’S 1911 PERSONAL INCOMES DISTRIBUTION ESTIMATE
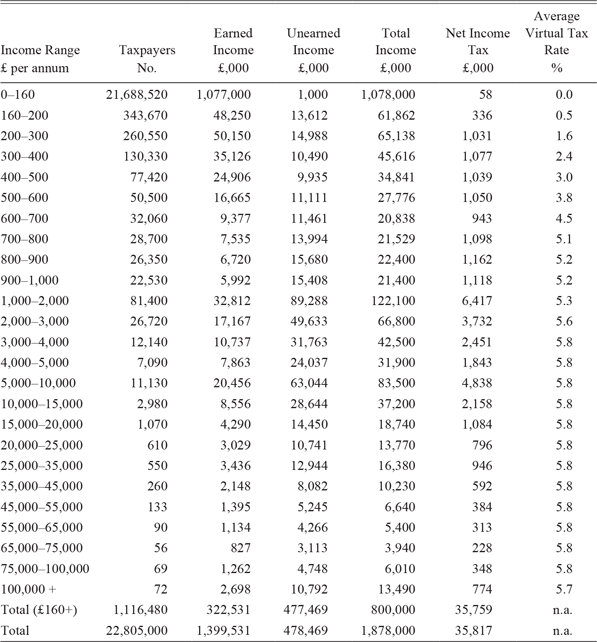
Notes: Unearned income under £160 estimate is from the 1911 enquiry. Earned income for the under £160 group is derived by abstracting total unearned income and total earned income for the £160+ classes from total income. Income tax for the under £160 group is based on unearned income, taxed at source at 5.8 percent.
Source: TNA, IR64/28, “Income tax. Classification of taxable income – year 1911-12,” statistical memorandum, n.d., c. 1914, Tables 7 and 10, and subsequent tabulations showing the adjusted “blue line” series, c. 1914. Total tax unit equivalents and incomes are from Atkinson (Reference Atkinson, Anthony and Piketty2007, pp. 180–81).
We follow the approach of the World Top Incomes Database and earlier studies in using tax data for top incomes and national accounts data for aggregate personal incomes (Piketty and Saez Reference Piketty and Saez2013, pp. 457–58). Our starting point is Atkinson’s (Reference Atkinson, Anthony and Piketty2007) estimates for both the tax unit and personal income totals. Atkinson’s tax unit data are based on males and females aged 15 or over, minus married females (and ignoring minors under 15 with income). Given that 1911 was a census year, this figure can be calculated directly from the census reports. This constructed figure was then adjusted proportionately by 0.977—the difference between the 1949 Blue Book (Britain’s main national accounting publication) figure and the constructed figure (Atkinson Reference Atkinson, Anthony and Piketty2007, pp. 180–83). Atkinson’s tax unit estimate for 1911, 22,805,000, is somewhat higher than that estimated by Bowley (Reference Bowley1919, p. 11) for the 1911 occupied population (20.15 million). However, Atkinson’s (Reference Atkinson, Anthony and Piketty2007, pp. 184–85) calculations from the 1911 census indicate that the number of tax units exceeded the occupied population by 2.4 million, which would give a total of 22.65 million tax units.
For total income, we follow Atkinson’s (Reference Atkinson, Anthony and Piketty2007, pp. 191–92) methodology, based on adjusting total “actual” income assessed by the IR for income tax purposes (net of incomes below the exemption limit; incomes of non-profit institutions; dividends to non-residents; and allowances for depreciation). Undistributed company profits are then subtracted, and the following items are added: non-assessed wages; plus salaries, self-employment income, and capital income, under the exemption limit. Atkinson’s estimate, shown in Column 2 of Table 2, uses the same actual assessed income figure as the IR’s 1911 income distribution estimate (as the IR’s adjustment to account for incomes exempted from super-tax owing to insurance premiums is made to express it on an assessible gross income basis). However, the IR used a lower estimate of relevant non-personal incomes, £65,454,000, which we substitute for Atkinson’s estimate of undistributed profits in Column 3.
ATKINSON’S ESTIMATE OF 1911 PERSONAL INCOME COMPONENTS AND OUR ADJUSTMENTS (£ million)

Sources: Columns 1–2, Atkinson (Reference Atkinson, Anthony and Piketty2007, pp. 191–92). Columns 3–4, see text.
Of the other components of total personal income used by Atkinson, wages constitute the only item that is large enough for errors to significantly bias the overall total. Salaries, self-employment income, and dividends and capital income, below the tax threshold, are based on estimates for 1911 by Bowley (Reference Bowley1937, p. 81), which used 1911 population census data in conjunction with a 1909–1910 British Association (Economics Section) enquiry into the earnings of “intermediate workers” (salaried or self-employed workers under the income tax threshold) (Cannan et al. Reference Cannan, Bowley, Edgeworth, Lees Smith and Scott1910). Given the extensive data used in the Cannan et al. survey, together with the relatively small contributions of these components of total income, any plausible errors are unlikely to significantly bias the total.
Atkinson’s wages figure is based on Feinstein’s (Reference Feinstein1972, p. T55) wage series, minus an estimated £8 million of wage income that fell within the exemption limit. Atkinson reduced this by 5 percent, “to allow for the fact that some wage income would have escaped the income of the Inland Revenue” (Atkinson Reference Atkinson, Anthony and Piketty2007, p. 191), based on post-1944 increases in wages following the introduction of “Pay As You Earn” (collection at source). While such a deduction was justified for later years, when many wage-earners paid income tax, it is more problematic for 1911, as almost all wage incomes were below the threshold. We thus further adjust the estimate in Column 4, using Feinstein’s original wages figure. Given that an earlier estimate of 1911 wages by Bowley (Reference Bowley1937, p. 83), gave a figure of £802 million (2.69 percent in excess of Feinstein’s estimate), the potential margin of error appears small. Moreover, even a 10 percent underestimation of non-assessed wage income would only increase total personal income by 4.15 percent. Indeed, the most likely bias in the data is the one that all tax-based estimates are prone to—tax evasion/avoidance beyond that corrected for in the IR estimate.
A final question regarding the 1911 estimate is the extent to which 1911 was a “representative” pre-1914 benchmark. Table 3 examines a number of relevant indicators for 1909–1913: real GDP growth; real personal income growth; growth of the income tax net product; and Atkinson’s estimations of the top 0.05 and 0.01 percent income shares, derived from the super-tax data. None of these indicate that 1911 was atypical, while Atkinson’s (Reference Atkinson, Anthony and Piketty2007) estimates of top income shares, using the super-tax data, provide very similar estimates throughout this period (particularly for 1909–1912).
PROXIES FOR THE REPRESENTATIVENESS OF 1911 AS A PRE-1914 BENCHMARK YEAR

Sources: Real GDP growth (UK, Bank of England 2018); at factor cost, includes Ireland. Real personal income (Atkinson Reference Atkinson, Anthony and Piketty2007, p. 182). Real income tax net product (UK, Inland Revenue 1913, p. 95; 1920, p. 59).
Another important issue concerns the units of analysis. Tax units represent neither individuals (the units of income generation) nor households (the primary units of expenditure). There are strong conceptual arguments for taking the household as the relevant unit of analysis, especially in a historical context. Household income pooling (albeit incomplete) was common during the first half of the twentieth century. Moreover, household-based measures control for intra-household specialization between paid work, housework, and augmenting human capital through education and training (see De Vries Reference De Vries2008, pp. 186–237, 258–68; Bourke Reference Bourke1994).
We consider that household-level measures provide valuable counterparts to tax-unit based estimates and intend to develop these in further work. However, this is beyond the scope of the current paper (as a full analysis would entail the use of a broad range of data, including recently-digitized household expenditure surveys and population census data, in addition to our tax data). To examine the extent to which the IR survey corroborates, or modifies, previous estimates, we compare the IR’s estimate with an alternative estimate for 1911, mainly based on published IR data by Lindert and Williamson (Reference Lindert and Jeffrey1983), with subsequent corrections by Lindert (Reference Lindert, Anthony B. and Bourguignon2000), which builds on earlier work by Arthur Bowley, Josiah Stamp, and Guy Routh (hereafter BSR estimate). We assume that each assessed tax unit represents a household (which is a reasonable approximation for the top 5 percent of income earners) and use the same personal income total as in Table 1.
As shown in Table 4, the ratios of households with incomes above £160 in the two estimates are very similar, indicating that tax units are close proxies for households above this income range. However, there are substantial differences in parts of the distribution. Total incomes of £160 or above (roughly approximating to the top 5 percent of incomes) are slightly lower in the IR estimate than the BSR estimate, as indicated by the cumulative ratios. However, for incomes of more than £5,000 (the top 0.12 percent of incomes, according to the IR estimate), incomes and households are 42 and 37 percent higher, respectively, than the BSR data. Conversely, the £700–£5,000 band’s income share is substantially reduced. This is expected, given that the main adjustments to the published IR data involved re-allocating tax-units and incomes in the £700–£5,000 bracket to higher income classes, owing to insurance premium exemptions and previously paid probate and settlement estate duty. The main impacts of these revised estimates are, therefore, to markedly increase the income shares of the super-rich (top 0.1 percent) and slightly reduce the shares of the 0.1–5.0 percent. More generally, our estimate serves to confirm the broad findings of what are shown to be fairly reliable academic estimates of overall top British income shares in 1911, which had previously been described as “necessarily eclectic” (Lindert Reference Lindert, Anthony B. and Bourguignon2000, p. 174), owing to the absence of more detailed information.
COMPARISON BETWEEN THE 1911 IR INCOME DISTRIBUTION ESTIMATE AND THE LINDERT AND WILLIAMSON ESTIMATE BASED ON THE BOWLEY–STAMP–ROUTH (BSR) DATA (FOR HOUSEHOLDS)
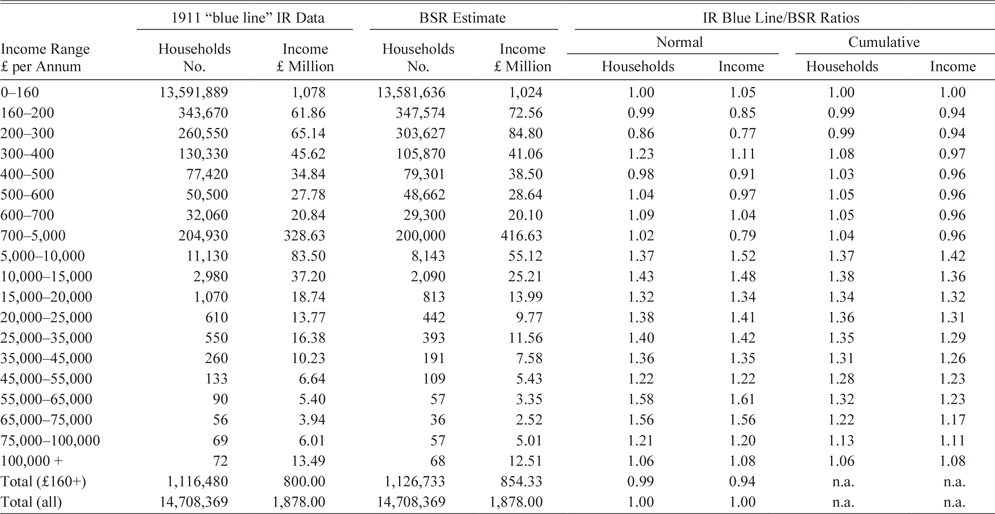
Sources: IR data and total person income, as for Table 1. “BSR” estimate, Lindert and Williamson (Reference Lindert and Jeffrey1983, p. 99); modified in Lindert (Reference Lindert, Anthony B. and Bourguignon2000).
ESTIMATES FOR 1918–1949
WWI significantly reduced income inequality, including both a redistribution from the upper- and middle-classes to the working-class and from skilled to less-skilled manual workers (Routh Reference Routh1965, p. 104). IR estimates of the income distribution for taxpayers in 1918 and 1919 were produced for evidence in two official enquiries. These covered just under one-quarter and just under one-third of all tax unit equivalents, respectively, compared to only 4.9 percent in the 1911 classification, reflecting the expansion of the income tax base. Table 5 shows the income distribution for 1918 and 1919, together with the tax levied at each income band (after allowances, etc.).
IR ESTIMATES OF THE DISTRIBUTION OF PERSONAL INCOMES FOR 1918 AND 1919

Notes: * Excludes a negligible amount of investment income taxed at source for the under £130 group.
Source: 1918 estimate (UK, Inland Revenue 1920, p. 70). 1919 estimate (TNA, IR 75/131, Committee on the National Debt and the Incidence of Existing Taxation, Memorandum on the statistics of the Inland Revenue Duties, May 1924, pp. 28–29).
The data were acknowledged to be imperfect, especially given the inadequate information available for estimating non-personal income and income accruing to residents abroad—collectively estimated at £230,000,000 for 1918 and £260,000,000 in 1919.Footnote 13 As profits under Schedule D were then assessed based on the average over the previous three years, the 1918 and 1919 data also partially reflect the very high profit rates of the war years and the wider inflationary environment (Lydall Reference Lydall1959, p. 2). Like the 1911 estimate, the data representing the super-tax income bands show substantially larger numbers of individual incomes than the super-tax data, suggesting that the figures were adjusted for settled estates and similar distortions (UK, Inland Revenue 1920, p. 85).
Figure 1 shows Atkinson’s estimates for the income shares of the top 0.01, 0.05, and 0.1 percent of the income distribution from 1911–1949 (except for the top 0.1 percent, only available from 1913, following a widening of the super-tax band). These are based on the super-tax data, except for 1918, 1919, 1937, and 1943–1949, where he used the IR income distribution estimates. Despite the 1918 and 1919 estimates typically being dismissed as irrelevant owing to the inflationary and turbulent conditions of these years (e.g., Bowley Reference Bowley1942, p. 113), Atkinson’s data suggest that they were not atypical of the longer-term super-tax/surtax income trend.
CHANGES IN PERSONAL INCOME SHARES OF THE TOP 0.01, 0.05, AND 0.1 PERCENT, ACCORDING TO SUPER/SURTAX RETURNS, 1908–1950

The next IR income distribution estimate for 1937, was based on a special investigation of all tax returns for incomes of £200 or more (16.53 percent of all tax units); the first of a series of what came to be known as “Surveys of Personal Incomes” (hereafter “SPI’s”) (UK, Inland Revenue 1946, pp. 28–29). Published data from the investigation provide very limited disaggregation for incomes above £20,000—with only three income classes, the highest covering incomes above £50,000. Fortunately, the final working sheets from the survey have survived, enabling us to replace the three highest income classes with seven income classes, the highest of which covers £100,000 or more, in Table 6.Footnote 14
The IR’s 1937 Personal Income Distribution Estimate
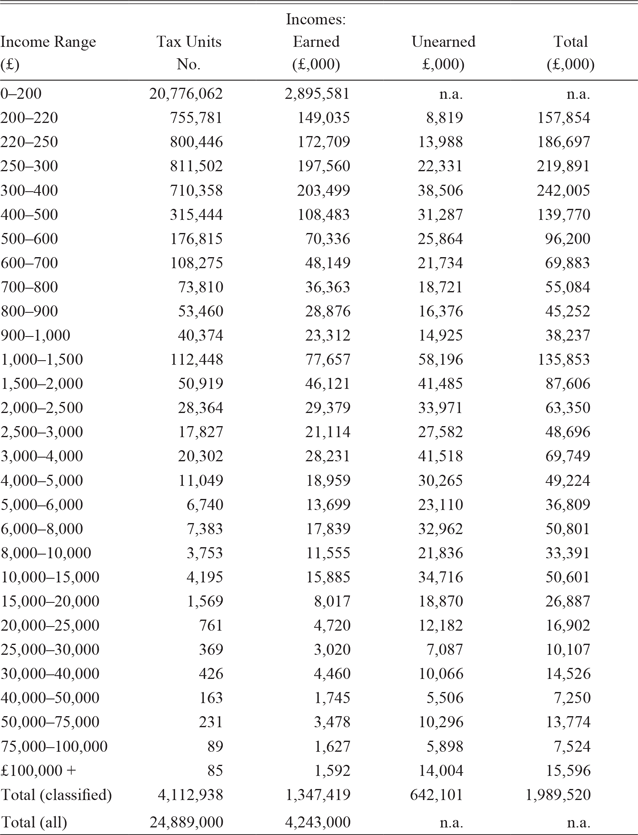
Notes: Figures above £20,000 are consistent with the published data, but provide greater disaggregation. Incomes below £200 are based on subtraction of total tax unit equivalents and incomes from the classified totals.
Sources: Incomes £200–20,000 (UK, Inland Revenue 1946, p. 30); incomes above £20,000 (TNA, IR 64/163, data sheets for the 1938–1939 Surtax census).
Further estimates were made for 1938, 1941, 1947, and 1948, based on the 1937 SPI, updated by the annual statistics of assessments and other data (UK, Parliamentary Debates 1942; UK, Inland Revenue 1949, p. 34, 1950, pp. 83–87). In 1949 a new SPI was conducted, based on a 10 percent sample survey of all income taxpayers (Lydall Reference Lydall1959, p. 3). The IR found that the 1949 SPI had important discrepancies when compared with other evidence. There was a considerable deficiency in income from interest and dividends taxed at source (mainly affecting incomes below £2,000); plus an apparent omission, as compared with National Insurance statistics, of more than a million women in paid employment. The IR (1952, pp. 96, 117) produced a corrected distribution to include these incomes. Further revisions were made when the 1949 data were published in the 1954 Blue Book. These appear to involve an adjustment raising the aggregate value of real property (Schedule A) income, to adjust for the average rise in rents since the last revaluation in 1935/1936 (Lydall Reference Lydall1959, p. 26).
We have compiled a composite series, using the official Blue Book figures for incomes from £250–£20,000, together with incomes above £20,000 from the original 1949 SPI. No disaggregated data for incomes above £20,000 were available in any tabulation other than the SPI, although total numbers of incomes, and their amounts, for this range change very little between the different estimates. Data for incomes of £135–150 and £150–250 are from the corrected (Table 110) IR figures. The collated table has totals for incomes and numbers of tax units above £250 which are identical to the National Statistical Agency (a predecessor of the Office for National Statistics) estimates, to three significant figures.
NEW ESTIMATES FOR TOP INCOME SHARES AND THEIR EARNED AND UNEARNED COMPONENTS
We present the five 1911–1949 British income distribution estimates based on direct data (rather than adjustments to previous years’ estimates) in Table 8. For three of these, 1911, 1937, and 1949, the data are disaggregated into earned and unearned components, enabling us to explore the relative importance of capital and labor income in the declining incomes of the rich. Our analysis is restricted to the top 5 percent of the population, as the 1911 survey does not classify lower incomes (which were not then subject to income tax). However, we are still able to examine top incomes at all typical benchmarks up to this level (the top 0.01, 0.05, 0.1, 0.5, 1, and 5 percent of British tax units). Moreover, our unusually detailed data for very top incomes enables us to examine total income shares of the top 0.001 percent—the super-rich group; comprising 228 tax units in 1911.
We considered two alternative approaches for estimating income shares. The first is the standard method in the literature, the Pareto distribution (e.g., Atkinson and Piketty Reference Atkinson and Piketty2010), and the second is to assume a linear approximation between the tabulated intervals. The Pareto approach has been found to be an accurate approximation towards the upper end of the income distribution (particularly the top 1 to 0.1 percent), but performs poorly for levels above the 0.1 percent (Stamp Reference Stamp1914, pp. 200–204; Feenberg and Poterba Reference Feenberg, James and Poterba1993, pp. 172–73).
A linear weighted average constitutes a poor approximation where there are few income classes, as the curvature of the distribution is lost if the raw data do not align closely to the critical points in the distribution. However, this is clearly less of an issue where there are large numbers of income categories, as little interpolation is needed. As we have a relatively large number of categories for each year—25, 29, and 33 bands in 1911, 1937, and 1949, respectively (see Tables 1, 6, and 7), we use linear interpolation, but also provide comparative estimates using the mean split histogram method for 1911, to allow direct comparisons with Atkinson’s (Reference Atkinson, Anthony and Piketty2007) estimates for the subsequent benchmark years. The two methods provide very similar values.Footnote 15
THE IR’S 1949 PERSONAL INCOME DISTRIBUTION ESTIMATE

Notes: Lowest income class is based on subtracting all tax units and incomes from the total classified values.
Sources: Income ranges £135–250 (UK, Inland Revenue 1952, p. 117); £250–£20,000 (UK, CSO 1954, p. 29); £20,000 and above (UK, Inland Revenue 1952, p. 97).
Table 8 provides data for income shares (for tax units) derived from the 1911–1949 income distribution estimates shown in Tables 1 and 5–7, together with Atkinson’s estimate of the shares of the top 0.01 and 0.05 percent in 1911, and his 1913 estimate for the top 0.1 percent, derived from the surtax data. The comparison indicates that the surtax data are more representative of top incomes at the 0.01 percent level in 1911 than for broader groups within the surtax spectrum, a result consistent with our comparison with the BSR estimate for households, as shown in Table 4. Meanwhile all classified income groups show substantial falls in income shares between 1911 and 1918–1919, from 1918–1919 to 1937, and from 1937 to 1949.
PERCENTAGE INCOME SHARES OF TOP INCOMES, 1911, 1918, 1919, 1937, AND 1949 (PERCENT OF TAX UNITS)

Notes: * This estimate refers to 1913 as this is the first estimate available for this income group (following an extension of the super-tax bracket).
Sources: a Atkinson (Reference Atkinson, Anthony and Piketty2007, p. 141). b The authors’ estimates using linear interpolation. c The authors estimates using the mean split histogram method. Other data, see text.
WWI hit the top 0.001 percent relatively lightly compared to broader top incomes, with a 28.5 percent income share fall between 1911–1918, compared with 30.5 percent for the top 0.01 percent; 40.3 percent for the top 0.1 percent; 35.8 percent for the top 1.0 percent; and 32.6 percent for the top 5 percent. This may reflect the ability of that section of the super-rich who still had control over their family businesses to benefit from high war-time profits. More detailed data for a slightly later period, 1929, are available for Britain’s “millionaires” (with annual incomes of more than £50,000), compiled by the IR in order to estimate how much a 40 percent estate duty on them would raise. This showed that Britain’s very richest individuals were business owners, while its richest aristocrats, the Dukes of Bedford and Westminster, only ranked seventh and eighth on the IR’s list.Footnote 16
However, the inter-war period as a whole was challenging for the super-rich. The 1918–1937 percentage declines in income shares for the top 0.001 and 0.01 percent (36.8 and 32.2, respectively), were substantially larger than for broader top income groups (18.4 percent for the top 0.1 percent, 12.7 percent for the top 1.0 percent, and only 4.6 percent for the top 5 percent). WW2 hit the super-rich even more severely, with income share falls (relative to 1937) of 57.8 and 50.9 for the top 0.001 and 0.01 percent, compared with 32.8 percent for the top 1.0 percent, and 26.3 percent for the top 5.0 percent.
Over the full 1911–1949 period the top 0.001 percent experienced the largest proportionate fall in income shares, of 80.1 percent. The magnitude of decline was lower for broader income groups, but still considerable, with a 76.9 percent fall for the top 0.01 percent and falls of 78.3, 62.1, and 48.0 percent for the top 0.1, 1.0, and 5.0 income percentiles, respectively. To investigate the causes of this decline, we examine movements in earned and capital income over the three benchmark years for which these data are available: 1911, 1937, and 1949. The 1949 data are based on the original SPI, rather than the revised figures (which do not disaggregate income by source). They also show gross incomes (before deductions of expenses, etc.) and group Schedule B incomes (profits from farming land) with Schedule A (incomes from real property) under investment income; while the estimates for earlier years treat Schedule B as earned income. However, as Figure 2 shows, this would not have a significant impact on total earned income. Moreover, by 1949 cases where the annual value of farm lands exceeded £100 were assessed under Schedule D, as were the profits of all nurseries and market gardens (UK, Inland Revenue 1951, p. 39).
TAXABLE INCOME UNDER EACH SCHDULE, AS A PROPORTION OF TOTAL INCOME, 1937 (PERCENT)
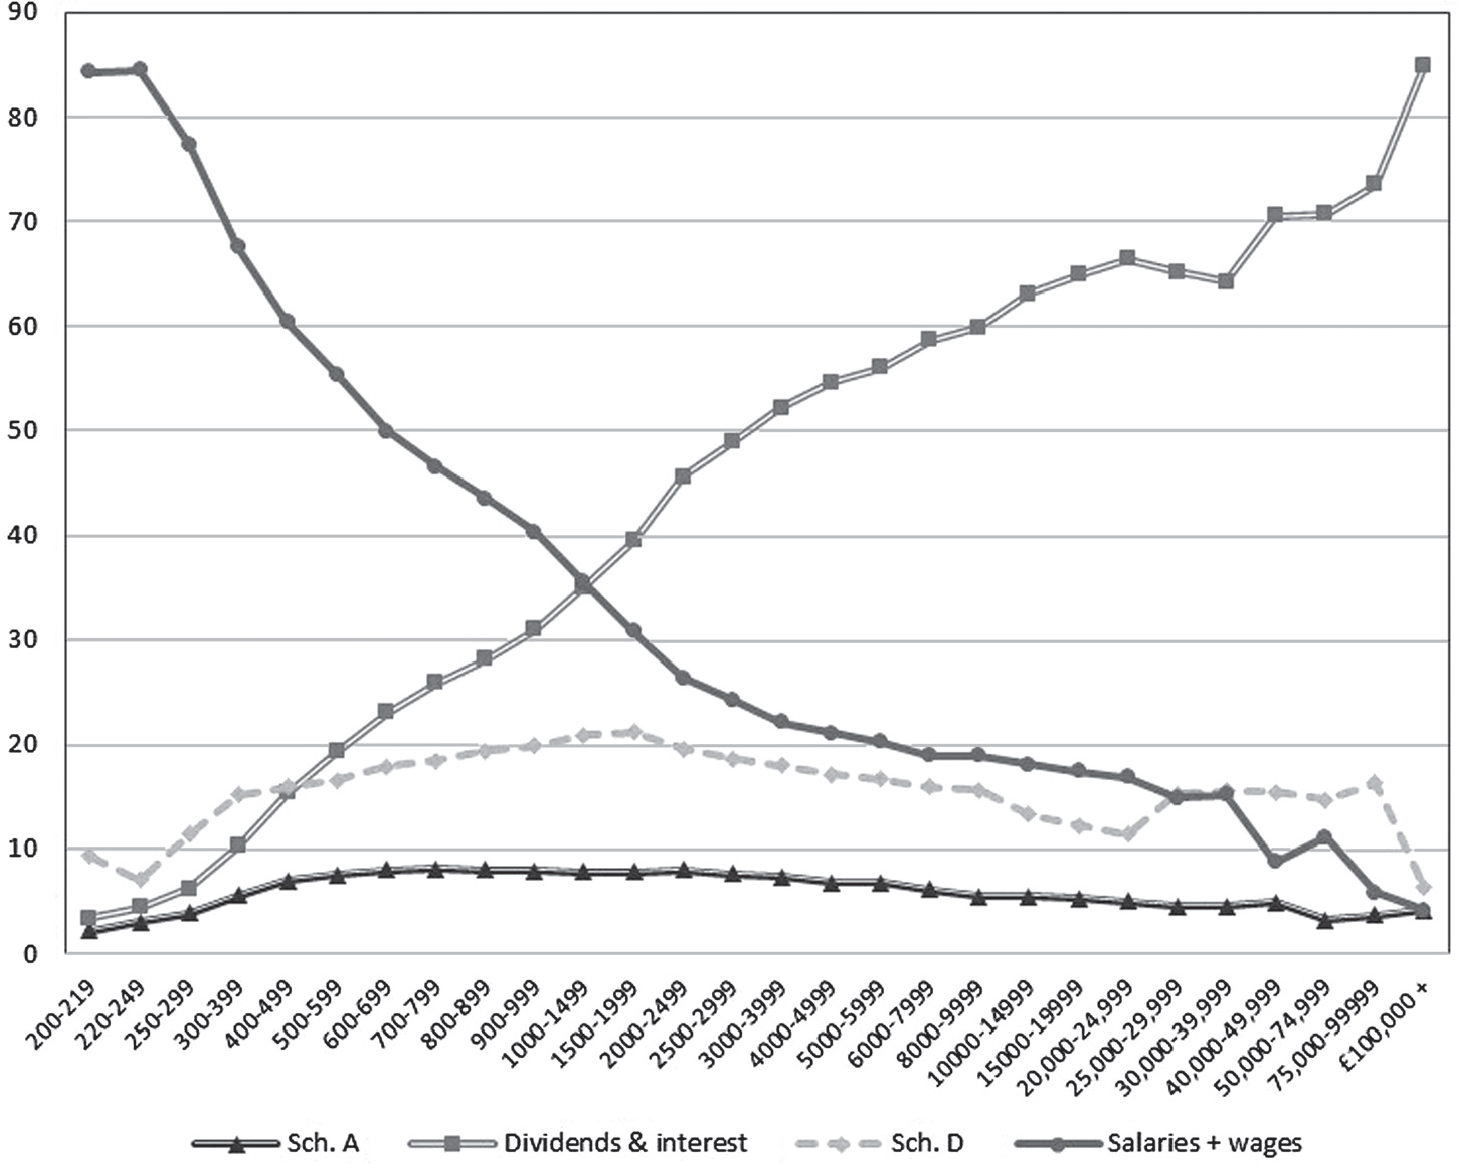
Table 9 shows ratios of unearned to total income for our three benchmark years, and Table 10 shows earned and unearned income weightings for the top 0.01 percent to 5.0 percent of British incomes. In 1911 the top 0.01 percent (the highest income fraction that can be derived from the earned and unearned income data for all years) relied on capital income for 78 percent of their total income, although this fell to only 55 percent by 1949. However, larger falls in unearned incomes were experienced by broader income groups within the top 5 percent, with the top 1 percent—which received almost three-quarters of total income from capital sources in 1911—having only 28 percent capital income and the top 5 percent having a precipitous fall in their capital income weighting, from 63 percent to only 13 percent. The data thus reveal both a considerable decline in the relative importance of top capital incomes and a more severe relative decline for the lowest-income segments of our top income group.

COMPARISON OF TOTAL AND EARNED INCOME
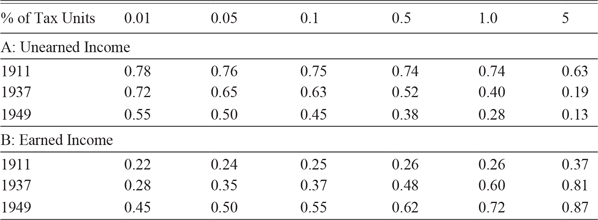
Note: 1949 data are based on gross personal income (as the data did not allocate deductions between earned and unearned income).
Source: See text.
WHAT CAUSED THE FALL IN TOP INCOME SHARES?
Disaggregating the earned and unearned components of top incomes is important, as nineteenth-century Britain’s extreme income inequality compared to other developed nations has been linked to its unusually high inequality in wealth and, therefore, investment income (Lindert Reference Lindert, Brenner, Kaelble and Thomas1991, pp. 220–24). More generally, as Piketty and Saez (Reference Piketty and Saez2006, p. 200) have noted, decomposing incomes into earned and unearned components enables analysis of the economic mechanisms underpinning changes in the distribution of labor, and capital, incomes, which can be very different. Lindert (Reference Lindert, Brenner, Kaelble and Thomas1991, p. 225) similarly called for models directed at explaining movements of capital incomes as well as earnings inequality, if we are to develop a comprehensive theory of what caused the decline in income inequality across industrialized nations.
Wealth is typically much more unequally distributed than income, while inequality of capital income typically exceeds wealth inequality. The upper ranks of the wealth distribution achieve higher yields on their capital owing to: higher returns for larger holdings in the same asset class (e.g., bank accounts); lower proportional transactions costs; greater possibilities for diversification to achieve higher yields at any given level of total portfolio risk; and a weaker preference for liquidity (Daniels and Campion Reference Daniels and Campion1936, pp. 60–62; Atkinson and Harrison Reference Atkinson and Harrison1978, p. 173; Lydall and Tipping Reference Lydall and Tipping1961, p. 95).
Our three benchmark years show a marked decline in the contribution of unearned, to total, income. The lack of annual, or relatively frequent, data on capital incomes prevent time-series analysis of the causes of the collapse in top capital incomes. However, the drivers of this process appear to be broadly similar to those identified for other western countries—a series of shocks and policy responses that negatively impacted on wealth and/or income flowing from wealth—principally the two world wars and their aftermaths, together with the 1920–1921 and 1929–1932 recessions (Atkinson Reference Atkinson, Anthony and Piketty2007, pp. 167–68; Atkinson, Piketty, and Saez Reference Atkinson, Piketty and Saez2011, p. 5). Prior to 1914 British wealth was highly concentrated, by international standards, among the top 1 percent, and especially the top 0.1 percent, of the population. These held around 70 percent and 33 percent of total personal wealth, respectively—partly reflecting Britain’s unusually high concentration of land ownership. Meanwhile the bottom 95 percent of the population held only around 10 percent of personal wealth. Moreover, these top wealth shares are likely to be under-estimates, as a substantial proportion of settled property was excluded from the estate duty statistics on which they are based (Alvaredo, Atkinson, and Morelli Reference Alvaredo, Atkinson and Morelli2018, p. 33).
Top wealth shares experienced severe declines over the next 40 years. The top 1.1 percent of tax units in 1911 were primarily “rentiers” (with more than 50 percent unearned income), but rentier-dominated incomes accounted for only the top 0.4 percent of tax unit equivalents in 1937 (from the £2,000–£3,000 income bracket upwards); and represented only the top 0.026 percent in 1949 (from the £12,000–15,000 bracket).Footnote 17 This corroborates findings for other industrialized nations during this period, that falling top percentile income shares are primarily a capital income phenomenon; “top income shares fall because of a reduction in top wealth concentration” (Atkinson, Piketty, and Saez Reference Atkinson, Piketty and Saez2011, p. 5).
One contributory factor was the fall in agricultural land values and disposals of land holdings at prices well below real 1911 values. The years following the Armistice witnessed major land sales by the aristocracy and gentry; the proportion of owner-occupied agricultural land rose from 11 percent in 1914 to 37 percent in 1927, with sales concentrated in 1919–1921 (Mandler Reference Mandler1997, p. 228). Some studies argue that land-owners shrewdly disposed of land in the early post-Armistice period, using the proceeds to diversify their asset base, and/or shift into safer securities, thereby maintaining their nominal wealth (Howkins Reference Howkins2003, p. 58; Mandler Reference Mandler1997, pp. 242–43; Rothery Reference Rothery2007). However, such strategies failed to preserve real portfolio values, or incomes, given high war-time inflation. Nominal land values had appreciated substantially between 1911–1921, but in real terms had fallen to around half their 1911 value.Footnote 18 Moreover, despite substantial disposals, the gentry and aristocracy still owned the majority of Britain’s land at the outbreak of WWII. They thus faced falling asset incomes; agricultural gross rentals payable under leases in England and Wales had fallen to only 47.5 percent of their real 1911 values by 1921. Despite some subsequent recovery—to 54.1 percent of 1911 values by 1937—another bout of war-time inflation reduced them to only 44.2 percent of real 1911 values in 1949.Footnote 19 Rent’s overall share of total domestic income is estimated to have fallen from 12.0 percent in 1911 to 7.3 percent in 1922 and while it recovered to 9.8 percent in 1937 it fell to a low of only 4.5 percent in 1949 (Feinstein Reference Feinstein1972, pp. T5–T6).
There was also downward pressure on interest and dividends, which dominated unearned, and total, top incomes by 1937 (see Figure 2). Prior to 1914 Britain devoted a higher proportion of savings to capital export than any other major country has ever done (Matthews, Feinstein, and Odling-Smee Reference Matthews, Charles and Odling-Smee1982, p. 353). However, during WWI government progressively restricted access to overseas (especially non-Empire) securities, to protect Britain’s foreign exchange position. Treasury restrictions were relaxed from April 1919, but were replaced by Bank of England control over new overseas issues, which remained, intermittently, very restrictive during the 1920s (Atkin Reference Atkin1970; Attard Reference Attard, Michie and Williamson2004). The 1930s witnessed much more severe controls on new London foreign issues; in 1935 these accounted for less than 40 percent of new issues and their annual value was less than one-fifth of that in the 1920s (Kynaston Reference Kynaston1991, p. 143).
Periodic pressures to divest of securities on unattractive terms further lowered portfolio yields. During WWI the Treasury sought to acquire dollar securities and sell them in New York. Patriotic appeals were followed by a penal tax on their dividends/interest in the 1916 Budget, while from January 1917 the Treasury had powers to requisition securities for selling (Morgan Reference Morgan1952, pp. 326–31). British overseas investments, valued at almost £4,000 million on the eve of WWI, are estimated to have declined by around 15–25 percent owing to these measures (Feinstein Reference Feinstein1990; Hardach Reference Hardach1977, pp. 289–90). Then in the 1930s “cheap money” policy led to a boom in conversion issues, replacing high-yielding government and corporate securities with lower-interest ones, led by the June 1932 conversion of the 5 percent 1917 War Loan stock to 3.5 percent undated stock (Kynaston Reference Kynaston2000, pp. 365–68). This trend was identified by the IR’s Research Department (monitoring “millionaire” incomes), which noted a tendency of declining top incomes, owing to, “the falling rate of interest and dividends incomes derived in the main from gilt edged securities and sound investments.”Footnote 20
High war-time inflation, especially during WWI—with prices rising by 122 percent between 1913–1921—also had a severe impact on real asset values. Evidence for estates subject to estate duty between 1903–1915 indicates that investments for which interest was fixed, at least in the short run, comprised around 54 percent of classified assets. Thus many rentiers may have been forced to dispose of assets in order to maintain their established standard of living.Footnote 21
The cumulative impacts of these shocks were considerable. While unearned incomes rose by 28.8 percent in nominal terms between 1914 and 1918, they declined by 34.6 percent in real terms, and by 22.8 percent when deflated by nominal earnings.Footnote 22 Net property income from abroad fell from 8.74 percent of net national product in 1911 to 4.97 percent in 1923. It remained little changed in 1937, at 4.50 percent, but collapsed during WWII, to only 2.12 percent in 1949. Broader data on all rents, dividends, and interest, available only from 1920, also show stability during the inter-war years (22.47 percent of total personal pre-tax income in both 1923 and 1937), followed by a sharp fall to only 11.41 percent in 1949.Footnote 23 The dominance of negative capital income shocks as drivers of income reduction for the rich is consistent with Atkinson’s annual super-tax estimates of top income shares in Figure 1. In addition to a general downward trend, WWI and WWII, and the 1920–1921 and 1929–1932 recessions stand out as periods of particularly rapid declines in top income shares (Atkinson Reference Atkinson2005, pp. 335–36).
To some extent the decline in unearned top incomes can be directly linked to improvements in incomes and living standards for the bottom 90 percent of the population. For example, rent control, introduced in 1915, depressed the incomes of landlords, but substantially reduced the real value of a major household expenditure burden, in a country where around 90 percent of households were private tenants (Merrett Reference Merrett1982, p. 1). Rent control also subsequently led to extensive sales of house property portfolios, mainly to sitting tenants, at prices reflecting their low, controlled, rents (Speight Reference Speight2000, pp. 39–40). Meanwhile, the scarcity of low-risk, higher yielding assets during the inter-war years led to substantial deposits in building societies (mutual savings and loan institutions for house purchase) by high-income individuals, facilitating an increase in building society mortgage debt from £120 million in 1924 to £636 million in 1937. This underpinned the owner-occupier house-building boom of the 1930s—which produced Britain’s greatest recorded proportional housing stock increase, together with the lowest recorded ratios of weekly house mortgage costs to average incomes (Scott Reference Scott2013, pp. 107–108). These conditions also made it easier for local authorities to raise loans for a series of inter-war social housing programmes, cumulatively creating around 1.3 million new homes (Speight Reference Speight2000, chapters 4–5; Scott Reference Scott2013, pp. 98–127). Meanwhile restrictions on overseas new issues led the City of London to become increasingly involved in British industrial finance—expanding industrial growth and employment—despite protests from City-insiders that domestic industrial issues involved more work and less profit than the foreign loan stock that merchant banks had hitherto focused on (Kynaston Reference Kynaston2000, pp. 131–37, 295).
While capital incomes dominate the top income decline, our estimates also show a substantial fall in top earned incomes. This appears more surprising, given that the ratio of earnings for professional and managerial occupations, compared to all workers, remained relatively stable between 1913/1914 and 1935/1936 (Routh Reference Routh1965, p. 107). However, it mainly reflects a decline in Schedule D incomes—which were classed as earned income, but included a substantial element of profits. Schedule D mainly covers profits from businesses and professions (including employers’ salaries). While self-employment incomes are commonly, but not universally, categorized as earned income in national personal income series (Bengtsson and Waldenström Reference Bengtsson and Waldenström2018, p. 720), this schedule also includes returns on capital invested in unincorporated businesses by proprietors and partners, together with some items of pure investment income—for example, colonial and foreign securities (other than government securities) and interest on war securities not taxed at source (Atkinson Reference Atkinson, Anthony and Piketty2007, p. 161; UK, Inland Revenue 1912, pp. 111–13, 1939, p. 56).
In 1911 Schedule D accounted for 61.8 percent of all taxable income. However, its contribution fell to 42.6 percent in 1929, 31.9 percent in 1937, and 26.2 percent in 1949 (UK Inland Revenue 1920, p. 67, 1940, p. 56, 1953, p. 42). This largely reflected the advantages of incorporation as a vehicle for tax avoidance. The whole of a company’s profits could be re-invested, or otherwise not distributed, in order to avoid tax, while it was also possible to distribute company profits in the form of capital gains (which were not subject to income tax in Britain).Footnote 24 Given this switch of much Schedule D income from “earned” to “unearned” income, the underlying collapse in unearned income between 1911–1949 is thus likely to have been substantially greater than the above figures suggest.
CONCLUSIONS
Our rediscovered 1911 income distribution estimate confirms the findings of previous studies that Britain’s pre-1914 income inequality was high by international standards, primarily owing to extreme British inequality in unearned income, in turn reflecting its peculiarly unequal wealth distribution (Alvaredo, Atkinson, and Morelli Reference Alvaredo, Atkinson and Morelli2018; Lindert Reference Lindert, Brenner, Kaelble and Thomas1991, pp. 220–224). Britain’s 1911 income shares for the top 0.01, 0.1, and 1.0 percent of tax units were 4.60, 13.81, and 30.15 percent, respectively, compared to 3.0, 8.0, and 19.0 percent for France in 1900–1910 and 2.76, 8.62, and 17.96 percent for the United States in 1913 (Piketty Reference Piketty2003, p. 1037; Piketty and Saez Reference Piketty and Saez2003, pp. 8–9). The following decades witnessed a severe long-term reduction in British factor incomes for rent, interest, and dividends, which substantially reduced unearned income inequality and dominated the fall in overall income inequality. This explains the paradox between the observed reduction in income inequality and the lack of evidence for any substantial redistribution of earnings between salary and wage-earners. However, despite having closed much of the relative gap with America, British incomes remained more unequal than in the United States or France in 1949, a result consistent with recent research on long-term movements in British and American top wealth shares (Alvaredo, Atkinson, and Morelli Reference Alvaredo, Atkinson and Morelli2018, pp. 43–45).
To some extent Britain’s income inequality reduction represented a genuine redistribution from the rich to lower income groups (even prior to income tax and fiscal transfers). The reduction in factor incomes from rent, interest, and dividends provided greater scope for higher factor incomes for wages and salaries, while lower income families benefited directly from controlled rents and, to some extent, from lower interest rates and greater credit availability for house purchases. However, the data also reflect rising tax avoidance and evasion, incentivized by a ten-fold increase in the top rate of income tax between 1911 and 1949, either directly, or by companies (e.g. by retaining profits to benefit their shareholders in the longer term, rather than incurring heavy taxes on their dividends).
While Britain started from a position of greater income inequality than other major industrial nations, its overall trend towards reduced inequality, and the underlying causes, appear broadly similar. Research on France, the United States, and Japan has found that reductions in income inequality during the first half of the twentieth century were also driven by severe shocks to the capital holdings of the wealthy, including depressions, bankruptcies, war-time inflation, declining real asset prices, and the fiscal shocks of war finance (Piketty Reference Piketty2003, pp. 1011–19; Piketty and Saez 2006, p. 203, 2003, p. 12, Reference Piketty and Saez2013, p. 474). In common with Piketty and Saez’s findings for the United States and France (Piketty Reference Piketty2003, p. 1011; Piketty and Saez 2013, pp. 461–62, Reference Piketty and Saez2003, pp. 3–11, 33–35), Britain’s income redistribution appears to be driven more by political shocks and policy responses, together with non-market mechanisms such as labor market institutions, rather than technological change.
This in turn raises the question why political shocks, policy responses, and non-market mechanisms increased income inequality during 1911–1949, but have acted to concentrate incomes since the 1970s. A partial explanation may be found in theories first advanced in the 1950s and 1960s by historians such as Stanislaw Andrzejewski, Richard Titmuss, and Philip Abrams, that the levelling tendency of wars is proportional to the extent to which low-status groups and classes become essential to the war effort—leading to policy responses and institutional changes that might persist well beyond the war period.Footnote 25 Such impacts would be reinforced by tax increases, which reduced even “pre-tax” personal incomes; for example, higher corporation taxes reduced dividends and incentivized firms to retain profits. However, another important factor concerns the changing sources of top incomes. In both Britain and the United States the contribution of capital incomes to top incomes has declined substantially since the 1970s, in favor of salary and entrepreneurial incomes (Piketty and Saez Reference Piketty and Saez2003, p. 17). Thus Marx’s (Reference Marx1954, pp. 585–89) prediction that shocks lead to the concentration of capital would imply that top entrepreneurs and executives might benefit from them, while rentiers, receiving incomes from more diversified portfolios of securities, would be more likely to suffer from their negative aggregate economic impact.
Another related factor governing the impact of shocks on income distribution, under different institutional environments, concerns the ability of nation states to tax rich individuals, or the factor incomes they receive. The 1911–1949 inequality reduction was driven, at least in part, by the progressive collapse of the liberal, globalized, world order, which made it more difficult for the rich to seek out more attractive overseas outlets for their investments and made policies such as capital controls more politically expedient and acceptable. Similarly, the policy liberalizations of the 1980s that heralded the start of the new globalization (and the resumption of growing income inequality in western nations) have made it far easier for the rich to offshore their assets, or themselves, either in search of better investments opportunities, or jurisdictions more suited to protecting their wealth.


 Open access