


Introduction
Changes in ice-sheet thickness with time have been inferred from aircraft (Reference Thomas, Abdalati, Frederick, Krabill, Manizade and SteffenThomas and others 2003; Reference AbdalatiAbdalati and others, 2004) and from satellite data (e.g. Reference Davis, Kluever and HainesDavis and others 1998; Reference Zwally, Brenner and DiMarzioZwally and others, 1998, Reference Zwally2005). Two key issues arise when attempting to determine mass-balance change from remote-sensing platforms. Firstly, satellite radar altimeter (SRA) measurements of ice-cap elevation change are dependent on correct identification of snow surfaces, which may be ambiguous owing to strong internal reflections in the near-surface snow and firn, known as ‘volume backscatter’ (Reference Ridley and PartingtonRidley and Partington, 1988; Reference Davis and MooreDavis and Moore, 1993). Secondly, remote-sensing techniques which measure elevation change over large ice masses need to account for temporal and spatial changes in near-surface density if they are to be successfully used to estimate ice volume change (e.g. Reference Braithwaite, Laternser and PfefferBraithwaite and others, 1994).
Changes in the shape of radar power returns from ice sheets are strongly linked to structural and/or density changes in the near-surface snowpack associated with melting (Reference Jezek, Gogineni and ShanablehJezek and others, 1994). If predictions of high-latitude warming (e.g. Reference HoughtonHoughton and others, 2001) are correct, it is likely that dry snow zones will shrink due to the gradually increasing elevations of the upper boundaries of all the zones between the rising equilibrium line and the dry snow zone. Quantification of spatial and temporal variability in the near-surface stratigraphy of ice sheets is thus of interest from a mass-balance perspective, but in addition is vital to assist in identification of where and when volume backscatter may adversely affect SRA measurements of elevation change across an ice mass. Volume backscatter is a particular concern in the percolation facies, which covers in excess of one-third of the Greenland ice sheet (Reference Nghiem, Steffen, Neumann and R. HuffNghiem and others 2005), owing to extensive melt-derived ice layers and lenses in the near-surface stratigraphy (e.g. Reference BensonThomas and others, 2001; Reference Scott, Mair, Nienow, Parry and MorrisScott and others, 2006).
Interpretation of ice mass volume change from SRA measurements requires accurate estimation of the proportion of elevation change attributable to firn densification. Near-surface firn densification has been shown to be largely controlled by the formation of ice layers and denser firn from refreezing of meltwater (Reference Braithwaite, Laternser and PfefferBraithwaite and others, 1994; Reference Reeh, Fisher, Koerner and H.B. ClausenReeh and others, 2005). It has been documented that a slight change in annual melt can have a significant impact on firn density profiles and therefore surface elevation change, even if accumulation remains constant (Reference Braithwaite, Laternser and PfefferBraithwaite and others, 1994). Existing firn densification models adopt a simple temperature-driven positive-degree-day approach (e.g. Reference Reeh, Fisher, Koerner and H.B. ClausenReeh and others, 2005; Reference Li, Zwally and ComisoLi and others, 2007). It is therefore vital that the relationship between air temperature and firn densification (particularly near-surface ice-layer formation) is fully explored if such models are to be applied in varying spatial and temporal contexts.
Recent studies of snowpack variability tend to focus on small spatial areas (e.g. Reference Harper and BradfordHarper and Bradford, 2003; Reference ParryParry and others, 2007). There is a need to extend studies of spatial variability in snowpack density over a range of snow facies, and during more than one melt season, since annual melt timing, duration and intensity across High Arctic ice caps can vary substantially (e.g. Reference Wang, Sharp, Rivard, Marshall and BurgessWang and others, 2005).
In this paper, we present data from a transect across a High Arctic ice cap which spans several snow facies, in order to:
-
1. Quantify seasonal densification across a range of snow facies on a High Arctic ice cap, to highlight levels of spatial variability and assess the role of air temperature as a first-order control.
-
2. Determine the structure and stratigraphic distribution of densification in the snowpack, which will highlight areas of the ice cap where intense volume scatter from near-surface ice layers, lenses and pipes may result in ambiguous surface returns.
Field Site and Methods
Field site
Devon Ice Cap is situated on the eastern end of Devon Island, in the southeastern Queen Elizabeth Islands, Nunavut, Canada, where it covers an area of some 14 400km2 (Fig. 1). Previous studies on this ice cap have highlighted the importance and complexity of refreezing processes on surface mass balance (e.g. Reference KoernerKoerner, 1970a, Reference Koernerb, Reference Koerner1977, Reference Koerner1997) and an overall mass budget controlled mainly by changes in surface mass balance (Reference Koerner, Williams and FerrignoKoerner, 2002; Reference Mair, Burgess and SharpMair and others, 2005). Repeat airborne laser surveys conducted in 1995 and 2000 across the ice caps of the Canadian Arctic Archipelago (including Devon Ice Cap) revealed a common pattern of thinning in marginal areas, accompanied by little change or slight thickening of the ice masses in high-elevation areas (Reference AbdalatiAbdalati and others 2004). Regional relationships between elevation and elevation change, and comparison with in situ data dating back to the 1960s from across many of the ice caps of the Queen Elizabeth Islands indicate that the mass balance between 1995 and 2000 was more negative than observed over the last two or three decades. The changes in elevation are thought to be strongly melt-driven (Reference AbdalatiAbdalati and others, 2004).

Fig. 1. Devon Ice Cap and CryoSat reference orbit track 12 transect showing nested grid sites 1–4.
The present study focuses on a ~47 km long transect (CryoSat reference orbit track 12) which spans several snow facies from near the summit at 1800ma.s.l. to a south-southwest land-terminating margin at ~400ma.s.l. (Fig. 1). This drainage basin is dynamically stable, with a slightly positive mass balance (Reference Burgess and SharpBurgess and Sharp, 2004; Reference Mair, Burgess and SharpMair and others, 2005).
Field methods
Detailed stratigraphic logging of the physical properties of the snowpack was undertaken in spring and autumn 2004 and repeated in spring and summer/autumn 2006, in order to record snowpack variability prior to and after summer melting. An earlier second field season in 2006 coincided with a period of strong surface melting, giving an insight into summer snowpack evolution and its controlling processes.
Meteorological data
Three automatic weather stations (AWS) were set up in spring 2004 at nested grid sites 1–3 along the transect (Fig. 1). Combined with 15 HOBOTM temperature data loggers, spaced approximately every 3 km, these measured temporal and spatial variation in air temperatures along the transect.
Snow pits
Snow pits were dug to the previous end-of-summer layer. This was identifiable in spring by a ~10 cm depth hoar immediately overlying a distinctive hard crust of coarse-grained freeze–thaw ice or firn. Late summer and autumn is when most depth hoar forms, making it a useful end-of-summer marker horizon (e.g. Reference Steffen, Abdalati and SherjalSteffen and others, 1999). In autumn, care was taken to ensure that these layers were relocated by careful re-examination of the snowpack. Snow-pit stratigraphy, density, grain size, grain type, hardness and temperature were logged on north-facing pit walls. Density measurements involved weighing a sample of known volume (100cm3) from each stratigraphic layer. Reference Harper and BradfordHarper and Bradford (2003) found that measurement errors associated with this type of density sampling were ~10%. In spring seasons, pits were dug at 1 km intervals along the full length of the transect. In autumn seasons, pits were dug as far along the length of the transect as was possible owing to snowpack removal, saturation, or time constraints of digging pits dominated by thick (>~10 cm) ice layers at lower elevations. The August 2006 field data are referred to as ‘late-summer’ rather than ‘autumn’; a reminder that the snowpack was still wet for much of the field season. Refreezing began towards the end of the field season (31 August 2006). A few snow pits were backlit in both spring and autumn seasons, following the method of Reference Koerner and CraryKoerner (1971), to reveal fine-resolution horizontal and vertical features in the snowpack at the 10–2–10–3m scale, which are otherwise not obvious.
Dye-tracing experiments
Dye tracing was carried out to identify controls on meltwater routing, ice-layer formation and changes in the physical properties of the snowpack as a result of melting. A concentrated solution of Rhodamine WT liquid dye was sprayed as a thin mist onto 1 m2 patches on the snowpack surface in spring 2006 at sites 1–3. Dye patches were excavated in late summer 2006. The stained snow pits were photographed and logged.
Results
Meteorological conditions in the measured periods of 2004 and 2006
The summer months of 2004 and 2006 exhibited very different melt conditions. Average summer temperatures were 2–3˚C higher in 2006 than in 2004 (Fig. 2). Reference Wang, Sharp, Rivard, Marshall and BurgessWang and others (2005) documented that Devon Ice Cap experienced low melt in summer 2004. In contrast, US National Centers for Environmental Prediction (NCEP) re-analysis data indicate that August 2006 was the warmest August in 33 years. Temperature data from the upper accumulation area of the CryoSat transect (HOBO logger at 1636ma.s.l.) show that during 2004 there were no positive degree days at this elevation, and periods of cold summer temperatures (e.g. –12˚C on Julian day (JD) 196), whilst in 2006 there were sustained periods where temperatures exceeded 0˚C at the same high-elevation site (Fig. 3).
Fig. 2. Average summer air temperatures plotted against elevation, from HOBO loggers along the length of the CryoSat line in 2004 (squares) and 2006 (black triangles).
Fig. 3. Daily average air temperatures from a HOBO logger in the upper reaches of the CryoSat transect (1636ma.s.l.) between 1 June (JD 153) and mid- to late August in 2004 and 2006. The record is truncated at 11 August (JD 224) in 2006 and 31 August in 2004.
Examination of Envisat advanced synthetic aperture radar (ASAR) Global Monitoring Mode (GMM) imagery for summer 2004 and 2006 shows a progression of melt across Devon Ice Cap, indicating profound differences in melt timing and geographical extent between and within these two summer seasons. Dark surface returns (indicative of surface moisture) show that in 2004 the first melt event which affected much of the ice cap, including the CryoSat transect region, occurred on 6–9 July (JD 188–191). Another widespread melt event was evident on 21 July, lasting a few days. A melt event around 20 August 2004 affected the lower CryoSat line area, but was predominantly confined to the southeast corner of the ice cap. In contrast, dark surface returns from the Envisat imagery indicate that widespread summer melt in 2006 commenced on 29 June (JD 179), over a week earlier than in 2004. This was followed by other melt events in early to mid-July. Beyond 22 July (JD 203), very dark surface returns indicate heavy and sustained melting across almost the entire ice cap until 25 August (JD 237), when melt became confined to the southeast corner of Devon Ice Cap once again.
In summary, summer 2004 was cool, characterized by short, intermittent melt events with cold periods in between. Summer 2006 melting began earlier and finished later, with the most notable difference being the sustained late-summer warmth throughout late July and August.
Seasonal variability in annual snowpack depth, accumulation and bulk density
Measured spring snowpack accumulation (Fig. 4a and b), depth (Fig. 5a and b) and average density (Fig. 6a and b) were similar in 2004 and 2006. In both 2004 and 2006, spring snow-pit depth was variable along the length of the transect. This variability was not related to elevation. Mid-transect snow pits (km 12–34) had the highest variability in winter accumulation (Fig. 4a and b), in 2004 ranging from 26.4 cmw.e. at 1259 ma.s.l. to 11.2 cmw.e. at 1328 ma.s.l., and in 2006 ranging from 31.6 cmw.e. at 1290ma.s.l. to 9.57 cmw.e. at 1236 ma.s.l. The average bulk density of the annual snowpack along the transect in spring 2004 and 2006 was ~300–350 kgm–3 (Fig. 6a and b).
Fig. 4. Spring and autumn accumulation plotted against elevation, from snow-pit measurements along the length of the CryoSat line for (a) 2004 and (b) 2006.
Fig. 5. Spring and autumn snowpack height above previous summer layer, plotted against surface elevation for (a) 2004 and (b) 2006, along the CryoSat transect.
Fig. 6. Average bulk density of snowpack in (a) spring and autumn 2004 and (b) spring and late summer 2006, and associated percentage density change over summer along the length of the CryoSat line.
By autumn 2004, snow depth and accumulation had increased at all sites. The summer increase in accumulation was lower at lower elevations. The late-summer accumulation pattern in 2006 (Fig. 4b) was very different to that in 2004 (Fig. 4a). Above 1290 ma.s.l. (km 22.6) the snowpack gained mass during the summer. Below this, there was a rapid drop in accumulation. Between 1259 and 1201 ma.s.l. (km 23.6 and km 26.8), the snowpack was saturated from the bottom up, with water observed to gradually seep upwards at the bottom of the snow pit, indicating that the subsurface water table lay below the 2006 annual snowpack. Where a topographic gradient allowed, this zone of saturation reached the surface as either a supraglacial stream or lake (Fig. 7). At 1194ma.s.l. (km 27.9) the snowpack was completely removed and replaced by a supraglacial lake.
Fig. 7. Surface runoff (fed by a perched runoff horizon) near km 23.6 in mid-August 2006.
In 2004, average bulk densities of the annual snowpack generally increased as elevation decreased (Fig. 6a) and temperature increased (Fig. 8). In 2006 the pattern was different, with average densities generally decreasing as elevation decreased (Fig. 6b) and temperature increased (Fig. 8).
Fig. 8. Relationship between percentage increase in density and average summer air temperature in 2004 and 2006 from snow pits dug within 1 m of a HOBO logger along transect. Snowpack removal and saturation at lower elevations (higher average temperatures) limits the amount of data available in 2006.
Seasonal variations in stratigraphic depth–density structure of the snowpack
The spring snowpack density profiles show little variability across upper and mid- to lower elevations (Figs 9 and 10). A low-density hoar layer was traced the full length of the transect in both years. In 2004 (Fig. 9), ice layers formed immediately above the hoar, after a short-lived autumn melt event which followed heavy snowfall (29 August 2003) identified from QuikSCAT data (personal communication from Reference Wang, Sharp, Rivard, Marshall and BurgessL. Wang, 2005). The melt event was detected across the entire ice cap.
Fig. 9. Kilometre-scale density variability in the annual snowpack from selected snow pits along the CryoSat line in 2004.
Fig. 10. Kilometre-scale density variability in the annual snowpack from selected snow pits along the CryoSat line in 2006.
Autumn/late-summer snowpack density structures were more variable than in spring in both 2004 and 2006. In 2004, ice layers formed at all sites, ranging from three or four fairly thin (0.2–2cm thick) layers near the snow surface at higher elevations, to thicker (up to 13 cm at 1021 ma.s.l.) and generally more numerous ice layers throughout the snowpack at mid- to lower elevations (maximum of 14 at 1259ma.s.l. (~km23.6); Fig. 9). Only at 1259ma.s.l. and below did ice-layer formation and significant densification occur at the very bottom of the annual snowpack (Fig. 9).
In 2006, late-summer snow pits were logged only as low as 1290ma.s.l. (km 22.6) owing to saturated conditions in mid-reaches of the transect. Unlike 2004, the most complex snowpack stratigraphies were observed near the summit of the ice cap (1768–1676ma.s.l.; Fig. 10). At 1502ma.s.l. (km 13.7) the hoar layer had increased in density (from 230 kgm–3 to 380 kgm–3), and at 1290 ma.s.l. (km 22.6) the snowpack had become very uniform in density, with little ice (Fig. 10).
Thus, in 2004, increased snowpack densification with decreasing elevation was dominated by ice-layer formation (Fig. 11), whereas in 2006 ice-layer contribution to annual accumulation decreased with decreasing elevation.
Fig. 11. Percentage of the total water equivalent of the annual snowpack from ice layers in autumn (a) 2004 and (b) 2006.
The depth distribution of ice layers in the annual snow-pack in both summers showed no clear relationship with elevation. However, in 2004 at the highest elevations, (1768 and 1676 m.a.s.l.) there was little ice in the lower 40% of the snowpack (Fig. 12a). In 2006, ice layers were spread across the full depth of the snowpack in the highest snow pit, but on moving down the transect they became more concentrated in the upper 60% (Fig. 12b).
Fig. 12. Depth distribution of ice layers in the annual snowpack at a range of elevations in (a) 2004 and (b) 2006.
Dye tracing
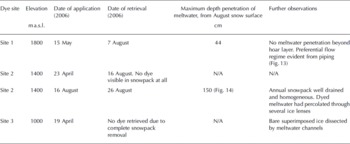
The results of the summer 2006 dye-tracing experiments are summarized in Table 1. At site 1, meltwater reached 44 cm depth and revealed structural controls on ice-layer formation (Fig. 13). At site 2, dye penetrated to 150 cm depth, where meltwater refroze as a thick ice accumulation between 150 and 178 cm (Fig. 14). Several ice layers above appeared stratigraphically intact, but stained snow indicates that meltwater passed through/by them.
Fig. 13. Annotated stratigraphy from dye-tracing experiments at site 1. Dyed snow shows the pathways of summer 2006 melting through the annual snowpack.
Fig. 14. Ice core extracted from S2 dye-tracer experiment in late August 2006. The annual snowpack (66 cm depth) is fairly homogeneous, with the exception of three relic ice lenses which have allowed meltwater to pass through them into the previous year’s firn. A zone of saturation is evident above a large ice accumulation at 150 cm depth. Pink dye is visible up to the depth of this ice layer.
Table 1. Summary of results of dye-tracing experiments
Controls On Snowpack Variability
Controls on the observed spatial variability can be subdivided into intrinsic controls (existing features in the snowpack which may affect densification during summer melting) and extrinsic controls (e.g. prevailing meteorological conditions, altitude, surface topography).
Intrinsic controls
The depth–density structure of the spring snowpack plays a role in the subsequent meltwater routing and refreezing during summer and autumn. Two features of the spring snowpack are discussed in more detail: (1) the depth-hoar layer and (2) crusts.
Depth-hoar control on meltwater penetration and ice-layer formation
The boundary between the depth-hoar layer and the overlying material is characterized by a sharp change in density and grain size (fine-to-coarse transition). Such a transition at the base of the snowpack plays an important role in delaying or preventing meltwater from percolating beyond the depth of the annual snowpack during low melt flux conditions, such as in the short-lived events of 2004. Several previous studies have highlighted the importance of fine-to-coarse transitions in controlling meltwater movement through snowpacks (Reference Wankiewicz, Colbeck and RayWankiewicz, 1979; Reference Marsh and WooMarsh and Woo, 1984; Reference Jordan and AgrawalJordan, 1995; Reference Pfeffer and HumphreyPfeffer and Humphrey, 1996, Reference Pfeffer and Humphrey1998; Reference Gustafsson, Waldner and StähliGustafsson and others, 2004; Reference Waldner, Schneebeli, Schultze-Zimmermann and FlühlerWaldner and others, 2004). Percolating meltwater infiltrates the fine-grained winter snowpack until it reaches the coarse-grained depth-hoar layer, where the contrasting capillary forces between the fine-grained (high-capillarity) snow and the coarse-grained depth hoar (low capillarity) beneath result in downward flow impedance. A zone of saturation then forms, as meltwater is effectively left ‘hanging’ on the bottom of the overlying finer layer where it may refreeze to form an ice layer (evident in Fig. 13). This explains why there is no summer densification at the bottom of the annual snowpack in 2004 above ~1300ma.s.l. (Fig. 9). The depth hoar prevents further percolation.
Where the depth-hoar layer is breached by percolating meltwater, flow occurs initially as finger flow, rapidly creating a series of pipes (e.g. Fig. 15). When meltwater is introduced to faceted dry snow, metamorphism occurs rapidly and the depth-hoar grains become rounded (Reference ColbeckColbeck, 1989). Where large amounts of meltwater are present, more grains become rounded, growing in size at the expense of smaller grains. A rapid increase in grain size and grain rounding facilitates higher permeabilities (Reference ColbeckColbeck, 1983) until the depth-hoar layer no longer prevents meltwater percolating into previous years’ firn. Capillary retention may then be replaced by gravity-driven matrix flow. The heavy late-July and August 2006 melt conditions overwhelmed capillary forces associated with the depth hoar, which explains why densification (although not necessarily ice-layer formation) was extensive at the bottom of the snow-pack below ~1700ma.s.l. (Fig. 10).
Fig. 15. Backlit snow pit at site 1 in spring 2006. The captured image shows the 2005 firn layer. Excavation of depth-hoar layer revealed extensive piping. This indicates that in 2005 meltwater reached the bottom of the annual snowpack (thus site 1 was verging on saturation in 2005).
Crust control on meltwater penetration and ice-layer formation
A common feature of spring snowpack stratigraphy along the CryoSat transect was the presence of 1–2mm thick crust layers, particularly in the upper fine-grained layers of the snowpack. It is unclear whether these crusts are a product of wind, radiation, former rime layers (fog deposits) or some combination. Reference Das and AlleyDas and Alley (2005) report similar features from stratigraphic studies of an Antarctic snowpack. Qualitative observations from our backlit snow pits (in both spring and autumn seasons) and dye-tracing experiments highlight the role of such crusts in forming discontinuous ice lenses in summer and autumn. On inspection with a hand lens, crusts are very fine-grained, frequently sloping and in places are cross-stratified (Fig. 16). Where percolating meltwater encounters a crust in the snowpack, preferential flow occurs laterally along its length; the water is retained within the crust by strong capillary forces (Reference Das and AlleyDas and Alley, 2005). It may then refreeze to form an ice layer (evident in Figs 13 and 16). The more crusts there are in the near surface, the more meltwater can be absorbed by them and prevented or delayed from further percolation. The newly formed ice layers may then again form a barrier to percolating meltwater where they are laterally continuous. This is a further example of the importance of capillary forces under conditions of low saturation on ice-layer formation, and in delaying the percolation of meltwater to further depths.
Fig. 16. Backlit snow pit showing cross-stratified ice lenses at site 1 (1800ma.s.l.) in early August 2006. Cross-stratification of ice lenses makes them highly discontinuous.
Extrinsic controls
The major extrinsic control on snowpack densification is usually assumed to be surface air temperature (e.g. Reference BensonReeh and others, 2005). The seasonal increase in snowpack density in 2004 is strongly related to both higher average air temperature (Fig. 8) and lower elevation (Fig. 6a). Furthermore, the high-magnitude density contrasts that characterize the snowpack in autumn 2004 suggest that melt was sporadic, with preferential flow dominating water routing, under generally non-saturated conditions; a result of the synoptic-scale climatology at our continental site. During the spring and early summer, due to its high altitude, the accumulation area of Devon Ice Cap is rarely exposed to sustained periods of warm conditions resulting in high surface meltwater fluxes over many days (Fig. 3). Instead, frequent cool periods with little or no melt are only briefly interrupted by short-lived warm spells, reducing levels of saturation (and therefore effective permeability) in the snowpack, which favours a preferential flow regime. Thus spatial patterns of ice-layer formation across the ice cap in a cool summer with only short bursts of melt activity appear to be predictable.
The late-summer snowpack in 2006 was transformed by relatively high air temperatures, causing sustained melting, with temperatures at high elevations averaging above 0˚C for several days at a time in late July and throughout August (Fig. 3). The amount of ice in the annual snowpack decreases with lower elevation (Fig. 6b) and warmer temperatures (Fig. 8). A similar pattern of ice-layer formation was observed along a 40 km transect in the percolation facies of the Greenland ice sheet, where internal ice layers were found to be ‘a more common element of the higher colder sites, where infiltration of summer melt is more limited than at lower warmer sites’ (Reference Pfeffer and HumphreyPfeffer and Humphrey, 1998, p. 85). This pattern is a result of the sustained surface melting which occurred in a ripened snowpack in late July and August, instigating a switch from the early-melt-season preferential flow regime to slower, more uniform matrix percolation later in the melt season. Ice layers which formed early in the 2006 melt season would have initially delayed further percolation, causing saturated conditions immediately above them until broken through. When breakthrough occurred, meltwater would flow rapidly to greater depths in an initially preferential flow regime, where it would refreeze at depth. As this process continued, the snowpack became warmer at depth as the meltwater refroze. Eventually the early-summer formed near-surface ice layers became permeable and matrix flow ensued to depth. The late-summer 2006 melting did not generally therefore create any new ice layers in the near-surface snowpack (except at the highest elevations), instead creating a very homogeneous near-surface snowpack, and a thick ice accumulation at depth (Fig. 14).
There is a common assumption in snow stratigraphy studies that the number of ice layers in any one balance year’s accumulation above the firn line is a direct association of the amount of melting during the summer months. Reference KoernerKoerner (1970a) addressed this issue, suggesting that in fact the relationship between the two is far from straightforward, mostly owing to the variability in melt timing and the associated thermal properties of the snowpack at melt onset. Reference KoernerKoerner (1970a) illustrates this in an example of 1962 summer melting on Devon Ice Cap, when early melting in June of that year produced several pipes and ice layers throughout the depth range of the annual snowpack (0.3– 1.2 m), whereas matrix percolation was only observed to reach a few centimetres depth. Further melt in July and August 1962 soaked the annual snowpack but did not lead to the formation of any further ice layers. It seems that a very similar pattern of melt generation, percolation and ice-layer formation is evident in 2006. Melt timing and duration is therefore a very important extrinsic control on ice-layer formation and furthers the notion that snowpack ice-layer formation cannot be simply related to average air temperature alone.
Implications For Mass-Balance Monitoring And Modelling
Results presented here show that simplistic assumptions relating average air temperature to large-scale patterns of densification and ice-layer formation may represent a significant source of uncertainty when modelling melting and refreezing across Arctic snowpacks. Furthermore, accumulation of mass at depths beyond the annual snow-pack due to internal accumulation should be given greater consideration in efforts at modelling High Arctic glacier mass balance. Internal accumulation is widely documented (e.g. Reference AhlmannAhlmann, 1948; Reference BensonBenson, 1962; Reference Trabant and MayoTrabant and Mayo, 1985; Reference Schneider and JanssonSchneider and Jansson, 2004), but it is difficult to quantify its contribution to mass balance since it cannot be measured using traditional techniques (i.e. stake height measurements and snow pits). The consequences of melt percolation and refreezing persist over time since ice layers that develop at depth reduce permeability and therefore affect water movement in future years (e.g. Reference Trabant and MayoTrabant and Mayo, 1985; Reference Pfeffer, Meier and IllangasekarePfeffer and others, 1991).
Where mass was apparently ‘lost’ from the annual snowpack in several snow pits in 2006 (e.g. at and below 1290 ma.s.l. (~km22.6), as Fig. 4b shows) or simply where very little change in snowpack accumulation was observed between the spring and the end of summer (e.g. 1636, 1613, 1353 and 1328ma.s.l.), the dye-tracing results from site 2 indicate that melt is unlikely to have left the ice cap, but instead percolated into previous years’ firn to refreeze as internal accumulation. The late-summer 2006 snowpack remained relatively intact where this occurred (Fig. 14), but became homogenous and highly permeable owing to grain rounding and isothermal temperatures. The snowpack facilitated rapid meltwater percolation to depth, where, upon reaching a cold, impermeable layer, it refroze. Densification was thus more extensive in the layers beneath the annual snowpack than within it, which has implications for firn densification models which assume all the percolating meltwater generated at the surface refreezes in the annual snowpack (e.g. Reference Reeh, Fisher, Koerner and H.B. ClausenReeh and others, 2005). Such an assumption is likely to underestimate densification and surface lowering in summers where sustained matrix percolation soaks firn beneath the annual layer. Therefore, such models should be limited to areas of very low melt activity, where percolation beyond the annual layer is rare, and where perched runoff does not occur. Under a warming climate, saturated conditions could potentially become more widespread, necessitating use of a model which accounts for densification and ice-layer formation at depths beyond those of an annual snowpack.
Internal accumulation also delays or prevents runoff initiation (Reference Trabant and MayoTrabant and Mayo, 1985). The key interface for melt retention and meltwater runoff is known as the ‘runoff limit’ (Reference KasserKasser, 1959). Reference Pfeffer, Meier and IllangasekarePfeffer and others (1991) investigated the potential for a perched runoff surface to shift the runoff limit to a very high elevation and suggested that ‘a workable assumption, is to equate the runoff limit with the percolation-wetted zone boundary’. It can be inferred from the results of dye tracing at site 2, and the observed subsurface runoff immediately downslope of this site, that the thick impermeable ice layer which formed at depth is closely related to runoff generation (Fig. 7). The firn immediately above the ice layer was saturated (Fig. 14), and where the capillary forces could no longer retain the liquid water it follows that runoff would occur along the impermeable ice layer. Runoff was not observed to occur until near km23.7 (1259ma.s.l.). The boundary between the percolation and saturation facies on Devon Ice Cap in 2006 (where ‘saturation facies’ is considered to be where meltwater has wetted the entire depth range of the annual snowpack and densification has occurred at the bottom of the snow pit) was at around km 8 (1676ma.s.l.). Thus whilst the run-off limit assumption of Reference Pfeffer, Meier and IllangasekarePfeffer and others (1991) would result in a considerable overestimation of the runoff limit elevation, stratigraphic observations of the firn core at site 2 (Fig. 14) support the concept of formation of perched runoff horizons. The existence of perched, impermeable flow paths will vary from year to year, requiring a runoff model to consider the past history of melt and accumulation from several years.
Runoff in a saturation zone of a large ice mass where a deep, cold firn pack exists may be entirely dependent on the development of an ice layer formed by refreezing at depth, which is thick enough to remain impermeable, but above which snowpack temperatures are isothermal at 0˚C. Ice-layer permeability is therefore an issue which could be more thoroughly addressed in modelling meltwater percolation.
Implications for SRA-derived Mass-balance Estimates from Elevation Change
As previously stated, the interpretation of ice mass change from SRA measurements requires accurate estimation of the proportion of elevation change attributable to firn densification. Our interpretation of results from the Devon Ice Cap clearly demonstrates that a simple derivation of mass change from elevation change based upon a modelled relationship between snowpack densification and air temperature is not applicable. This is because the relationship between mass change and temperature varies depending on accumulation patterns and the intensity of melting (Reference Braithwaite, Laternser and PfefferBraithwaite and others, 1994), both of which have been shown to exhibit high interannual variability.
A further complication for SRA mass-change interpretation concerns uncertainty about the destination of melt-water contained in supraglacial lakes (Fig. 7). It may appear, from pronounced surface lowering, that mass has been lost (e.g. in 2006 beyond km22.6), when it may have been redistributed via short-lived perched runoff horizons and refrozen at lower elevations. Thus, again, surface lowering cannot be easily equated to mass loss, since processes of lateral redistribution may be significant.
Ice-layer formation in the 2004 snowpack (Fig. 9) produced greater stratigraphic variability in the near surface than in 2006 (Fig. 10). Radar measurements of surface elevation are obfuscated by increased volume backscatter from the near surface where ice layers are abundant (Reference Scott, Mair, Nienow, Parry and MorrisScott and others, 2006). Ground radar measurements, calibrated by snowpack density sampling from the percolation zone on the Greenland ice sheet, showed that the strongest return from the radar is not necessarily from the surface, but often an ice layer some tens of centimetres below the surface (Reference Scott, Mair, Nienow, Parry and MorrisScott and others, 2006). In the cooler summer of 2004, ice layers were abundant near the surface of Devon Ice Cap across the entire accumulation zone, potentially increasing volume backscatter and ‘dragging down’ surface returns (Reference Scott, Mair, Nienow, Parry and MorrisScott and others, 2006). In 2006, there were generally fewer ice lenses in the annual snowpack from which to generate high levels of volume backscatter, and these were restricted to the highest elevations.
Thus, to summarize, for intermittent melt of a cold snowpack the relationship between average air temperature and average snowpack densification is stronger, and near-surface ice-layer formation is extensive. Thus, the uncertainty in determining snowpack densification is smaller; however, the uncertainty in identifying the ice cap surface is higher due to potentially high volume backscatter across the accumulation zone. For sustained melting of a warmed snowpack, the relationship between average air temperatures and average snowpack densification is weaker, and ice-layer formation may occur at greater depth, leaving the annual snowpack relatively ice-free. Thus, the uncertainty in determining snowpack densification is greater, but the uncertainty in accurate surface identification may be reduced.
Although our results and interpretation highlight important controls on patterns of near-surface ice-layer formation over large spatial scales and help identify associated potential areas of high volume backscatter, satellite-radar-generated estimates of surface elevation change will remain ambiguous, in the absence of more sophisticated snowpack modelling and further extensive field validation efforts (Reference ParryParry and others, 2007). Furthermore, following the launch of CryoSat 2, scope for direct intercomparison between in situ and remote observations will provide a means of refining and validating densification modelling.
Conclusions
Seasonal densification across the varying High Arctic icecap snow facies has been quantified over two different years by examining snowpack density properties in spring (premelt) and autumn (post-melt). Spring (pre-melt) snowpack profiles in both 2004 and 2006 show low variability over large spatial scales, with low-magnitude changes in density characterizing the stratigraphy. The end-of-summer/autumn density profiles indicate high variability in both 2004 and 2006, although vastly different synoptic conditions generated dissimilar patterns of melting and associated ice-layer formation over the two summers. The relatively cool summer of 2004 generated an annual snowpack characterized by sporadic melt features creating discontinuous ice layers, high-magnitude inter-stratigraphic density contrasts in the near-surface snowpack and very high spatial variability owing to increasing dominance of ice layers towards lower elevations.
In contrast, the sustained warm late-summer meteorological conditions of 2006 produced a very different near-surface snowpack. Strong melting conditions meant a lesser role for intrinsic controls on snowpack variability as saturated conditions ensued. As melting progressed, density structure was lost, creating a more homogeneous annual snowpack, with ice-layer contribution to annual accumulation falling with decreasing elevation and warmer temperatures. Such a reduction in the amount of ice retained in the annual snowpack is shown to be the result of percolation and refreezing at depths below the annual layer. During early-summer melt events and/or short melt events which follow cold periods, the vertical and horizontal routing of meltwater flow within and below the annual snowpack is shown to be strongly affected by the pre-existing, often subtle stratigraphic interfaces in the snowpack, rather than its bulk properties. This is largely a result of capillary action in conditions of low saturation.
In summers where melt occurs early in the summer when the snowpack is cold, or in sporadic bursts with cold periods dominating in between (2004 on Devon Ice Cap), the high fraction of ice retained in the annual snowpack as multiple ice layers and lenses is likely to create high volume-backscatter returns from satellite radar altimeter measurements, potentially hindering identification of the true surface of the ice mass. This is particularly the case in mid-reaches of the transect where ice-layer formation is shown to be extensive. During summers with spatially extensive and prolonged melting (especially near the end of the melt season when the snowpack is warm, such as in 2006), homogenization of near-surface density could reduce this source of uncertainty in identifying the ice-cap surface. Such interannual variability suggests that using a simple relationship between air temperature, elevation and snowpack densification to derive mass change from measurements of elevation change across High Arctic ice caps may be misguided.
Modelling efforts should take into account the findings in this and other work which identify the importance of densification below the annual snowpack, and the complexity of controls on snowpack refreezing, particularly with respect to using temperature simply as a control on the amount of ice formed in the snowpack. The relationship between air temperature and snowpack densification is not straightforward and not transferable from one year to the next.
Acknowledgements
This paper is a contribution to the validation of the European Space Agency CryoSat mission. C.B., D.M. and R.B. were funded by the UK Natural Environment Research Council through grant NER/O/S/2003/00620. M.S. was supported by the Natural Sciences and Engineering Research Council, Canada, and the Meteorological Service of Canada (CRYSYS programme), and D.B. was supported by grants from the Canadian Circumpolar Institute and the Northern Scientific Training Program (Department of Indian and Northern Affairs Canada). M.D. was funded by a grant from the Canadian Space Agency GRIP Program. We thank J. Box and R. Koerner for valuable comments which greatly improved the manuscript. In situ data collection was supported by the Polar Continental Shelf Project (an agency of Natural Resources Canada). We also thank the Nunavut Research Institute and the communities of Resolute Bay and Grise Fjord for permission to conduct fieldwork on Devon Ice Cap. We acknowledge field assistance from S. Williamson, A. Gardner, L. Colgan, J. Davis, B. Danielson, J. Sekerka, L. Gray and J. Zheng.


