Studies show that the consumption of processed foods has been increasing(1, 2) and many processed foods contain trans-fat(Reference Albers, Harnack and Steffen3–Reference Richter, Shawish and Scheeder8). Because of the negative impact of trans-fat on human health(Reference Mozaffarian, Aro and Willett9–Reference Remig, Franklin and Kostas15), in 2004 the WHO launched the Global Strategy on Diet, Physical Activity and Health and one of its goals is to eliminate trans-fat from the diet(16–Reference L'Abbe, Stender and Skeaff20).
Since 2003, Brazilian Resolution 360(21) has required food manufacturers to report the trans-fat content per serving on the nutrition facts label. Recommended serving sizes were established by Resolution 359(22), published in the same year. The said Resolution defined the serving size to be the average amount of food that should be consumed by healthy people aged 36 months or older to promote a healthy diet.
According to Resolution 360, companies may make claims of ‘zero trans’ or ‘trans free’ on the packaging if the amount of trans-fat per serving is ≤0·2 g, an amount considered insignificant by the Resolution(21). Hence, when the amount of trans-fat is ≤0·2 g per serving, a company does not need to inform the product's trans-fat content on the nutrition facts label, so it is impossible to know the trans-fat content of products that use ingredients with trans-fat.
Studies that analysed the nutrition facts label on the packaging of food products sold in supermarkets have found that the information provided on the label is not always clear and reliable. They also emphasized the need for legislation that enables consumers to make healthier food choices and for labels that help to educate consumers(Reference Walker, Woods and Rickard23–Reference Bialkova and Trijp26).
In this context, the objective of the present study was to investigate how trans-fat is reported on the packaging of food products sold in a Brazilian supermarket.
Methods
Data collection
The current descriptive, cross-sectional study analysed the packaging of all processed food products sold in a randomly chosen supermarket in the city of Florianópolis, located in the southern region of Brazil. This supermarket belongs to a large supermarket chain with twenty-one stores in the southern region of Brazil, six of which are located in Florianópolis. The products sold in these stores are similar to those sold in other large supermarket chains throughout the country.
Fresh foods, such as meats, vegetables and fruits, are not subject to the Brazilian legislation on labels, so they were excluded from the study. Products without added fat in their composition, such as flours and rice, were also excluded. Classification was based on the ingredients reported on the packaging and their definition by the Brazilian food legislation.
A previously tested form was used for collecting the information reported on the packaging, such as product identity (product, commercial name, flavour, brand) and information on trans-fat (presence of components containing trans-fat in the ingredient list, presence of the item ‘trans fat’ on the nutrition facts label, amount of trans-fat per serving on the nutrition facts label, claims of ‘no trans fat’ on the packaging).
The information on the packaging of identical products of different sizes was recorded separately because their list of ingredients also differed.
Data were collected in May 2010 by trained dietitians. The management of the supermarket allowed the research.
Data analysis
The collected data were input into two separate databases which were later checked for possible errors and validated.
Three indicators were used for determining the presence trans-fat in the product: (i) the ingredient list; (ii) the amount of trans-fat reported on the nutrition facts label; and (iii) claims of no trans-fat on the packaging. With regard to the ingredient list, trans-fat was considered present when the list contained any type of hydrogenated fat/oil or any ingredient that chemically corresponds to hydrogenated fat, such as margarine or vegetable fat/cream(27). ‘Vegetable cream’ and ‘vegetable fat’ probably contain trans-fat because they are common in products with trans-fat(27). Also, the nutrition facts label was analysed with the consumer in mind, since consumers may not know whether the fats listed in the ingredient list are hydrogenated if incomplete terms are used; for example, when ‘vegetable fat’ is reported in place of ‘hydrogenated vegetable fat’. The use of full ingredient names by the food industry should be mandatory, such as ‘hydrogenated vegetable fat’, which contains trans-fat, or ‘palm vegetable fat’, which does not contain trans-fat. Food companies should also be required to report and highlight the presence of trans-fat on the label.
Claims of no trans-fat were considered present when they were highlighted on the front of the packaging, regardless of wording.
The food products were divided into six groups according to Brazilian Resolution 359(22): Group A = bakery products, grains and grain-based products; Group B = dairy; Group C = meat-based products; Group D = oils, fats and processed nuts; Group E = sugars, sugary foods and snacks (the Resolution refers to these foods as those whose energy comes mostly from carbohydrates and fats, such cakes, cookies, ice cream, candy and chocolate, among others); and Group F = sauces, seasoning blends, stock cubes, dry soups and refrigerated/frozen dinners.
The kappa statistic was used for analysing the agreement among items containing trans-fat in the ingredient list (considered the gold standard for the current study), the amount of trans-fat reported on the nutrition facts label and claims of no trans-fat on the packaging. Agreement was considered very low when κ = 0·00–0·20; low when κ = 0·21–0·40; moderate when κ = 0·41–0·60; high when κ = 0·61–0·80; and very high when κ = 0·81–1·00. The positive (PPV) and negative predictive values (NPV) were also calculated. The statistical software package Stata version 11·0 was used for the statistical analyses.
Results
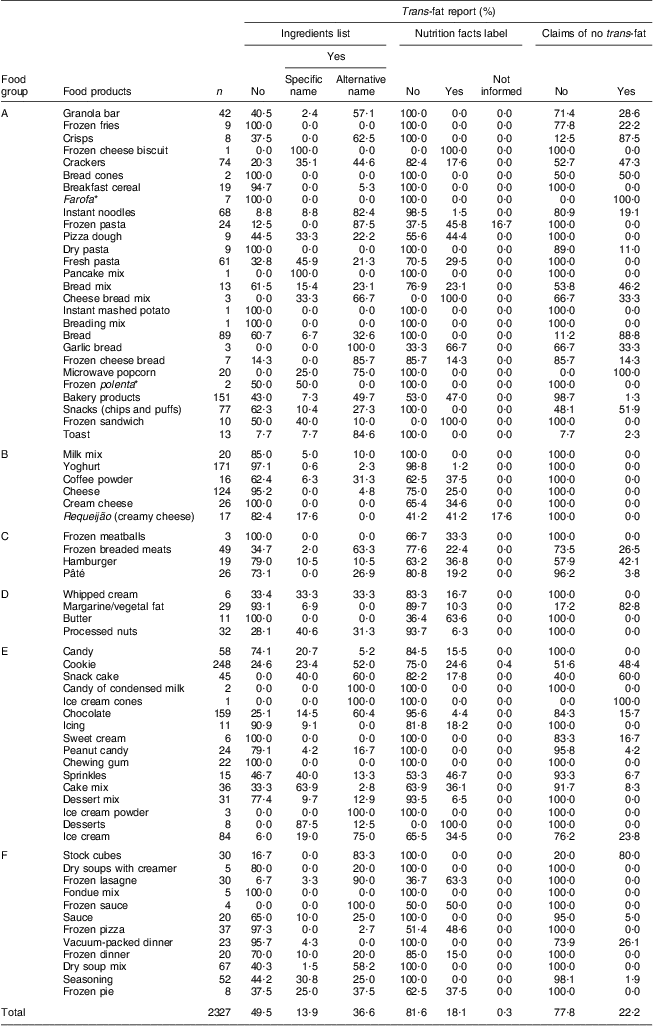
A total of 2327 food products were analysed; of these, 50·5 % (n 1175) reported one or more components containing trans-fat in the ingredient list. There were 1318 citations of ingredients with trans-fat in these 1175 products (Table 1). In 25·4 %, specific names with the word ‘hydrogenated’ were used for items containing trans-fat, and in 74·6 %, alternative names were used. Most of the ingredients containing trans-fat were listed specifically as ‘hydrogenated vegetable fat’ (91·0 % of the specific names), ‘vegetable fat’ and ‘margarine’ (78·4 % and 18·0 % of the alternative names, respectively). Other specific names used for trans-fat-containing ingredients per product group were ‘hydrogenated vegetable oil’ and ‘liquid and hydrogenated vegetable oil’ for Group D (oils, fats and processed nuts) and ‘partially hydrogenated soyabean fat’ for Group F (sauces, seasoning blends, stock cubes, dry soups and refrigerated/frozen meals), representing respectively 5·9 and 11·8 % (Group D) and 8·0 % (Group F) of the components with trans-fat in the ingredient list. Other alternative names were also frequent, such as ‘milk mix’, especially for Group B (dairy products).
Names used and number/percentage of citations of components with trans-fat in the ingredient list, stratified by food group: processed food products (n 2327) available in a large supermarket in Florianópolis, Brazil, May 2010

Food groups: Group A = bakery products, grains and grain-based products; Group B = dairy; Group C = meat-based products; Group D = oils, fats and processed nuts; Group E = sugars, sugary foods and snacks; Group F = sauces, seasoning blends, stock cubes, dry soups and refrigerated/frozen dishes.
Considering all study products (n 2327), the groups with the highest percentage of products containing trans-fat (one or more ingredients) were Group E (sugars, sugary foods and snacks) and Group A (bakery products, grains and grain-based products), with 66·9 % and 58·8 %, respectively. These percentages were slightly lower in Group F (refrigerated/frozen dishes; 49·8 %), Group C (meat-based products; 44·3 %) and Group D (oils, fats and processed nuts; 37·2 %). Group B (dairy products) contained the lowest percentage of products with trans-fat (6·2 %).
In descending order, the groups with the highest percentages of alternative names for trans-fat-containing ingredients (one or more components) were Group C (meat-based products; 93·0 %), Group F (refrigerated/frozen dishes; 83·3 %), Group A (breads and grains; 75·4 %), Group B (dairy products; 73·9 %), Group E (sugars, sugary foods and snacks; 66·7 %) and Group D (oils, fats and processed nuts; 41·4 %).
Meanwhile, only 18·1 % of the food products reported actual the trans-fat content on the nutrition facts label and 22·2 % of the food products claimed to have no trans-fat on the front of the packaging. A very small percentage (0·3 %) of food products did not contain any information on trans-fat (Table 2). These products were in Group A (breads and grains, specifically frozen pasta), Group B (dairy, specifically cream cheese) and Group E (sugars, sugary foods and snacks, specifically cookies).
Number of study products and percentage of products listing items with trans-fat in the ingredient list, with trans-fat listed on the nutrition facts label and with claims of no trans-fat on the packaging, stratified by food group: processed food products (n 2327) available in a large supermarket in Florianópolis, Brazil, May 2010
Food groups: Group A = bakery products, grains and grain-based products; Group B = dairy; Group C = meat-based products; Group D = oils, fats and processed nuts; Group E = sugars, sugary foods and snacks; Group F = sauces, seasoning blends, stock cubes, dry soups and refrigerated/frozen dishes.
*Farofa is a toasted manioc flour mixture but maize flour is used sometimes and flavours vary. Polenta is boiled cornmeal that can be eaten puréed or shaped into sticks and fried.
Table 2 shows the number of study products by food group and the respective percentages of products that reported ingredients containing trans-fat in the ingredient list, trans-fat on the nutrition facts label and claims of no trans-fat on the front of the packaging.
Figure 1 shows the percentage of products that reported trans-fat on the nutrition facts label and that made claims of no trans-fat on the packaging, by food group, and the agreement between these data and the ingredient list.
Percentage of products reporting trans-fat on the nutrition facts label and making claims of no trans-fat on the packaging and agreement of these data with the ingredient list, stratified by food group: processed food products (n 2327) available in a large supermarket in Florianópolis, Brazil, May 2010. ![]() , with trans-fat;
, with trans-fat; ![]() ,
, ![]() , without trans-fat (
, without trans-fat (![]() , true negatives;
, true negatives; ![]() , false negatives). Food groups: Group A = bakery products, grains and grain-based products; Group B = dairy; Group C = meat-based products; Group D = oils, fats and processed nuts; Group E = sugars, sugary foods and snacks; Group F = sauces, seasoning blends, stock cubes, dry soups and refrigerated/frozen dishes
, false negatives). Food groups: Group A = bakery products, grains and grain-based products; Group B = dairy; Group C = meat-based products; Group D = oils, fats and processed nuts; Group E = sugars, sugary foods and snacks; Group F = sauces, seasoning blends, stock cubes, dry soups and refrigerated/frozen dishes
For nearly all food groups, the percentage of false negatives (products that reported zero trans-fat on the nutrition facts label or made claims of no trans-fat on the packaging but contained items with trans-fat in the ingredient list) varied from 40 to 60 %. False negatives were low only for dairy products that did not list trans-fat on the nutrition facts label and non-existent for products in the dairy group and group of oils and fats that made no trans-fat claims on the packaging.
Table 3 shows the agreement among the presence of ingredients containing trans-fat, the trans-fat content reported on the nutrition facts label and claims of no trans-fat on the packaging.
Agreement among the presence of trans-fat-containing items in the ingredient list, trans-fat reported on the nutrition facts label and claims of no trans-fat on the packaging, stratified by food group: processed food products (n 2327) available in a large supermarket in Florianópolis, Brazil, May 2010
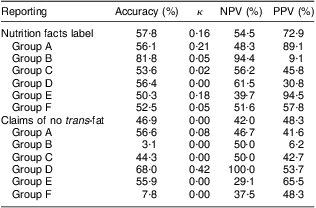
NPV, negative predictive value; PPV, positive predictive value.
Food groups: Group A = bakery products, grains and grain-based products; Group B = dairy; Group C = meat-based products; Group D = oils, fats and processed nuts; Group E = sugars, sugary foods and snacks; Group F = sauces, seasoning blends, stock cubes, dry soups and refrigerated/frozen dishes.
The amount of trans-fat (zero or otherwise) reported on the nutrition facts label presented very low agreement (κ = 0·16) with listed ingredients containing trans-fat. The lowest κ values were found for the products of Group B (dairy products), Group C (meat-based products), Group D (oils, fats and processed nuts) and Group F (refrigerated/frozen dishes). Low κ values were a consequence of low nutrition information accuracy, as well as of the low predictive value of this information, which was worse for products that did not list trans-fat on the nutrition facts label (NPV = 54·5 %) than for those that did (PPV = 72·9 %). Although the nutrition information of dairy products (Group B) was very limited, this information was more reliable for identifying products without trans-fat (NPV = 94·4 %) than that reported in breads and grains (Group A) and sugary foods and snacks (Group E), whose better κ values than those of the other groups showed the lowest NPV (<50 % in both cases). There was no agreement between claims of no trans-fat (κ = 0·00) and NPV (42·0 %). These agreements varied little among the different food groups. Only in Group D (oils, fats and processed nuts) was this information reliable for accurately identifying products with no trans-fat in the ingredient list.
Discussion
The present analysis showed that half of the study food products had trans-fat-containing components in the ingredient list; in 75 % of these products, these ingredients were listed with alternative names. This shows that there are numerous and varied food products containing trans-fat in Brazilian supermarkets and that most of them list trans-fat-containing ingredients with alternative names. This may mislead consumers and allow them to make bad food choices.
These findings are concerning because trans-fat is harmful to the body, especially with respect to the development of dyslipidaemia and CVD(Reference Hunter, Zhang and Kris-Etherton14, Reference Remig, Franklin and Kostas15). Hence, the legislation on food labels must establish and impose the use of standard names for oils and fats, since the use of alternative names may prevent consumers from detecting the presence of trans-fat in processed foods and thereby prevent them from eliminating this type of fat from their diet, as recommended by the WHO(16).
The groups that were most likely to have trans-fat-containing components in their list of ingredients were the sugar, sugary foods and snacks group, especially cookies, sweets and ice cream; the bread and grains group, especially instant and frozen noodles; and the refrigerated/frozen dinner group. Monteiro et al.(Reference Monteiro, Levy and Claro28) called these products ‘ultra-processed foods’, convenience foods that require additional additives and fats to increase palatability and shelf-life.
The presence of these foods in the diet of the Brazilian population has increased; for example, the consumption of cookies and refrigerated/frozen dinners increased by 400 % and 80 %, respectively, between the years of 1974–1975 and 2002–2003(1). In 2008–2009, the relative consumption of refrigerated/frozen dinners and mixes increased by 37 % in comparison with the previous survey(2). In the USA, the Economic Research Service found that added sugars and sweeteners available for consumption increased by 19 % and grains available for consumption increased by 41 % from 1970 to 2005(29).
Trans-fat was not listed on the nutrition facts label of eight (0·3 %) food products. This is not in conformity with the Brazilian legislation which determines that it must be listed, regardless of amount, in all processed food products(21). In a study done between 2007 and 2008, Tao et al.(Reference Tao, Li and Lo25) found that only 30·9 % of the food products available in a Chinese supermarket contained a nutrition facts label and of these, only 4·7 % included trans-fat. Inclusion of a nutrition facts label became compulsory in China in 2008, so 69·1 % of the studied products were in violation of the Chinese legislation. However, trans-fat does not need to be included separately on the nutrition facts label.
A small percentage (18·1 %) of the study products reported an amount of trans-fat other than zero on the nutrition facts label and roughly a quarter of the products made claims of no trans-fat on the packaging, especially those in the bread and grains group and the oil and fats group. In the USA, Brandt et al.(Reference Brandt, Moss and Ferguson30) found that 12 % of the 1227 study products sold in supermarkets reported having trans-fat, especially those in the breads and grains group. These same authors noticed that more than 75 % of the food products made no trans-fat claims on the packaging, especially granola bars (26 %) and breads and baked goods (20 %). In the USA, companies are still allowed to make claims of no trans-fat on the packaging when the amount of trans-fat in the product is <0·5 g per serving.
Companies’ and the WHO's objectives regarding the provision of trans-fat information on food packaging are likely different(16). It is interesting for companies to emphasize the possible healthiness of a product on its packaging since they know that processed foods have a significant participation in the population's diet(1, 2, 29).
The low agreement between the presence of trans-fat-containing ingredients and zero trans-fat reported on the nutrition facts label and claims of no trans-fat made on the packaging further demonstrates that companies and the WHO indeed have different objectives regarding trans-fat information on food packaging. In the present study, the percentage of false negatives (products that made claims of no trans-fat or reported zero trans-fat on the nutrition facts label but listed trans-fat-containing ingredients) was high, ranging from 40 to 60 % for all except the dairy group.
Milk and meats from ruminants may contain trans-fat naturally because of the biohydrogenation process that occurs in the rumen but this does not mean that these products are necessarily free from man-made trans-fat(Reference Martin, Matshushita and Souza31, Reference Pariza, Park and Cook32). Lambert(Reference Lambert33) reported that natural and man-made trans-fats have different structures and functions and distinct effects on blood lipids: natural trans-fat is beneficial to health(Reference Mougios, Matsakas and Petridou34–Reference Agueda, Ángeles and Martínez38) while man-made trans-fat is not. In the present study, none of the dairy products made claims of no trans-fat on the packaging. Since these products may contain natural trans-fat, it would not be correct to make such claims(Reference Larqué, Salvador and Gil39).
The agreement among the presence of trans-fat-containing ingredients, the amount of trans-fat reported on the nutrition facts label and claims of no trans-fat on the packaging was very low or non-existent, showing that the latter two are not really reliable. In a study of Brazilian food packaging containing claims of no trans-fat, Aued-Pimentel et al.(Reference Aued-Pimentel, Silva and Kus40) found that the claims were inaccurate in 18 % of the products, since they contained 0·3 to 1·8 g of trans-fat per serving.
Howlett et al.(Reference Howlett, Burton and Kozup41) stated that not knowing about trans-fat and poor interpretation of the trans-fat content reported on the nutrition facts label can be misleading and emphasized that consumers need not only to have access to the nutrition facts label and list of ingredients but also must know how to interpret them so that they can effectively find trans-fat-free products.
It is also important to know that trans-fat-free foods are not necessarily healthy. Gagliardi et al.(Reference Gagliardi, Mancini Filho and Santos7) studied food products sold in supermarkets in São Paulo, Brazil, that made claims of no trans-fat on the packaging and found that their trans-fat content was low, but the amount of saturated fats was significant. These authors pointed out that the only reason companies can make claims of no trans-fat on the packaging is because the Brazilian legislation tolerates up to 0·2 g of trans-fat per serving, as mentioned previously.
One possible limitation of the present study is the use of the list of ingredients for determining the presence of trans-fat in a product without running chemical analyses. However, the study considered that consumers only have access to what is reported on the packaging, so its accuracy should be ensured by the manufacturer and tested for compliance with the legislation. Another possible limitation of the study was the inclusion of products sold in a single store, but since the store belongs to a large chain, most of the products sold by this chain are sold by other chains and stores throughout the country, so this fact does not affect the external validity of the study.
The list of ingredients was interpreted taking into account the different names of possible trans-fat-containing ingredients listed in the scientific literature(27), but when vegetable fat is automatically considered hydrogenated, false positives may occur. Finally, according to studies that used chemical analysis to determine the presence of trans-fat in different food products, the results presented here, based exclusively on the list of ingredients, are most likely underestimating the true trans-fat content of these foods. In other words, the percentage of processed foods with trans-fat would be even higher and the reliability of the information on the packaging and nutrition facts label would be lower.
Conclusions
Trans-fat can be reported in Brazilian food products in three different ways: (i) in the ingredient list by reporting ingredients that contain this kind of fat; (ii) on the nutrition facts label by reporting the amount of trans-fat per serving; and (iii) by making claims of no trans-fat on the packaging.
The present study found that the ingredient list usually contradicts the zero trans-fat per serving reported on the nutrition facts label and the claims of no trans-fat made on the packaging. Hence, it is impossible to know if a product contains trans-fat based on the latter two. Even if consumers read the ingredient list, they may still be unable to tell if an ingredient contains trans-fat because of the different ingredient names used by the food industry.
Therefore, the Brazilian legislation on food labels needs to be revised, especially regarding the amount of trans-fat reported per serving on the nutrition facts label and the claims of no trans-fat made on the packaging. Additionally, the names used for listing hydrogenated oils and fats in the ingredient list need standardization. Finally, the relevant governmental agencies must apply constant surveillance of labels to prevent violations.
In order to encourage and give people the means of controlling their trans-fat intake and thereby reduce their susceptibility to chronic diseases, the information on food packaging must be made very clear and free from ambiguity.
Acknowledgements
Sources of funding: This research was supported by the Brazilian National Research Council (CNPq). Conflicts of interest: None of the authors had a conflict of interest. Authors’ contributions: B.M.S. was responsible for the study design, project management, data analysis, interpretation of the results and manuscript writing. D.A.G.-C. was responsible for data analysis and the interpretation of results. R.P.C.P. was responsible for the design of the original study, research coordination, and orientation and revision of the final manuscript.