


1. Introduction
The aerodynamics of low aspect-ratio (AR) wings is fundamentally different from that of two-dimensional (2-D) aerofoils. For example, small unmanned aerial vehicles and micro-air vehicles have high stall angles, improving the manoeuvrability of the aircraft. Indeed, it has been demonstrated that the maximum lift coefficient as well as the stall angle of a low AR wing are greater than those of 2-D aerofoils (Torres & Mueller Reference Torres and Mueller2004; Dong, Choi & Mao Reference Dong, Choi and Mao2020). The flow and vortical structures over low AR wings are also different from those over 2-D aerofoils, where the tip vortex (TV) plays a significant role (Ringuette, Milano & Gharib Reference Ringuette, Milano and Gharib2007; Yilmaz & Rockwell Reference Yilmaz and Rockwell2012; Dong et al. Reference Dong, Choi and Mao2020). Here, the TV is formed due to the pressure difference between two sides of the wing, which accelerates the flow to wrap around the wing tip (Chow, Zilliac & Bradshaw Reference Chow, Zilliac and Bradshaw1997). The TV originates near the leading edge of the wing and grows downstream, generating a suction force that contributes to the lift. The TVs of low AR wings are similar to those of delta wings which also have a high stall angle (LeMay, Batill & Nelson Reference LeMay, Batill and Nelson1990; Visbal Reference Visbal1994).
To clarify the role of the TV in the lift contribution, investigations on the flow structures over low AR wings have been conducted (Yilmaz & Rockwell Reference Yilmaz and Rockwell2012; Carr, Chen & Ringuette Reference Carr, Chen and Ringuette2013; Hartloper & Rival Reference Hartloper and Rival2013; DeVoria & Mohseni Reference DeVoria and Mohseni2017b). For very low AR wings ( $AR < 1.5$), the lift generated is a combination of the spanwise circulation of the leading-edge vortex (LEV) and the suction force of the TV (Mueller & DeLaurier Reference Mueller and DeLaurier2003). Harbig, Sheridan & Thompson (Reference Harbig, Sheridan and Thompson2013) investigated the development of the LEV over low AR wings and observed that the LEV was reduced in size under the effect of the TV. Dong et al. (Reference Dong, Choi and Mao2020) also observed a strong interplay between the TV and LEV over a low AR wing. They demonstrated that the reattachment of leading-edge flow and the subsequent formation of the LEV was due to the induced velocity by the TV, which increased in size and strength with an increase in the angle of attack (AoA).
Investigations into the unsteady aerodynamics of rotating, pitching and plunging wings have been made by engineers, scientists as well as biologists (Dickinson & Gotz Reference Dickinson and Gotz1993; Ellington et al. Reference Ellington, Van Den Berg, Willmott and Thomas1996; Willmott & Ellington Reference Willmott and Ellington1997; Sane Reference Sane2003; Wang Reference Wang2005; Lentink & Dickinson Reference Lentink and Dickinson2009) to better understand the flight of birds and insects. Jones & Babinsky (Reference Jones and Babinsky2010) showed that the peak lift of a rotating wing was 1.5 times greater than that of a steady wing. The lift on a large AR wing was also enhanced by several times by pitching and plunging motions (Gendrich Reference Gendrich1999; Granlund, Ol & Bernal Reference Granlund, Ol and Bernal2013). Yilmaz & Rockwell (Reference Yilmaz and Rockwell2012) and Visbal (Reference Visbal2011) studied the vortical structures over a finite-span pitching wing to demonstrate that the LEV exhibited a spanwise modulation caused by the induced velocity by the TV. The spanwise-modulated LEV resulted in a non-uniform pressure distribution along the span, while the peak suction pressure was located close to the wing tip (Schreck & Hellin Reference Schreck and Hellin1994). Visbal (Reference Visbal2017) showed that the LEV over a pitching wing created a lower pressure, which was maintained until a large AoA. Visbal (Reference Visbal2017) later observed a formation of arc-shaped LEV over a low AR pitching wing. Increasing the pitch rate of a low AR wing shifted the reattachment point of the LEV towards the leading edge, helping delay the stall angle (Coton & Galbraith Reference Coton and Galbraith1999; Hord & Lian Reference Hord and Lian2016). Yu & Bernal (Reference Yu and Bernal2017) examined the aerodynamics of a low AR pitching wing, observing that the formation of the LEV was delayed when the pivot was shifted downstream. This was due to the generation of a starting vortex at the leading edge, which also generated the force spikes at the start and the end of the pitching motion.
Development of vortical structures over low AR pitching wings with rectangular and elliptical planforms was investigated by Yilmaz & Rockwell (Reference Yilmaz and Rockwell2012), showing a strongly 3-D flow with a dominant spanwise vorticity with increasing AoA. Carr et al. (Reference Carr, Chen and Ringuette2013) studied the vortical behaviour over a low AR wing under rotation, where the spanwise vorticity of the LEV was increased with a ‘four-lobed’ velocity distribution. DeVoria & Mohseni (Reference DeVoria and Mohseni2017b) experimentally studied the interplay between the TV and the trailing-edge vortex over low AR wings, showing that the induced velocity of the TV helped maintain the Kutta condition at the trailing edge to sustain the lift until a higher AoA. Visbal (Reference Visbal2017) showed that the breakdown of the TV was delayed with an increase in the pitch rate. He also showed that the TV structure prior to the vortex breakdown was independent of the pitch rate, which was in agreement with the observation of Birch & Lee (Reference Birch and Lee2005). Birch & Lee (Reference Birch and Lee2005), however, pointed out that the strength of the TV was reduced by the pitch-up motion. Taira & Colonius (Reference Taira and Colonius2009) studied the unsteady aerodynamics of low AR wings, concluding that the vortex dynamics and the associated aerodynamic forces were highly influenced by the TV.
Previously, we have studied the interaction between the TV and the LEV over a very low AR wing, where the influence of the TV on the development of the LEV was demonstrated (Dong et al. Reference Dong, Choi and Mao2020). Building on the understanding of the vortex interactions gained from this study, we investigated the effect of the pitching motion on the development of vortical structures over a very low AR wing, by examining the relationship between the vortex behaviour and the aerodynamic forces. Three-dimensional flow fields around the pitching wing were constructed by velocity measurements using high-speed particle image velocimetry (PIV). The development of the TV and LEV at different pitch rates was qualified by carefully documenting their shapes, locations and trajectories as well as vorticity distributions and circulations. The self-similarity of the aerodynamic forces and vortical structures over pitching wings was obtained using phase-lag adjusted AoA. Finally, the behaviour of the LEV during the pitching motion in delaying flow separation was studied in the light of the induced velocity of the TV, which was confirmed by the Biot–Savart law.
2. Experimental methods
All experiments were conducted in an open-return wind tunnel at the University of Nottingham. The test section of this wind tunnel was  $1.5\,{\rm m} \times 0.9\,{\rm m}\times 0.9\,{\rm m}$ (length $\times$ width $\times$ height). A thin rectangular flat plate was mounted 0.5 m downstream of the inlet of the test section, where the free-stream velocity $U_\infty$ was set to 10 m s $^{-1}$. The profile of the 3-mm thick model is illustrated in figure 1(a), which was made of an aluminium composite with a 3D-printed elliptic leading edge with the 18-mm major axis and the 3-mm minor axis. It had a chord length $c = 260$ mm and half-span length $s = 36$ mm, giving a very low AR of 0.277. The pivot of the wing was located at $0.52c$ from the leading edge. We installed a turbulence-generating grid upstream of the test section to increase the free-stream turbulence level to 4 %. This increased the effective chord Reynolds number to $Re = 3 \times 10^6$ (Wang et al. Reference Wang, Zhou, Alam and Yang2014). In this test, two coordinate systems were used, as shown in figure 1(b), both of which had the origin located at the leading edge at the mid-span. One was the laboratory-based coordinate system which had $x$ in the streamwise direction, $y$ in the cross-flow direction and $z$ in the spanwise direction, where $U$,
$U$,  $V$ and $W$ denoted the mean velocity components in $x$,
$x$,  $y$ and $z$ directions, respectively. The other one was the wing-based coordinate system, namely $x_m$ in the chordwise direction, $y_m$ in the normal-to-wing direction and $z_m$ in the spanwise direction, whose mean velocity components were $U_m$, $V_m$ and $W_m$.

Figure 1. (a) Plane and side view geometries of the very low AR wing. All dimensions are in millimetres. (b) Two different defined coordinate systems.
2.1. Force measurement
Aerodynamic forces on the test model were measured using a Kyowa LSM-B-SA1 three-component force transducer whose accuracy was  ${\pm }0.02$ N. The wing was attached to the force transducer via a strut, which was rotated by a step motor, see figure 1(a). The measured signals were sent to Kyowa DPM-911B strain-gauge amplifier, which were then converted to digital signals by a NI 9215 16-bit analogue-to-digital converter on a CompactRIO. The data acquisition rate was set according to the non-dimensional pitch rate $K$ as shown in table 1. At least 2000 data points were acquired during the pitching motion in all cases. To remove undesired signal fluctuations due to the model vibration during pitching, a low-pass filter was used, whose cutoff frequency of 10 Hz was less than the natural frequency of the pitching wing ( $\thicksim$24 Hz). The acceleration and deceleration at the start and the end of the motion, respectively, were smoothed by $C^\infty$ function (see § 2.3). The force measurements were synchronised with the pitch motion, and were repeated 50 times for each case. A moving averaging was also applied to the measured data to further smooth the signals. The aerodynamic forces were also acquired at a static condition ( $K = 0$) at a sample rate of 300 Hz for 10 s from $0^\circ$ to $90^\circ$ at an interval of $1.8^\circ$. To avoid any hysteresis effect, at static condition ( $K= 0$), we waited 10 seconds at each AoA before starting force measurements. The measured axial force $F_A$ and normal force $F_N$ on the wing were converted to lift force $F_L = (F_N \cos \alpha - F_A \sin \alpha )$ and drag force $F_D = (F_N \sin \alpha + F_A \cos \alpha )$, where $\alpha$ is the AoA. Here, the normal force coefficient, axial force coefficient, drag coefficient and lift coefficient are given by $C_N = F_N/\frac {1}{2} \rho U_\infty ^2 A$, $C_A = F_A/\frac {1}{2} \rho U_\infty ^2 A$, $C_D = F_D/\frac {1}{2} \rho U_\infty ^2 A$ and $C_L = F_L/\frac {1}{2} \rho U_\infty ^2 A$, respectively, where $U_\infty$ is the free-stream velocity, $\rho$ the air density and $A$ the surface area of the test model. The uncertainty in the force measurements was less than 2 %.
Table 1. Parameters of force and PIV measurements at different non-dimensional pitch rates  $K$.
$K$.

2.2. PIV measurement
The velocity field around the pitching wing was captured using a high-speed PIV technique, where the data on the  $x$–
$x$– $y$ and $y$–
$y$– $z$ planes were measured separately to depict the 3-D vortical structures of the LEV and the TV, as shown in figure 2. The wind tunnel was seeded with di-ethyl-hexyl-sebacate particles approximately 0.5 $\mathrm {\mu }$m in diameter, which were generated by two seeder generators (TSI 9307-7) placed upstream of the wind tunnel test section. The test area was illuminated using a Litron LDY 302-PIV Nd:YLF dual-cavity laser with 15 mJ per pulse and captured with a CMOS high-speed camera with a resolution of $1280 \times 800$ pixels. The time delay between laser pulses was set to 50 $\mathrm {\mu }$s for the $x$–
$x$– $y$ plane measurements while a shorter time delay of 30 $\mathrm {\mu }$s was set for the $y$–
$y$– $z$ plane measurements. Most of our measurements were made over the top half of the wing upstream of the pivot ( $x_m/c = 0.52$).

Figure 2. Imaging configuration for PIV measurements in planar and cross-flow sections.
The camera was equipped with a 50 mm Canon lens for the  $x$–
$x$– $y$ plane measurements, where the thickness of the laser light sheet was set to 0.5 mm, investigating 18 $x$–
$x$– $y$ planes from $z/s = 0$ to $z/s = 2$. For the $y$–
$y$– $z$ plane measurements, a round mirror with a diameter of 100 mm was placed 300 mm downstream of the test model at 45 $^\circ$ to the free stream using a 110 mm Canon lens, see figure 2. Here, the laser sheet thickness was increased to 2 mm, investigating 14 planes from $x_m/c = 0$ to $x_m/c = 0.52$. It should be noted that the laser sheets in the $y$–
$y$– $z$ plane did not stay perpendicular to the wing surface during the pitching motion, although the laser sheets in the $x$–
$x$– $y$ plane did. A summary of the PIV parameters is given in table 1, where the sampling duration for the baseline case ( $K = 0$) was 5 s for each AoA. The velocity vectors were obtained by Dantec DynamicStudio 2015a software by iteratively adjusting the size and shape of the individual interrogation areas depending on the local seeding densities. The minimum and maximum interrogation areas of measurement planes were 8 and 32 pixels with a 50 % overlap, respectively. The universal outlier detection analysis was also applied to remove spurious vectors (Westerweel & Scarano Reference Westerweel and Scarano2005), where any invalidated vectors were replaced by the median value calculated using $3 \times 3$ neighbourhood vectors. This gave about 16 000 vectors in each frame with a spatial resolution of $0.005c$.
The velocity data over the pitching wing were obtained by using the phase-averaging technique, where the 2-D PIV images were ensemble averaged at a given AoA during the pitching motion. Here, the ‘phase’ indicated the attitude of the pitching wing instead of the phase of the flow or vortex motion. Similar phase-averaging techniques have been used to study pitching and plunging aerofoils (Baik et al. Reference Baik, Bernal, Granlund and Ol2012; Akkala & Buchholz Reference Akkala and Buchholz2017; Gupta & Ansell Reference Gupta and Ansell2019). In order to reduce the phase-averaging errors due to velocity fluctuations over a pitching wing, all PIV images within  ${\pm }0.5^\circ$ of the target AoA were used for averaging in this study. As a result, the total number of PIV image pairs used for phase averaging at each AoA was increased to between 30 and 45 depending on the non-dimensional pitch rate $K$, see table 1. Here, the number of tests indicates the number of pitching motions which we have repeated. The total measurement uncertainty in the mean velocity during the pitch motion was less than 5 % of the free-stream velocity, see Dong et al. (Reference Dong, Choi and Mao2020). Estimated errors of derived quantities from the PIV measurements, such as the vorticity and circulation, were less than 8 % and 10 %, respectively.
Identification of the vortices over a pitching wing was made using the  $\lambda _2$-criterion (Jeong & Hussain Reference Jeong and Hussain1995), while the vortex centroid was determined by a minimum negative value of $\lambda _2$ within the uncertainty of $0.01c$. Other vortex identification techniques such as the $\varGamma _1$ criterion (Michard et al. Reference Michard, Graftieaux, Lollini and Grosjean1997) and the $Q$-criterion (Chong, Perry & Cantwell Reference Chong, Perry and Cantwell1990) were also tested, both of which gave similar results.
2.3. Pitching motion control
The wing pitch motion was controlled using a stepper motor and an NI 9512 drive with a minimum step angle of  $0.1^\circ$. Here, a constant pitch rate during the pitch-up (leading edge up) motion and pitch-down (leading edge down) motion was maintained from $\alpha = 0^\circ$ to $90^\circ$ and from $\alpha = 90^\circ$ to $0^\circ$, respectively. To reduce the unwanted acceleration effects on the force measurements at the start and the end of the pitch motion, the following smoothing transient suggested by Eldredge, Toomey & Medina (Reference Eldredge, Toomey and Medina2010) was applied
 \begin{equation} \alpha = \frac{K}{b}\ln\left[\frac{\cosh(b(\tau-\tau_1))}{\cosh \left(b\left(\tau-\tau_1-\dfrac{\alpha_{max}}{2K}\right)\right)}\right] +\frac{\alpha_{max}}{2}, \end{equation}
where
 \begin{gather} K = \frac{\dot{\alpha}c}{2U_\infty}, \end{gather}
 \begin{gather} b = \frac{{\rm \pi}^2K}{2\alpha_{max}(1-\sigma)}. \end{gather}
Here,  $\alpha$ is the AoA in radians, $K$ is the non-dimensional pitch rate as defined by (2.2), $\tau$ is the non-dimensional convective time ( $\tau = tU_\infty /c$), $\alpha _{max}$ is the maximum pitch angle, $\dot {\alpha }$ is the angular velocity of the wing, $\tau _1$ is the start of the ramp and $\sigma$ is the smoothing parameter which was set to 0.9 for this test. A preliminary test indicated no appreciable force fluctuations were experienced with this smoothing transient at the pitch rate $K < 0.1$. Typical pitch-up and pitch-down motion profiles are presented in figure 3, where the wing was held 20 convective times before pitching down from the maximum pitch angle ( $\alpha = 90^\circ$).

Figure 3. The pitch motion profiles for  $K = 0.003, 0.01, 0.03$ and $0.08$ consisting of pitch up, hold and pitch down.
3. Results and discussion
3.1. Aerodynamic forces on a pitching wing
Figure 4(a) shows the lift coefficient  $C_L$ and the drag coefficient $C_D$ of a thin flat-plate wing with a very low AR ( $AR = 0.277$). Here, the $C_L$ of this very low AR wing is compared with that of a 2-D plate wing at $Re = 10^5$ since we could not find many experimental data for a 2-D flat plate at high Reynolds numbers, certainly not at $Re = 3 \times 10^6$. We believe, however, the $C_L$ characteristics near the maximum lift angle will not change significantly with the Reynolds number once the flow is separated from the sharp leading edge of the flat plate. Although the lift coefficient $C_L$ of the stationary case ( $K = 0$) is very small at small AoAs (Lamar Reference Lamar1974) as compared with a 2-D thin plate (Pelletier & Mueller Reference Pelletier and Mueller2000), the $C_L$ slope increases with an increase in the AoA up to $\alpha = 40^\circ$, where it reaches a maximum lift coefficient of $C_L = 1.18$ which is 40 % greater than that of a 2-D flat plate. Then, the lift coefficient $C_L$ gradually reduces with a further increase in the AoA, returning to zero at $\alpha = 90^\circ$. The drag coefficient $C_D$ of the stationary thin flat-plate wing, on the other hand, increases with increasing AoA all the way up to $\alpha = 90^\circ$. Here, the $C_D$ slope increases with the AoA from $\alpha = 0^\circ$ to the maximum lift angle of $\alpha = 40^\circ$. Thereafter the rate of increase in $C_D$ reduces until $\alpha = 90^\circ$, where the maximum drag coefficient of $C_D = 1.43$ is observed.

Figure 4. The aerodynamic characteristics of a very low AR flat-plate wing as a function of AoA and the pitch rate: (a) the lift coefficient  $C_L$ and the drag coefficient $C_D$ as compared with those of a stationary 2-D thin flat plate ( $Re = 10^5$) by Pelletier & Mueller (Reference Pelletier and Mueller2000); (b) the maximum lift coefficient $C_{Lmax}$ and the maximum lift angle $\alpha _{Lmax}$.
Applying pitch motion, the maximum lift angle  $\alpha _{Lmax}$ of a very low AR thin plate is increased with increasing pitch rate $K$, see figure 4(b). On the other hand, the maximum lift coefficient $C_{Lmax}$ is reduced with pitching motion, although there is a small increase in $C_{Lmax}$ for a small value of pitch rate $K < 0.04$. This is due to the very low AR wing being studied here. While Gendrich (Reference Gendrich1999) and Granlund et al. (Reference Granlund, Ol and Bernal2013) demonstrated the lift enhancement on pitching wings with $AR = 4$ and 6, respectively, we have used a very low AR wing ( $AR = 0.277$) in this investigation. Similar to the lift curve, the drag curve is shifted to the right (towards the larger $\alpha$) with pitch motion, as shown in figure 4(a), where the maximum drag coefficient $C_D$ is increased with an increase in the pitch rate $K$. There is no sign of lift or drag spikes due to the wing acceleration at the start ( $\alpha = 0^\circ$) and the end ( $\alpha = 90^\circ$) of pitching since the pitch motion is carried out at a mid-chord pivot in this study (Granlund et al. Reference Granlund, Ol and Bernal2013).
The lift coefficient  $C_L$ for a very low AR thin plate, as shown in figure 4(a), is reasonably well represented by an empirical formula $C_L = A_L \sin 2 \alpha$ proposed by Strickland & Graham (Reference Strickland and Graham1986), where $A_L$ depends only on the pitch rate $K$. Granlund et al. (Reference Granlund, Ol and Bernal2013) suggested a multiplication factor of $(0.75-x_p)K$ to this formula, where $x_p$ is the non-dimensional pivot position along the chord, indicating that the effect of the pitch rate $K$ on $C_L$ is zero only if the pivot is located at the 75 % chord (Leishman 2006). Despite of the mid-chord pivot location, our results do not show any effect of the pitch rate $K$, suggesting that a different flow physics is at play for very low AR pitching wing aerodynamics. This will be explored in the following sections.
3.2. Effect of pitching motion on the vortical structures
Progressive development of the vortical structures over the upper half of the wing near the leading edge ( $x_m/c < 0.52$) is depicted in figure 5 for $K = 0$ and $0.08$ as a function of the AoA, which is identified by the $\lambda _2$-criterion (Jeong & Hussain Reference Jeong and Hussain1995). Here, the TV (shown in cyan) and the LEV (shown in red) are measured separately on $y$–
$y$– $z$ planes and $x$–
$x$– $y$ planes, respectively, which are shown together in figure 5 to present the whole vortical field over a very low AR wing under pitching motion. A flat-plate wing model is shown in black, where the free stream is from left to right in the figure. The baseline case ( $K = 0$) at $\alpha = 60^\circ$ and $\alpha = 70^\circ$ is not included here due to a global flow separation already taking place at these AoAs. For the baseline case, the sequence of images indicates that a TV is being developed along the tip edge. Figure 5 shows that the cross-sectional area of the TV suddenly expands at $\alpha = 40^\circ$ after gradually increasing from $\alpha = 10^\circ$ to $\alpha = 30^\circ$, suggesting the TV breakdown takes place by $\alpha = 40^\circ$ (Leibovich Reference Leibovich1978). A further analysis of the TV breakdown will be presented in a later section to support this observation. The TV grows further to occupy the whole half-span of the wing at $\alpha = 50^\circ$. Meanwhile, the flow near the leading edge seems to be fully attached, with no evidence of flow separation at $\alpha =10^\circ$. At $\alpha = 20^\circ$, the separated shear layer from the leading edge rolls up to generate discrete vortices, which are convected downstream along the wing chord. With a further increase in the AoA, the separated shear layer from the leading edge reattaches to the wing surface. When the flow over the wing is about to reach a global separation at $\alpha = 50^\circ$, the LEV moves away from the wing surface to become an arch-type structure (Kunihiko & Colonius Reference Kunihiko and Colonius2009; Visbal & Garmann Reference Visbal and Garmann2019). For the pitch-up case at $K = 0.08$, as shown in figure 5(b), LEV and TV structures are similar to those of the baseline case, except that the vortical development including the TV breakdown is delayed by approximately $10^\circ$.

Figure 5. Side view of the vortical structures as a function of AoA behind a very low AR static ( $K = 0$) and pitch-up ( $K = 0.08$) wing. Shown in red and cyan are the volumes of iso- $\lambda _2$, which indicate the LEV and the TV, respectively.
3.3. TV development under pitching motion
Figure 6 shows the phase-averaged, non-dimensional streamwise vorticity  $\omega _x c/U_\infty$ of the TV over a very low AR wing at $K = 0.08$, which is compared with that of the baseline case ( $K = 0$). The flow is from left to right and the wing model is shown by a black rectangle. Here, only the flow over the upper half of the wing is shown, from the leading edge to the pivot point at the mid-chord. For the baseline case ( $K = 0$), as shown in the first column of figure 6, the TV with a conical-shaped, negative vorticity region develops from the separated shear layer at the wing tip (Spalart Reference Spalart1998). Near the leading edge, an area of positive streamwise vorticity is also observed, resulting from the interaction between the TV and the LEV (Dong et al. Reference Dong, Choi and Mao2020). Similar results were also shown by Yilmaz & Rockwell (Reference Yilmaz and Rockwell2012). The TV gradually increases its diameter downstream, whose sudden expansion is observed at $x_m/c = 0.15$ at $\alpha = 40^\circ$. As the AoA is increased to $\alpha = 50^\circ$, the diameter of the TV increases to nearly half the wing span and the vorticity distribution starts to become non-uniform. Between $\alpha = 30^\circ$ and $50^\circ$, the vorticity at the periphery of the TV shows wavy edges typical of the vortex instability, suggesting the occurrence of the vortex breakdown (Lee, Kim & Kim Reference Lee, Kim and Kim2002). The TV behaviour of the pitch-up wing with $K = 0.08$ is similar to that of the baseline case, except that its development seems to be delayed by nearly $10^\circ$.

Figure 6. The phase-averaged normalised streamwise vorticity ( $\omega _x c / U_\infty$) along the chord vs AoA for the wing pitching at $K = 0$ and $0.08$. The colour bar on the right side applies to all plots.
A comparison of the TV vorticity distribution between the pitch-up and pitch-down cases at  $K = 0.03$ is shown in figure 7. The TV development on the pitch-up wing is similar to that of the baseline wing, as described in figure 6(a), but with a small delay. Figure 7(b) shows that the pitch-down case with $K = 0.03$ starts at $\alpha = 90^\circ$ with a global flow separation, which remains separated until the AoA is reduced to $\alpha =40^\circ$. A TV finally appears at $\alpha = 30^\circ$. As a result, the vorticity over a pitch-down wing is much lower than that of the pitch-up wing. These results suggest that the influence of the pitch motion is to maintain the initial state of the flow structure over the wing. In other words, the pitch-up wing starts with a fully attached flow, which is maintained to a higher AoA by delaying the development of the vortex structures. The pitch-down wing, on the other hand, starts with a fully separated flow, maintaining the global flow separation until a small AoA.

Figure 7. The phase-averaged normalised streamwise vorticity ( $\omega _x c / U_\infty$) along the chord vs AoA for the wing pitching up and down at $K = 0.03$. The colour bar on the right side applies to all plots.
Detailed behaviour of the TV development at  $K = 0.08$ is shown in figure 8 by the non-dimensional, phase-averaged streamwise vorticity $\omega _x c/U_\infty$ in the $y$–
$y$– $z$ plane at the pivot position ( $x_m/c = 0.52$), which is superposed by velocity vectors. Here, the TV core and the vortex centroid are identified by the $\lambda _2$ method as described in § 2, and are indicated by a circle and a dot, respectively. A thick vertical line on the left of each figure indicates the position of the wing. Here, the velocity vectors and vorticity are missing close to the wing surface for $\alpha > 40^\circ$, see figure 8. This is due to the PIV laser light reflection on the wing surface, where the affected area is increased with an increase in the AoA. However, this does not influence the circulation measurements and vortex core tracking since the TV moves away from the wing surface at the same time. Up to $\alpha = 40^\circ$, the circular TV core moves away from the wing surface while staying at the same spanwise position. As the AoA increases further, the TV core is wrapped around by a ribbon-like shear layer from the wing tip (see also figure 12). The diameter of the TV increases dramatically at this point, suggesting that the TV is going through vortex breakdown. At this time, the vortex centroid starts to move away from the wing tip towards the mid-span. With a further increase in the AoA, the vortex core and the associated vorticity distribution become highly distorted, making it is difficult to identify the TV core anymore. The vorticity of the TV has almost vanished at $\alpha = 80^\circ$, indicating that the global flow separation takes place at this AoA.

Figure 8. Progressive development of the normalised phase-averaged streamwise vorticity  $\omega _x c/U_\infty$ superimposed on the velocity vectors in a $y$–
$y$– $z$ plane at the pivot ( $x_m/c = 0.52$) of the wing from $\alpha = 10^\circ$ to $\alpha = 80^\circ$ pitching at $K = 0.08$. The core and centroid of the TV are indicated by a pink circle and green point, respectively, in each figure.
To better understand the effect of the pitch-up motion on the flow structures over a very low AR wing, we now investigate the circulation of the TV core at  $x_m/c = 0.52$, excluding the secondary vorticity near the wing surface. Here, the streamwise location ( $x_m/c = 0.52$) is where the laser sheet in the $y$–
$y$– $z$ plane crosses on the wing chord line. Figure 9(a) shows the non-dimensional circulation of the TV against the AoA $\alpha$, indicating that the development of the TV circulation is delayed by the pitch-up motion. This delay is called the phase lag, which is defined as the difference in the pitch-up angle between the baseline wing and the pitching wing in achieving the same circulation. These results show that the phase lag $\beta$ is a linear function of the non-dimensional pitch rate $K$, see figure 9(b), which is given by $\beta = 1.85K$ when $\beta$ is expressed in radians. Here, the error bars in the figure indicate the uncertainties in $\beta$ based on all circulation measurements up to $\alpha = 50^\circ$. Although the phase lag $\beta$ is obtained at $x_m/c = 0.52$, it should not be affected by the streamwise position of the TV circulation measurements. This can be seen in figure 11(a), which shows that the TV circulation increases linearly with the streamwise distance until close to $x_m/c = 0.52$. The phase lag of the LEV, which is defined in a similar way for the TV circulation, is also shown in figure 9(b). It is interesting to observe that the phase lag of the LEV is nearly identical to that of the TV, suggesting that the dynamics of the LEV is strongly influenced by the TV. After removing the effect of the phase lag, the AoA is given by a new parameter $\alpha ^* = \alpha - \beta$. Figure 9(c) demonstrates that the TV circulation data for all $K$ values can be collapsed into a single curve when they are plotted against $\alpha ^*$. This gives the non-dimensional circulation as $\varGamma _T/c U_\infty = 0.628 (\alpha ^*) ^{1.8}$ when $\alpha ^*$ is expressed in radians.

Figure 9. (a) Development of normalised circulation ( $\varGamma _T/c U_\infty$) of the TV at the pivot ( $x_m/c = 0.52$) as a function of $\alpha$, (b) phase lag of the TV and the LEV as a function of the pitch rate $K$ and (c) TV circulation ( $\varGamma _T/c U_\infty$) vs $\alpha ^*$.
Similarly, the trajectory of the TV centroid during the pitch-up motion also overlaps using  $\alpha ^*$, as shown in figures 10(a) and 10(b), where the position of the TV centroid is given by $y/c$ and $z/s$, respectively. The TV stays near $z/s = 0.9$ for $\alpha ^* < 30^\circ$ and moves towards the wing mid-span after the vortex breakdown with an increase in $\alpha ^*$. However, $y/c$ always increases linearly with an increase in the AoA. The circulation and the core location of the TV are obtained based on the PIV data, which are shown in figure 11 for different $\alpha ^*$. Here, only the results at $K = 0.01$ and 0.08 are depicted for clarity. This shows that the circulation initially increases linearly downstream to reach a plateau just before the pivot position ( $x_m/c = 0.52$), while the distance between the TV and the wing wall exhibits a monotonic increase along the wing chord. These results are consistent with DeVoria & Mohseni (Reference DeVoria and Mohseni2017a) and Dong et al. (Reference Dong, Choi and Mao2020).

Figure 10. The locus of the TV centroid throughout the pitching motion at the pivot ( $x_m/c = 0.52$) as a function of $\alpha ^*$. (a) The distance to the wing surface; (b) the distance to the mid-span.

Figure 11. Development of (a) the TV circulation and (b) the distance between the vortex centroid and the wing surface along the wing chord at  $K$ = 0.01 (circles) and 0.08 (stars).
Figures 12(a) and 12(b) show the instantaneous vorticity field during the TV breakdown in the  $y$–
$y$– $z$ plane at the pivot ( $x_m/c = 0.52$), demonstrating that the development of the vortex structures for $K = 0.01$ and $K = 0.08$ is similar against $\alpha ^*$. At $\alpha ^* = 25^\circ$, a circular-shaped TV core is observed near the wing tip. Increasing the AoA to $\alpha ^* = 32^\circ$, the vortex core begins to expand rapidly and loses its coherence, indicating the start of vortex breakdown. The process of vortex breakdown continues through to $\alpha ^* = 40^\circ$. At $\alpha ^* = 50^\circ$, the vortex core disappears, where the vorticity from the separated shear layer is dispersed to the bottom of the TV near the wing mid-span. The loss of vortex coherence associated with the TV breakdown is analysed using the probability density function of the number of TV vortices identified by the $\lambda _2$-criterion. Figures 12(c) and 12(d) show the probability distribution of the number of identified vortices based on the instantaneous vorticity field in the $y$–
$y$– $z$ plane at each AoA, as shown in figures 12(a) and 12(b). For $\alpha ^* < 32^\circ$, the probability of the number of identified vortices is axisymmetrically distributed around the centre of the TV, where the probability is close to 100 %. At $\alpha ^* = 40^\circ$, however, the axisymmetry of the probability distribution is lost with a simultaneous reduction in the probability around the centre of the TV, which is caused by the vortex breakdown. A further reduction in the probability of the number of identified vortices is observed at $\alpha ^* = 50^\circ$, where a circular TV cross-section is completely lost. Since a sudden expansion of the TV cross-sectional area is one of the criteria for the vortex breakdown (Leibovich Reference Leibovich1978), a jump in the TV core area ( $S_{{TV}}$) at $\alpha ^* = 32^\circ$ as shown in figure 13(a) strongly suggests that TV breakdown is taking place at this AoA. The measured $C_L$ curve shown in figure 4 indicates that the maximum lift angle of a very low AR flat-plate wing is $\alpha ^* = 40^\circ$. Therefore, the global separation should not be taking place at $\alpha ^* = 32^\circ$. The AoA for the initiation of the vortex breakdown at different chordwise locations $x_m/c$ is also investigated and shown in figure 13(b). This shows that the location of the vortex breakdown is shifted upstream nearly linearly with an increase in $\alpha ^*$.

Figure 12. Distribution of instantaneous flow fields in the  $y$–
$y$– $z$ plane at the pivot ( $x_m/c = 0.52$). The vorticity fields at $K = 0.01$ (a), the vorticity fields at $K = 0.08$ (b), probability density function of the number of TV vortices identified by the $\lambda _2$-criterion at $K = 0.01$ (c) and at $K$ = 0.08 (d).

Figure 13. (a) The change of the TV core area  $S_{{TV}}$ as a function of $\alpha ^*$ at different pitch rates at the pivot ( $x_m/c = 0.52$), (b) the TV breakdown along the chord of the wing vs $\alpha ^*$ at different pitch rates.
The  $V$-component velocity over the suction side of the wing at the pivot ( $x_m/c = 0.52$) is obtained from the PIV measurements, showing the spanwise variation of the velocity from the TV centroid to the wing mid-span, see figure 14(a). Again, the velocity profiles of the pitch-up wing with $K = 0.08$ are similar to those of the baseline case when the phase-lag adjusted AoA $\alpha ^*$ is used even after the vortex breakdown ( $\alpha ^* = 40^\circ$). The peak velocity in figure 14(a) is shown in figure 14(b) as a function of $\alpha ^*$, where the start of the TV breakdown can be identified by the discontinuity in the velocity profile. Although the negative peak velocity increases nearly linearly with the AoA, its rate of increase reduces to nearly 1/4 after the TV breakdown. The variation of the non-dimensional circulation $\varGamma _r/\varGamma _T$ of the TV is shown in figure 14(c) as a function of the non-dimensional radius $r/r_c$. Here, $\varGamma _T$ is the circulation of the TV core, see figure 9(c), and $r_c$ is the TV core radius which is estimated by $\sqrt {S_{{TV}}/{\rm \pi} }$. Our results agree well with those by Hoffmann & Joubert (Reference Hoffmann and Joubert1963), Phillips (Reference Phillips1981), Birch & Lee (Reference Birch and Lee2005) and Skinner, Green & Zare-Behtash (Reference Skinner, Green and Zare-Behtash2020), whose suggested the following correlations:
 \begin{equation} \left.\begin{array}{ll@{}} \varGamma_r/\varGamma_T = A_1 (r/r_c)^2 & \textrm{for}\ r/r_c < 0.4, \\ \varGamma_r/\varGamma_T = A_2 {\rm{log}}(r/r_c) + A_3 & \textrm{for}\ 0.5< r/r_c < 1.4, \end{array}\right\} \end{equation}
where  $A_1 = 1.83$, $A_2= 2.14$ and $A_3 = 1$ are best-fit constants to our data. The self-similar distribution of $\varGamma _r/\varGamma _T$ from $\alpha ^* = 20^\circ$ to $\alpha ^* = 40^\circ$ is observed for all pitch-up cases studied here. Ours results in the core region can also be expressed by a sixth-order polynomial (Birch & Lee Reference Birch and Lee2005; Skinner et al. Reference Skinner, Green and Zare-Behtash2020)
 \begin{equation} \varGamma_r/\varGamma_T = 1.756 (r/r_c)^2 - 1.044 (r/r_c)^4 + 0.263 (r/r_c)^6 \quad \textrm{for}\ 0 < r/r_c < 1. \end{equation}
Figure 14. (a) The  $V$-component velocity profiles over the suction side of the wing from the TV centroid to the mid-span at the pivot at $K = 0$ and $K = 0.08$, (b) the peak velocity of $V$ between the TV centroid and the mid-span as a function of $\alpha ^*$ at different pitch rates, (c) non-dimensional circulation vs its radius at different AoAs at the pivot.
Figure 15 shows a comparison in the development of the axial velocity of the TV at the pivot ( $x_m/c = 0.52$) between the pitch-up case ( $K = 0.08$) and the baseline case ( $K = 0$). The locus of the TV centroid and the TV edges are shown in dash and solid lines, respectively, as a function of $\alpha ^*$. It should be mentioned here that the axial velocity in figure 15 is not always located at the same spanwise position since the vortex centroid can move towards the mid-span after the TV breakdown, as shown in figure 10(b). At $\alpha ^*<32^\circ$, the axial velocity of the TV is greater than the free-stream velocity, forming a jet-like vortex core, which is observed by Shah et al. (Reference Shah, Atsavapranee, Hsu, Wei and McHugh1999), Batchelor (Reference Batchelor1964), Saffman (Reference Saffman1995) and Birch & Lee (Reference Birch and Lee2005) on delta wings as well as on large AR wings. This may be due to the accelerated flow inside the TV core owing to the negative pressure gradient (Bailey, Tavoularis & Lee Reference Bailey, Tavoularis and Lee2006). Another axial velocity excess can be observed between the wing surface and the TV edge. With an increase in the AoA beyond the vortex breakdown angle of $\alpha ^* = 32^\circ$, the TV core changes from a jet like to a wake like, increasing the amount of velocity deficit.

Figure 15. Non-dimensional axial velocity ( $U/U_\infty$) through the TV centroid as a function of $\alpha ^*$: (a) baseline case and (b) pitching at $K = 0.08$.
3.4. LEV development under pitching motion
The distribution of non-dimensional, phase-averaged spanwise vorticity ( $\omega _z c/U_\infty$) over the pitching wing at $K = 0.08$ is shown in figure 16(b) for AoAs from $10^\circ$ to $70^\circ$, which is compared with that of the baseline case as shown in figure 16(a). Here, the vorticity contours are obtained from PIV measurements in 8 $x$–
$x$– $y$ planes, see figure 2. For the baseline case ( $K = 0$), the shear layer near the leading edge starts to roll up at $\alpha = 20^\circ$, and its reattachment point at the mid-span is near the pivot ( $x_m/c = 0.52$). At $\alpha = 30^\circ$, the reattachment point moves upstream, increasing the negative vorticity within the LEV. Here, secondary vorticity regions can also be observed beneath the LEV. With an increase in the AoA the flow reattachment point moves further upstream until $\alpha = 50^\circ$, when the LEV starts to expand, moving the reattachment point downstream. At the same time, the separated shear layer moves away from the wing surface, creating an arc-shaped vorticity region. The roll-up of the LEV continues until it reaches a global flow separation at $\alpha = 60^\circ$. For the pitching case, see figure 16(b), the LEV goes through much the same developmental process as the baseline case. However, the pitching motion delays the LEV development in a similar way as it does to the TV development, see figure 6(b).

Figure 16. The phase-averaged normalised spanwise vorticity ( $\omega _z c / U_\infty$) along the span vs AoA for the baseline case and the wing pitching at $K = 0.08$. The colour bar on the right side applies to all plots.
A comparison of the pitch-up and pitch-down cases is shown in figure 17 for  $K = 0.03$. For the pitch-down case, the flow starts with a globally separated state and the separated shear layer does not reattach until at $\alpha = 30^\circ$. Here, the reattachment point is observed much further downstream as compared with the pitch-up case at the same AoA. It is difficult to identify the LEV at $\alpha > 30^\circ$ due to the effect of the pitching motion, which maintains the initial flow state. We will only focus on the pitch-up cases in the following discussions of the LEV.

Figure 17. The phase-averaged normalised spanwise vorticity ( $\omega _z c / U_\infty$) along the span vs AoA for the pitch-up and pitch-down wing at $K = 0.03$. The colour bar on the right side applies to all plots.
Figure 18 shows the development of the non-dimensional spanwise vorticity with the measured velocity vectors at the mid-span of the wing as a function of  $\alpha ^*$ under the pitch-up motion at $K = 0.08$. At $\alpha ^* = 12.2^\circ$, the shear-layer vorticity and the velocity vectors are parallel to the wing surface almost everywhere, indicating a fully attached flow. At a later stage, a small laminar separation bubble is formed at the leading edge at $\alpha ^* = 15.4^\circ$, and the rolled-up vortices start to shed at $\alpha ^* = 18.6^\circ$. At $\alpha ^* = 27.2^\circ$, the separated shear layer reattaches to the wing, forming a large separation bubble. A small positive secondary vorticity region is also seen beneath the LEV, which is due to recirculating flow within the separation bubble. Here, the wallward velocity vectors near the trailing edge of the laminar separation bubble seem to be interacting with the separation bubble to help reattach it to the wing surface. With a further increase in the AoA to $\alpha ^* = 52.2^\circ$, the LEV increases its strength while the reattachment points shift upstream, as shown in figure 18(e). Here again, we can observe a strong wallward velocity immediately downstream of the LEV. The shear layer is then lifted up at $\alpha ^* = 62.2^\circ$ and finally the flow completely separates from the wing surface at $\alpha ^* = 77.2^\circ$, see figure 18(h). The results shown in figure 18 suggest that the flow over the very low AR wing goes through four distinct stages under the pitching motion. They are: attachment, vortex shedding, reattachment and separation, all of which seem to be affected by the wall-normal velocity. To investigate if the strong wallward velocity as shown in figure 18 is due to the downwash of the TV, we estimate the induced velocity using the Biot–Savart law based on the inviscid flow assumption. Here, the TV is modelled by a straight semi-infinite line vortex originating from the tip of the leading edge ( $x_m/c = 0$, $z_m/s = 1$). The measured location and the circulation of the TV used for this calculation are given in figure 11. Where the TV circulation is increasing (see figure 11a), the line vortex is divided into several vortex elements with a constant circulation before applying the Biot–Savart law. It should be noted that the assumption of a line vortex is no longer valid after the TV breakdown. Therefore, the results should be treated with caution. Nevertheless, the result demonstrates that the estimated downwash (shown in the grey scale map) in figure 18 corresponds to the measured velocity field very well, confirming that the TV has a strong influence on the LEV behaviour, as discussed above.

Figure 18. Progressive development of the normalised spanwise vorticity  $\omega _z c/U_\infty$ superimposed on the velocity vectors and estimated downwash $V_{md}$ at the mid-span of the very low AR wing pitching at $K = 0.08$ as a function of $\alpha ^*$.
The development of the non-dimensional circulation ( $\varGamma _L/c U_\infty$) of the LEV at the mid-span during the pitch-up motion is shown in figure 19(a) as a function of $\alpha ^*$, showing that the LEV is not formed at the early stage of pitching. With an increase in the AoA, the circulation of the LEV increases linearly until it reaches to $\alpha ^* = 32^\circ$, which can be expressed by $\varGamma _L/c U_\infty = 0.653 \alpha ^* - 0.129$ when $\alpha ^*$ is expressed in radians. However, the growth rate of the circulation of the LEV reduces with a further increase in the AoA due to the TV breakdown. Figure 19(b) shows the locus of the LEV centroid during the pitch-up motion at different pitch rates. The LEV is formed at $\alpha ^* = 18^\circ$, and gradually moves away from the wing surface with an increase in the AoA. The chordwise movement of the LEV centroid is rather complicated, however. Initially, the LEV moves downstream until $\alpha ^* = 23^\circ$ and then moves back upstream. At $\alpha ^* = 45^\circ$, the LEV centroid starts to move downstream again due to the lift-off of the separated shear layer at the leading edge. Overall, the LEV over a very low AR pitching wing stays very close to the leading edge of the wing ( $x_m/c = 0 \sim 0.1$ and $y_m/c = 0 \sim 0.08$) until flow starts to separate.

Figure 19. (a) The normalised circulation of the LEV vs  $\alpha ^*$ at the mid-span with different $K$, (b) the locus of the LEV centroid throughout the pitching motion.
To further examine the behaviour of the separating shear layer and the associated spanwise vorticity development of the LEV, the non-dimensional vorticity flux  $\varOmega = - \int \omega _z U_m \,\textrm {d} \it {y_m} /U_\infty ^2$ at the mid-span of the wing at $x_m = 0.17c$ is shown in figure 20. This $x_m$ position corresponds to the most downstream location of the LEV before flow separation takes place over the wing, see figure 18. The vorticity flux is obtained along the path normal to the wing from $y_m = 0.015c$ to $y_m = 0.15c$, excluding the secondary vorticity within the separation bubble. There is a significant rise in the vorticity flux at $\alpha _1^* = 12.6^\circ$, which is due to the vortex shedding from the laminar separation bubble, see figure 18(c). The vortex shedding stage lasts until $\alpha _2^* = 33^\circ$, which is followed by the reattachment stage. Here, the vortex flux remains nearly zero until the start of the flow separation at $\alpha _3^*$. The separation stage continues until the end of the pitching motion, see figure 18(h). The angles $\alpha _1^*$ and $\alpha _2^*$ are independent of the pitch rate $K$, as shown in figure 20. However, the initiation angle for flow separation $\alpha ^*_3$ increases with an increase in the $K$ value.

Figure 20. Non-dimensional vorticity flux  $\varOmega$ at the mid-span vs $\alpha ^*$ when the wing is pitching at $K = 0.01, 0.03$ and $0.08$.
3.5. Normal forces
The normal force coefficient  $C_N$ for a stationary ( $K = 0$), very low AR thin plate is presented in figure 21(a), showing that $C_N$ increases slowly at small AoAs. With a further increase in the AoA, however, the normal force coefficient increases sharply to attain the maximum value of $C_N = 1.6$ at $\alpha = 48^\circ$. The normal force coefficient reduces slightly after the maximum $C_N$ until $\alpha = 90^\circ$. With pitching motion on a wing, the maximum $C_N$ and the maximum $C_N$ angle are both increased. For example, the maximum $C_N$ is increased by up to 44 % with $K = 0.08$ while the maximum $C_N$ angle is increased from $48^\circ$ to $75^\circ$. Such behaviour of $C_N$ is not surprising, however, since the normal force coefficient $C_N$ is related to $C_L$ and $C_D$ through an equation given by $C_N = C_L \cos \alpha + C_D \sin \alpha$. In other words, $C_N$ behaves like $C_L$ for small $\alpha$, while it behaves like $C_D$ for large $\alpha$, see figure 4(a).

Figure 21. The normal force coefficient  $C_N$ over a very low AR wing: (a) vs $\alpha$ and (b) vs $\alpha ^*$.
The shift of  $C_N$ curve to the right (towards the larger $\alpha$) with increasing pitch rate $K$, as observed in figure 21(a), is due to the phase lag in the development of TV and LEV over a pitching wing. By replotting figure 21(a) in terms of $\alpha ^*$ after removing the effect of the phase lag due to the pitch motion, all experimental results lie on a single curve, as shown in figure 21(b). The curve drawn in figure 21(b) is given by an equation $C_N = k_p \sin \alpha ^* \cos \alpha ^* + k_v \sin 2 \alpha ^*$, as suggested by Polhamus (Reference Polhamus1966) and Lamar (Reference Lamar1974). Here, $k_p$ and $k_v$ were obtained through a curve fitting to our experimental data. This results in $k_v = {\rm \pi}$ and a slightly larger value of $k_p = 0.77$ than suggested by Lamar (Reference Lamar1974), which may be due to the elliptical leading edge.
4. Conclusions
The vortical structures over a thin rectangular wing with a very low AR ( $AR = 0.277$) are investigated in a wind tunnel at the effective Reynolds number of $3 \times 10^6$. When applying pitch-up motion pivots at the mid-chord, the maximum lift angle is increased with an increase in the non-dimensional pitch rate $K$, but the maximum lift coefficient is reduced. This result contradicts the finding of Granlund et al. (Reference Granlund, Ol and Bernal2013), who showed that the lift coefficient $C_L$ of a pitching wing was proportional to $(0.75 - x_p)K$, where $x_p$ is the non-dimensional pivot position along the chord. This suggests that a different flow physics is at play in the aerodynamics of a very low AR pitching wing, where the induced velocity of the TV helps reattach the separated flow and maintains the LEV.
Detailed PIV measurements of the flow over a pitching wing show that there is a phase lag in the TV development, which increases with an increase in the pitch rate  $K$. Here, the phase lag is defined as the difference in the pitch angle between the stationary wing and the pitch-up wing to reach the same circulation. It is also observed that the phase lag of the LEV is nearly identical to that of the TV, confirming that the dynamic of the LEV is strongly influenced by the TV. After the phase lag is taken into account, we observe a similarity in the development of the TV and LEV over a very low AR wing between the stationary and pitching conditions.
Vortex breakdown of the TV takes place at the phase-lag adjusted AoA of  $\alpha ^* = 32^\circ$ at the mid-chord. During the vortex breakdown, the diameter of the TV increases rapidly, where the vorticity distribution at the periphery of the TV shows wavy edges typical of the vortex instability. The axial velocity of the TV is greater than the free-stream velocity before the vortex breakdown, forming a jet-like vortex core. After the vortex breakdown, however, this changes to a wake-like core with velocity deficit. The location of the vortex breakdown shifts upstream nearly linearly along the wing chord with an increase in the AoA.
The behaviour of the LEV is studied in light of the downwash induced by the TV. At a small AoA, the flow over the pitching wing is fully attached. With an increase in the AoA, the separated shear layer starts to roll up, forming the LEV, whose reattachment point moves downstream until  $\alpha ^* = 23^\circ$. Afterward, the LEV is pushed upstream due to the downwash of the TV until $\alpha ^* = 45^\circ$, increasing the circulation of the LEV at the same time. Thereafter, the downwash velocity close to the wing surface starts to decrease, reverting the movement of the LEV downstream with a further increase in the AoA. These results clearly show that the TV over a very low AR wing induces strong downwash to influence the development of the LEV during the pitching motion to delay flow separation.
Funding
This study was supported by EPSRC (Grant Number EP/N018486/1) in the UK. The first author acknowledges the PhD funding provided by the China Scholarship Council (No. 201807000111).
Declaration of interests
The authors report no conflict of interest.


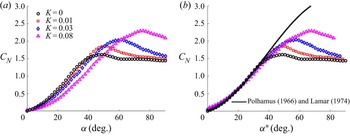


 Open access