


The increased risk of CHD among non-drinkers compared with moderate drinkers is one of the most consistent associations found within epidemiological research(Reference Bagnardi, Zatonski and Scotti1–Reference Rimm, Giovannucci and Willett5). The difference in the risk of CHD between heavier and moderate drinkers is less consistent. Meta-analyses have reported conflicting results: either no difference between these two groups with respect to risk of CHD(Reference Maclure4), or an increase in risk of CHD(Reference Corrao, Rubbiati and Bagnardi2, Reference Di, Rotondo and Iacoviello3), albeit possibly an increase only among binge drinkers as opposed to regular drinkers(Reference Bagnardi, Zatonski and Scotti1). The protective effect of alcohol intake has been attributed to the positive association between alcohol intake and HDL cholesterol levels(Reference Castelli, Doyle and Gordon6–Reference Muller, Sturmer and Brenner8) and to a reduction in inflammatory markers(Reference Imhof, Woodward and Doering9–Reference Stewart11), although the exact mechanism remains unidentified. CHD is the leading cause of death worldwide(12), and alcohol intake is widespread. Accordingly, further clarification and understanding of the relationship between alcohol intake and the risk of CHD are required.
In validation studies, self-reported instruments for assessing alcohol intake appear to rank individuals in a comparable manner(Reference Ferraroni, Decarli and Franceschi13–Reference Witte and Haile17). However, the quantitative estimates of average alcohol intake can differ by as much as 20 % among different methods(Reference Feunekes, van’t Veer and van Staveren14). Such disparities may be relevant when health outcomes, such as risk of CHD, are examined in relation to the absolute level of intake for the purpose of developing or evaluating public health recommendations. The shape of the association between the risk of CHD risk and levels of intake may be influenced by inaccurate categorization of individuals.
At present, a quantitative biomarker for the spectrum of levels of alcohol intake has not been established, although development is under way(Reference Bergstrom and Helander18, Reference Schroder, de la Torre and Estruch19). Without a biomarker for alcohol intake, it is not possible to objectively assess the validity of different approaches for measuring alcohol intake. However, large prospective studies that use a variety of instruments for the assessment of alcohol intake provide an opportunity to compare these methods. The objective of the present study was to determine whether the association between alcohol intake and incident risk of CHD would differ across different methods for alcohol assessment: a single question regarding the usual intake of beer, wine and spirits; a semi-quantitative FFQ; and an open-ended 7 d diet diary (7DD). The present analysis is a nested case–control study drawn from the European Prospective Investigation into Cancer in Norfolk (EPIC-Norfolk) study.
Methods
Study population
Between 1993 and 1997, men and women aged 40–79 years were recruited from the general practitioners’ age–sex registers for the prospective EPIC-Norfolk study(Reference Day, Oakes and Luben20). The study was approved by the Norwich District Health Authority Ethics Committee, and all participants gave signed informed consent. Although the present study was established as part of a ten-country collaboration on diet and cancer, EPIC-Europe(Reference Slimani, Kaaks and Ferrari21), the aims of the EPIC-Norfolk cohort were broadened from the outset to encompass the wider determinants of a range of health outcomes. A self-administered postal Health and Lifestyle Questionnaire (HLQ) was completed by 30 445 individuals. The HLQ included questions on education, employment history, physical activity, smoking, personal medical history and medication use(Reference Day, Oakes and Luben20). A health examination was attended by 25 637 of those individuals who had completed the HLQ; among them, 24 852 returned completed FFQ that had been mailed out before the health examination. At the health examination, the participants self-reported all foods and beverages consumed over the past 24 h; this record served as the first day of the 7DD. The participants were then asked to record all food and drink consumed over the next 6 d and return the 7DD by post(Reference Welch, McTaggart and Mulligan22). The 7DD was returned by 23 658 participants. Records for all 7 d were provided by 93 % of those who returned the 7DD. Exclusion of those with fewer than 7 d of food records (n 516) did not materially alter the results of the present analysis, and therefore those individuals were included.
Alcohol consumption
Data on alcohol intake were collected in the HLQ, the 7DD and the FFQ. To enable comparison of alcohol intake across instruments, alcohol consumption was expressed in units per week, in which one unit contains 8 g of alcohol.
In the HLQ, participants were asked to specify the number of pints of beer/cider/lager, or glasses of wine, sherry/fortified wine or spirits (e.g. gin, brandy, whiskey, vodka) consumed on a weekly basis at ‘present’ (baseline). The respondents were requested to put ‘0’ if they drank none of the beverage, or to tick a separate box labelled ‘occasional’ if they had less than one drink a week. Responses were converted to units of alcohol per week, taking 0·5 pints of beer, lager or cider, and one glass of wine, spirits or fortified wine to be equivalent to 1 unit of alcohol. ‘Occasional’ consumption of a beverage was assigned the value of 0·25 units of alcohol per week.
In the FFQ, participants were asked to identify how frequently they had consumed wine (glass), beer/cider/lager (half pint), port/sherry/vermouth/liqueurs (glass) or spirits (single) (e.g. gin, brandy, whiskey, vodka) over the past year. The volume assigned to these alcoholic beverages was 125 ml for wine, 288 ml for half a pint of beer, 50 ml for sherry and other fortified wines and 25 ml for spirits. Data on the amount of alcohol (g) per 100 ml for alcoholic beverages were obtained from McCance and Widdowson’s The Composition of Foods (Reference Welch, McTaggart and Mulligan22), and the average daily intake of alcohol was calculated. The daily grams of alcohol were multiplied by seven to obtain an estimate of weekly intake, and then divided by eight to express the weekly alcohol intake as units of alcohol.
In the 7DD, the participants were asked to report portion size and other details (e.g. type, brand, percentage alcohol) of alcoholic beverages consumed, as well as whether the alcohol was consumed at home or in a pub/restaurant. Wine portion sizes were generally described by the participant as small, medium or large glasses, and were assigned the volumes of 125 ml, 175 ml and 250 ml, respectively, during data entry. In the absence of a glass size description, the serving was assumed to contain 175 ml. Beer was mostly reported as pints (568 ml), half pints (284 ml), cans or bottles. A single shot of spirits was assumed to contain 25 ml if it was served in a pub, or 50 ml if it was poured at home. As with the FFQ, data on the amount of alcohol (g) per 100 ml for alcoholic beverages were used to calculate daily grams of alcohol intake, which were then converted into weekly units of alcohol.
Baseline demographic and risk factors
In the HLQ, the term ‘never smokers’ was applied to those participants who responded ‘no’ when asked whether they had ever smoked one cigarette per day for at least a 1-year period. ‘Former smokers’ were those who responded ‘yes’ to the above question but were no longer smoking at the time of the HLQ, whereas ‘current smokers’ had responded ‘yes’ and continued to smoke. The participants were asked to indicate whether they had been diagnosed by their doctor with a list of illnesses, including heart attack (myocardial infarction), diabetes, stroke and cancer, and were also asked whether any members of their immediate family had been diagnosed with any of the aforementioned conditions. Physical activity was assessed using a 4-point scale classification, combining occupational and leisure-time physical activity level(Reference Khaw, Jakes and Bingham23). The participants were asked about their current work status and about their occupation at present and in the past. Their social class was then classified according to the Registrar General’s occupation-based classification scheme(Reference Elias, Halstead and Prandy24). Social class I consists of professionals; class II includes managerial and technical occupations; class III is subdivided into non-manual and manual skilled workers; class IV consists of partly skilled workers; and class V comprises unskilled manual workers (the detailed classification is described elsewhere)(Reference Elias, Halstead and Prandy24). For the present analysis, the participants were classified as manual (classes IV, V and manual class III) and non-manual (class I, II and non-manual III).
Trained nurses, who used standard protocols, measured height, weight, systolic blood pressure (mmHg) and diastolic blood pressure (mmHg) at the health examination. BMI was calculated as weight (kg) divided by the square of height (m2). A blood sample was obtained. Serum levels (mmol/l) of total cholesterol, HDL cholesterol and TAG were measured with the RA 1000 (Bayer Diagnostics, Basingstoke, UK), and LDL cholesterol (mmol/l) levels were calculated with the Friedewald formula(Reference Friedewald, Levy and Fredrickson25).
Ascertainment of CHD
All participants were followed through record linkage with national death certification and hospital record linkage (ENCORE). Incident fatal and non-fatal CHD events were identified using the International Classification of Diseases, Injuries, and Causes of Death (ICD9 410–414 or ICD10 120–125). Endpoint data were collected between 1993 and 2007, with an average length of follow-up of 11 years.
Statistical analyses
Because of the resource-intensive requirements for data entry and analysis of 7DD, the 7DD have not been entered for all participants for analysis of nutrient and food components. A nested case–control sample was thus created for the present analysis of alcohol consumption in relation to CHD to enable direct comparison of the HLQ, FFQ and 7DD in the same individuals who had completed the three instruments. All individuals who reported prevalent CVD (CHD or stroke) or cancer at baseline examination were excluded. Incident CHD cases were matched with up to three controls based on sex, date of birth (within 3 years) and date of health check. Controls were free of CHD at the 2007 follow-up.
Categories of weekly alcohol intake were created to correspond to multiples of the average daily units: non-drinkers (zero intake of alcohol reported on the respective instrument), <7, 7–13, 14–20, 21–27 and ≥28 units/week. Owing to the small number of women who reported drinking ≥28 units/week on any of the instruments, the category for highest intake among women was collapsed at ≥21 units/week.
The distribution of categories of alcohol intake, based on the HLQ, FFQ and 7DD, was compared across cases and controls using the χ 2 test. To evaluate the consistency of alcohol categorization across the three instruments, weekly unit categories from the three methods were cross-tabulated, and Spearman’s rank correlation was calculated. The association between alcohol intake and risk of CHD was examined using logistic regression, wherein those identified as non-drinkers served as the reference group for each respective instrument. The logistic regression models were adjusted first for age, and then additionally for potentially confounding health and lifestyle covariates (BMI, physical activity, smoking history, social class, diabetes at baseline, family history of myocardial infarction and aspirin use). Lastly, the logistic regression models were adjusted for diastolic blood pressure, systolic blood pressure, LDL cholesterol, HDL cholesterol and TAG. A test for the trend was conducted by examining alcohol intake as a continuous variable in relation to the risk of CHD, with the highest intake level collapsed at 35 units/week. A test of the interaction between sex and alcohol intake (continuous, collapsed at 35 units/week) with respect to CHD was conducted for the HLQ, FFQ and 7DD; the significance was determined using the likelihood ratio test to compare nested models.
Pair-wise comparisons were conducted to test the null hypothesis of no difference in the associations of the DD, FFQ or HLQ alcohol and risk of CHD. The hypothesis was tested by comparing the test statistic, calculated as ![]() , with the quantiles of the standard normal distribution. β1 and β2 are the log odds ratio coefficients for CHD risk in relation to alcohol intake, and an estimate of the variance of the difference between β1 and β2 was calculated among 1000 bootstrap replicates that were drawn (with replacement) from the original nested case–control data. In these models, weekly alcohol intake from each instrument was entered into logistic regression models as a continuous variable, with potential high-intake outliers reassigned the value of 35 units per week. Statistical analyses were conducted with the SAS statistical software package version 8·0 (SAS Institute, Cary, NC, USA).
, with the quantiles of the standard normal distribution. β1 and β2 are the log odds ratio coefficients for CHD risk in relation to alcohol intake, and an estimate of the variance of the difference between β1 and β2 was calculated among 1000 bootstrap replicates that were drawn (with replacement) from the original nested case–control data. In these models, weekly alcohol intake from each instrument was entered into logistic regression models as a continuous variable, with potential high-intake outliers reassigned the value of 35 units per week. Statistical analyses were conducted with the SAS statistical software package version 8·0 (SAS Institute, Cary, NC, USA).
Results
Nested case–control characteristics
There were 2143 incident CHD events among men and 774 among women; among them, fatal CHD events occurred among 298 men and 138 women. CHD cases were older and had a higher average BMI, LDL cholesterol, TAG, systolic blood pressure and diastolic blood pressure relative to controls and reported a lower average weekly intake of alcohol on the 7DD, FFQ and HLQ than controls (Table 1). A relatively higher proportion of cases were male, reported diabetes mellitus at baseline, reported a family history of myocardial infarction, used aspirin for more than 3 months and were from a social class defined as manual compared with controls. Categorization according to smoking status and physical activity also differed between cases and controls. All of the aforementioned differences between cases and controls persisted after the sample was stratified by sex (data not shown).
Table 1 Health, lifestyle and demographic characteristics of CHD cases and controls within EPIC-Norfolk
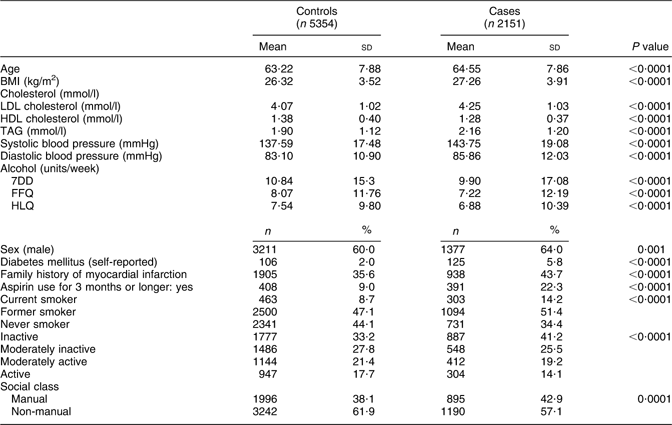
EPIC-Norfolk, European Prospective Investigation into Cancer in Norfolk; 7DD, 7 d diet diary; HLQ, Health and Lifestyle Questionnaire.
P values were calculated with t tests for continuous data and χ 2 tests for categorical values; all P values remained <0·05 after additional stratification by sex.
Alcohol intake based on the HLQ, FFQ and 7DD
For each instrument, the distribution of cases and controls according to drinking category is presented in Table 2. For men and women, the distribution of cases and controls was significantly different across levels of alcohol intake derived from the HLQ, FFQ and 7DD. Approximately 50 % of cases and controls were classified as having less than seven drinks per week (Table 2).
Table 2 Comparison of the distribution of alcohol intake categories by 7DD, FFQ and HLQ by CHD case–control status, stratified by sex
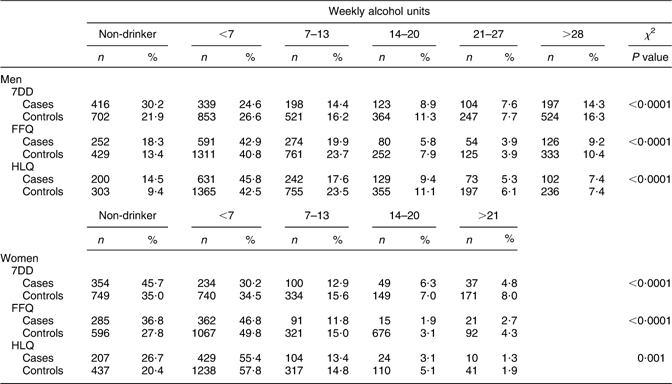
7DD, 7 d diet diary; HLQ, Health and Lifestyle Questionnaire.
The Spearman correlation values between the 7DD and FFQ, FFQ and HLQ and HLQ and 7DD among men were r = 0·77, 0·82 and 0·76 (P < 0·0001 for all r values), respectively. Among women, the values were slightly lower: r = 0·73, 0·74 and 0·70 (P < 0·0001 for all r values), respectively. The cross-tabulation of alcohol intake categories indicated that there was a high degree of consistency across instruments, particularly in the identification of non-drinkers and those in the highest drinking category. Between 75 % and 85 % were classified into the same extreme category in the HLQ, FFQ and 7DD (data not shown). There was less agreement across instruments when the mid-range of weekly intake categories was considered. For the second-highest alcohol intake category, between 19 % and 29 % were classified into this consumption category by two instruments. Among those who were identified as non-drinkers on the HLQ, fewer than 4 % reported more than seven drinks per week on either the 7DD or FFQ.
Alcohol intake and CHD risk
Among men, the association between alcohol intake and CHD risk was similar across the three dietary instruments (Table 3a). For all methods, there was an inverse association between alcohol intake and risk of CHD in models adjusted for age and for health and lifestyle factors. However, after adjustment for serum lipids and blood pressure, the inverse association detected for the HLQ estimates of alcohol intake was only marginally significant for men. Relative to non-drinkers, there was lower risk of CHD among men in nearly all categories of alcohol intake, especially before the inclusion of blood lipids and blood pressure as covariates in the models.
Table 3a Alcohol intake from the 7DD, FFQ and HLQ in relation to CHD incidence among men in EPIC-Norfolk
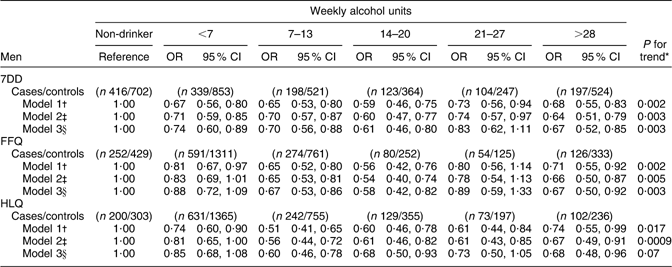
7DD, 7 d diet diary; HLQ, Health and Lifestyle Questionnaire; EPIC-Norfolk, European Prospective Investigation into Cancer in Norfolk.
*P for trend obtained by logistic regression analysis of CHD risk on alcohol intake (7DD/FFQ/HLQ) as a continuous variable, collapsed at 35 units/week.
†Logistic regression model 1 adjusted for age.
‡Logistic regression model 2 adjusted for age, BMI (<18·5, 18·5–24·9, 25·0–29·9, >30·0 kg/m2), physical activity (inactive/moderately inactive/moderately active/active), smoking history (current/former/never), social class (manual/non-manual), diabetes at baseline (yes/no), family history of myocardial infarction (yes/no) and aspirin use (yes/no).
§Logistic regression model 3 adjusted for covariates in model 2 plus diastolic blood pressure, systolic blood pressure, LDL cholesterol, HDL cholesterol and TAG.
The association between CHD risk and alcohol intake among women was broadly similar to what was observed among men (Table 3b). For the HLQ, FFQ and 7DD estimates of alcohol intake, there was an inverse association between alcohol intake and CHD risk; this association persisted in all multivariate models except for the FFQ, in which adjustment for blood lipids and blood pressure resulted in a marginally significant inverse trend. When individual alcohol intake categories were examined in relation to risk of CHD, the 7DD and the FFQ were similar. Both the lowest drinking category (<7 units/week) and the highest drinking category (>21 units/week) were consistently associated with decreased risk of CHD in models without adjustment for blood lipids and blood pressure.
Table 3b Alcohol intake from the 7DD, FFQ and HLQ in relation to CHD incidence among women in EPIC-Norfolk
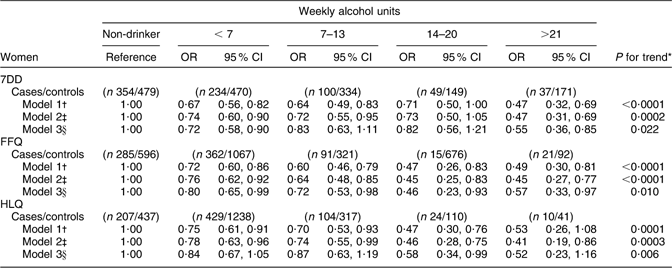
7DD, 7 d diet diary; HLQ, Health and Lifestyle Questionnaire; EPIC-Norfolk, European Prospective Investigation into Cancer in Norfolk.
*P for trend obtained by logistic regression analysis of CHD risk on alcohol intake (7DD/FFQ/HLQ) as a continuous variable, collapsed at 35 units/week.
†Logistic regression model 1 adjusted for age.
‡Logistic regression model 2 adjusted for age, BMI (<18·5, 18·5–24·9, 25·0–29·9, >30·0 kg/m2), physical activity (inactive/moderately inactive,/moderately active/active), smoking history (current/former/never), social class (manual/non-manual), diabetes at baseline (yes/no), family history of myocardial infarction (yes/no) and aspirin use (yes/no).
§Logistic regression model 3 adjusted for covariates in model 2 plus diastolic blood pressure, systolic blood pressure, LDL cholesterol, HDL cholesterol and TAG.
Pair-wise comparisons of risk of CHD in relation to weekly alcohol intake from the 7DD, HLQ or FFQ indicated that the results for each instrument were not significantly different from each other (data not shown). In relation to the risk of CHD, significant differences between men and women were present for the HLQ, FFQ and 7DD in the age-adjusted analysis (P = 0·008, 0·019 and 0·005, respectively). However, the interaction by sex was no longer significant for the 7DD or FFQ after adjustment for BMI, physical activity, smoking history, social class, diabetes at baseline, family history of myocardial infarction and aspirin use (P = 0·35 and 0·14), and the interaction for the HLQ was reduced to marginal significance (P = 0·065).
Discussion
Relative to non-drinkers, the risk of CHD in EPIC-Norfolk was generally lower among drinkers, with evidence of a decrease in risk across alcohol intake categories. Adjustment for physiological risk factors, such as serum lipids and blood pressure, slightly attenuated the association between alcohol intake and CHD risk, possibly because they may be part of the mechanism through which alcohol intake affects CHD risk. The results of the present study are consistent with the broader literature, indicating that there is a reduction in the risk of CHD associated with moderate alcohol intake. The association between alcohol intake and CHD was similar across all three methods of alcohol assessment.
Meta-analyses of observational studies indicate that the association between alcohol intake and risk of CHD is either inverse(Reference Maclure4) or J-shaped(Reference Di, Rotondo and Iacoviello3); the latter study found a higher risk of CHD among those who reported greater than fourteen drinks (113 g of alcohol) per week relative to non-drinkers(Reference Di, Rotondo and Iacoviello3). Another meta-analysis suggests that the drinking pattern influences the association between alcohol and risk of CHD while regular drinking is protective at all levels of consumption, irregular heavy consumption (‘bingeing’) is associated with greater risk of CHD(Reference Bagnardi, Zatonski and Scotti1). The majority of EPIC-Norfolk participants, particularly women, consumed less than fourteen drinks per week. Therefore, there may not have been sufficient numbers of heavy drinkers to detect a change in the direction of the association. Furthermore, relatively lower risk of CHD even in the highest level of alcohol intake may therefore suggest that EPIC-Norfolk is characterised by regular drinkers as opposed to binge drinkers, although it is beyond the scope of the present analysis to explore this proposal.
The consistency of the 7DD, HLQ and FFQ in the present analysis of alcohol and risk of CHD is aligned with the results of previous validation studies, in which good agreement was found among self-reported instruments(Reference Bingham, Gill and Welch26–Reference Pisani, Faggiano and Krogh31). Some of the correlation between self-reported instruments may be attributable to within-person error(Reference Nelson32). The accuracy of self-reported alcohol intake is likely to be influenced by social desirability(Reference Hebert, Ma and Clemow33, Reference Kubicka34), memory(Reference Kubicka34, Reference Schwarz and Oyserman35) and estimation of portion size when non-standard servings are consumed or when a drink is re-filled before it is fully emptied. However, the similarity between the estimates obtained with the HLQ and FFQ with respect to the 7DD suggests that limitations of participant’s memory or ability to estimate average intake were not highly influential in the present analysis of CHD and alcohol intake. Recent national estimates of weekly alcohol intake indicate that among 50–64-year-olds, 72 % of men drink up to 21 units/week; for women in that age group, 69 % drink up to 14 units/week(Reference Henderson, Gregoery and Irving36). Across the multiple alcohol assessments in EPIC-Norfolk, 76–87 % of men reported drinking up to 20 units/week and 85–96 % of women reported drinking ≤13 units/week. These estimates suggest that alcohol intake in EPIC-Norfolk is lower than the national average. Accordingly, the association with CHD could be shaped differently at higher intake levels if these analyses were repeated in a population with greater alcohol intake.
The association between alcohol intake and CHD risk obtained in the present analysis may be an underestimation of the true relationship, as there is likely to be some error in all of the dietary assessment methods(Reference Nelson and Bingham37) and in the application of the ICD codes to identify CHD events(Reference Lozano, Murrary and Lopez38). However, the error in CHD event diagnosis would not bias the comparison of different instruments for alcohol assessment. A limitation of the instruments that address a relatively short time span (24 h recall, prospective 7DD) is that they may reflect an atypical period that over- or under-represents usual intake. In addition, prospective dietary records may not be representative of usual intake due to reactivity, which refers to intentional or unintentional changes to dietary intake during the recording period(Reference de Castro39). A 2-year study of daily automated telephone reports of alcohol intake found a decrease in alcohol intake over time, and proposed that this reduction was due to participant reactivity(Reference Helzer, Badger and Rose40). However, this trend was not monotonic and variability appeared to be minor in the first few weeks; therefore the 1-week period of the 7DD may not have been long enough to cause a change in alcohol intake. In contrast to the 7DD, the FFQ and HLQ span a longer time period, but are limited by reliance on the participant’s memory(Reference Kubicka34, Reference Schwarz and Oyserman35) and ability to estimate average intake over time(Reference Kubicka34, Reference Del Boca and Darkes41). Within the present study, the 7DD had both the highest proportion of non-drinkers and the highest proportion of heavy drinkers relative to the other instruments, which suggests that issues regarding reactivity and an appropriate time frame for alcohol assessment are not straightforward.
Overall, the present results suggest that while the HLQ, FFQ and 7DD were not uniform in their assessment of alcohol intake levels, the differences in classification into alcohol intake categories did not affect the relationship with CHD outcome. The inverse association between alcohol and CHD that has been reported in prior epidemiological research is further supported by the results of the present study. Moreover, the association between risk of CHD and alcohol intake is sufficiently robust to yield similar results across a variety of alcohol assessment methods.
Acknowledgements
The present study was supported by the Medical Research Council. The authors declare that they have no conflict of interest. H.W. conducted the statistical analyses and drafted the manuscript. R.L. was responsible for follow-up and identification of cases. K.-T.K. and N.J.W. are principal investigators of EPIC-Norfolk and contributed to the manuscript. All authors read and approved the final manuscript. H.W. had full access to all of the data in the study and takes responsibility together with K.-T.K. Sheila Anne Rodwell (Bingham) was a principal investigator in the EPIC-Norfolk study and contributed to the conception of the present study. It is with deep regret that the authors note her death in June 2009.


