


I. Introduction
Another quiet revolution is taking place in the alcoholic beverage markets of the world's higher-income countries. As incomes have grown and with them a greater desire for healthy living, there has been a consumer tendency since the 1970s to move from quantity to quality of beverages. That has been reflected in the premiumization of the wine, beer, and spirits markets as per capita alcohol consumption has fallen. The more-recent revolution—again driven by consumers wishing to make healthier choices by lowering alcohol consumption—involves low- or no-alcohol (Lo-No) beverages that attempt, through new technologies, to have a flavor profile as equally attractive as their full-strength counterparts. This was applauded at the most recent World Health Assembly, which proposed in its Global Alcohol Action Plan ways to increase the uptake of Lo-No beverages (WHO, 2022, p. 21). According to IWSR, global sales in the Lo-No beverage category exceeded US$11 billion in 2022 and will increase by one-third by 2026, making it by far the fastest-growing segment of the alcohol beverage market (Dingwall, Reference Dingwall2022).
The Lo-No revolution, being part of a broader consumer trend that is focused on healthier lifestyles, is gradually becoming mainstream for at least two reasons. One is that, like the premiumization trend, it does not require consumers to abandon the social role that beverages play. Secondly, it is a win-win financially for both consumers and producers in jurisdictions where beverage excise taxes are higher for higher-alcohol products. Producers also benefit from providing lower-alcohol beverages insofar as it is acknowledged by health groups focused on lobbying for less indulgence in alcohol.
This quiet revolution, along with premiumization and lower-calorie trends, adds to four other beverage consumer trends over recent decades:
• the consolidation of producers into a small number of large corporations, initially within countries and then also through cross-border mergers and acquisitions,
• the embracing of globalization in the form of more export orientation and thus rising shares of national beverage consumption provided by imports,
• the associated convergence of national beverage mixes (shares of beer, wine, and spirits in total alcohol consumption) toward the global average, and
• the craft revolution as wealthier consumers seek out—in addition to higher quality—greater variety in their purchases than was available from the mass production of more homogenous products by large producers.
The purpose of this paper is to examine recent trends in the lower- and no-alcohol beverage sub-sectors. The trend is just beginning to show up in wine (and spirits) markets, but already the world's largest wine fair, ProWein, is to have for the first time a dedicated area for no- and low-alcohol wines at its 2023 event. Since the trend began developing much earlier in beer markets, this paper focuses on the extent of developments in that beverage sector and the consumer forces behind them. Australian brewers are leading the way globally in building various Lo-No beer categories, and thereby contributing substantially to the lowering of that nation's alcohol consumption, so its trends are highlighted and compared with global trends.
The paper begins, by way of background, with a review of earlier developments in global beer markets, so as to put in perspective the emerging Lo-No revolution. It then focuses on recent consumer sales globally and in Australia in the full-strength, mid-, low-, and no-alcohol beer categories, the forces behind those trends, and recent producer responses to these changes in demand. That is followed by a summary of how alcohol excise tax regimes affect beverage sales, which points to one way in which governments, via reform of alcohol consumer tax regimes, can nudge beverage markets toward lowering alcohol consumption. The paper concludes by drawing out lessons and prospects for lower-alcohol beer and wine.
II. Background: Impacts of new technologies, globalization, and increasing affluence on global beer markets
Several beer “revolutions” have occurred over the past dozen or so decades. Understanding the drivers behind them and the consequent beer market outcomes is helpful background for understanding the latest (Lo-No) revolution. The five that are highlighted are: national brewer consolidation, the emergence of multinational breweries, premiumization of beverages, a convergence of the national mixes of alcoholic beverages consumed toward the global average, and the desire for a greater variety of styles of beverages. The latter is manifesting itself in two ways: the craft beverage revolution and a rise in the share of imported products in national consumption. The Lo-No revolution is a natural extension of these developments.
A. National brewer consolidation to reap economies of scale
Since the late 19th century, the world has seen a long period of consolidation and homogenization in the world's beer-brewing sector, thanks to technological progress that generated large economies of scale in lager production as compared with ales (Tremblay and Tremblay, Reference Tremblay and Tremblay2005; Elzinga, Reference Elzinga2011; Elzinga, Tremblay, and Tremblay, Reference Elzinga, Tremblay and Tremblay2015). Brand promotion, too, became more cost-effective for larger firms in the 20th century, especially via mass media such as television. Hence, the number of breweries in each country shrank dramatically during the 20th century (Poelmans and Swinnen, Reference Poelmans, Swinnen, Caravaglia and Swinnen2017; Swinnen, Reference Swinnen2017; Swinnen and Briski, Reference Swinnen and Briski2017).
B. More brewer consolidation through cross-border mergers and acquisitions
More recently, globalization has improved opportunities for the most-efficient brewers to reap further economies of scale in production and marketing through cross-border mergers and acquisitions. By 2021, the world's top ten breweries accounted for two-thirds of the volume of beer sold (Table 1). The share of those multinational firms was just under one-half in 2012, one-quarter in 2002, and one-eighth in 1992. Beer is rapidly catching up with soft drinks in terms of the top two firms’ share of world sales volume. That share rose from 27% in 2012 to 37% in 2021 for beer while remaining steady at 63% for carbonated soft drinks. The increasing concentration is even more obvious for the top four firms, whose global share by 2021 had reached 50% for beer compared with 23% for spirits and 8% for wine (Figure 1).
Shares of top breweries in the global volume of beer production, 2012–2021 (%)

Source: Euromonitor International (2022).
Shares of the top four firms in global beverage sales volumes, 2012 and 2021 (%).
Source: Euromonitor International (2022).

Consolidation has been occurring equally rapidly in Australia. Three of those top ten global beer firms (A-B InBev, Asahi, and Kirin) have increased their combined share of Australia's beer sales volume from 67% in 2016 to 71% by 2021, with the next biggest being a much smaller family firm (Coopers) with just a 4% share. Meanwhile, in the United States, the top three (A-B InBev, Molson Coors, and Constellation) have a 79% share, and in the United Kingdom, the top four brewers have a 68% share (Euromonitor International, 2022).
C. Premiumization: The increasing consumer preference for quality at the expense of quantity
As incomes grow, people tend to consume more of many things, but as they reach satiation, they gradually switch their spending on some goods toward improving the quality rather than quantity of their purchases. This is evident in recorded alcohol consumption, which peaked globally in the mid-1970s at 5 liters of alcohol per adult (LAL per person over 14 years) per year before declining to 4 liters by the 1990s and even less in the present decade. Wine consumption globally has declined the most, followed by spirits consumption, while global beer consumption has remained steady at around 1.5 LAL, which is a little over 30 liters of beer per adult per year (Anderson and Pinilla, Reference Anderson, Pinilla and Holmes2021).
Meanwhile, the average quality of consumed beverages has been rising. This is evident, for example, in the replacement of much non-premium bulk or large-container wine with commercial premium wine in 750 ml bottles, and in the blossoming of the single malt category of whisky. In the case of beer, the share of consumption that is premium rose from 28% in 2011 to 43% in 2018 in Australia and from 24% to 37% in the United States.Footnote 1 Globally, it began to rise above 12% in 2010, and by 2021, it had reached 20% (Plato Logic, 2022). This tendency is shown for 80 countries for the years 2001–2015 in real values (in 2015 U.S. dollars) of total alcohol consumption per capita when plotted against aggregate expenditures per capita: an inverted U-shape prevails for volume but does not for value of alcohol consumption as national aggregate expenditure rises—and the same is true when the data are confined just to beer expenditure (Holmes and Anderson, Reference Holmes and Anderson2017).
Reasons for the decline in the volume of beer and other alcohol consumed, in addition to health and lifestyle changes, include ever-stricter drink-driving laws, random breath testing of car drivers, and changing gender roles. In Australia, younger people (Generations Y and Z) are the most inclined to engage in excessive/binge drinking (Srivastava and Zhao, Reference Srivastava and Zhao2010; Srivastava, Yang, and Zhao, Reference Srivastava, Yang and Zhao2022), yet in recent years that cohort has chosen to drink less. Furthermore, the share of Australians 18 years of age and older whose annual alcohol consumption exceeded lifetime risk guidelines fell from 22% in 2004–05 to 16% by 2017–18 (AIHW, 2022). Similar trends are appearing in the United States and Western Europe.
D. Convergence in the mix of alcoholic beverages
Those global averages hide much diversity across countries in their alcohol consumption mixes. Countries that in the 1960s were focused strongly on spirits consumption have switched more toward beer, and those that were focused strongly on beer consumption have switched more toward wine (Table 2 and Figure 2). Both sets of countries now have a mix of alcohol consumption more similar to the world average (Holmes and Anderson, Reference Holmes and Anderson2017, figs. 7 and 8). That is, there has been a convergence in national alcohol mixes as consumer preferences have homogenized in the process of globalization.
Shares of wine, beer, and spirits in total alcohol consumption volume, selected high-income countries, 1961–2019 (%)

Source: Author's compilation from data in Anderson and Pinilla (Reference Anderson, Pinilla and Holmes2021).
Beer, wine, and spirits consumption volume intensity indexesa for beer-focused and spirits-focused countries/regions,b 1961–2014.
aThe intensity index is defined as the fraction of wine, beer, or spirits consumption in total national alcohol consumption volume in country i divided by the fraction for that same beverage in world total alcohol consumption.
bBeer-focused: Australia, Austria, Belgium-Luxembourg, Canada, Denmark, Germany, Ireland, Malaysia, Mexico, Netherlands, New Zealand, Singapore, United Kingdom, United States, Other Eastern Europe, Other Latin America, Other African, and Middle East. Spirits-focused: Brazil, China, Finland, Hong Kong, India, Japan, Korea, Norway, Philippines, Russia, South Africa, Sweden, Taiwan, Thailand, Ukraine, Other Western Europe, Other Asia. Not included are the wine-focused countries of Algeria, Argentina, Bulgaria, Chile, Croatia, France, Georgia, Greece, Hungary, Italy, Moldova, Morocco, Portugal, Romania, Spain, Switzerland, Tunisia, Turkey, and Uruguay.
Sources: Compiled by Holmes and Anderson (Reference Holmes and Anderson2017) from data in Anderson and Pinilla (Reference Anderson, Pinilla and Holmes2021).

Australia was heavily focused on beer in the first six decades of its Federation, with beer's share of alcohol consumption peaking at 80% in 1958 and beer consumption per adult peaking in 1975 at 6.3 LAL (Anderson, Reference Anderson2020b). Since then, that share has halved, and even though wine's share has more than doubled, the nation's overall consumption of alcohol per adult has fallen by as much as in the rest of the world, that is, by more than one-quarter (Figure 3). Beer consumption per capita per year, having peaked in 1975 at 6.3 LAL per adult, is now only 3.0 LAL. As a result, Australia's share of the world's beer consumption fell from just over 2% during 1960–80 to 0.9% in recent years (Anderson and Pinilla, Reference Anderson, Pinilla and Holmes2021). Thus, beer moderation has been the key contributor to Australia's reduction in per capita alcohol consumption over the past half-century (Figure 4). The country's overall alcohol consumption is now just one-tenth above the OECD average, having declined more than twice as rapidly in the 2010s as in the average OECD country (by 11% compared with 4%, see OECD (2021)). And the share of alcohol consumed as beer is now the same in Australia as it is in the rest of the world, at two-fifths (Table 2).
Shares of beer, wine, and spirits consumption in total alcohol consumption, Australia and the world, 1960–2021 (LAL and %).
Sources: Updated from ABS (2019) and Anderson and Pinilla (Reference Anderson, Pinilla and Holmes2021).

Volume of alcohol from beer, wine, and spirits consumption per adult, Australia and the world, 1961–2021 (liters of alcohol per person over 14 years).
Sources: Updated from ABS (2019) and Anderson and Pinilla (Reference Anderson, Pinilla and Holmes2021).

One reason for the decline in beer and rise in wine consumption in Australia is the high rate of immigration from wine-drinking southern Europe. But another has to do with relative price changes: since the early 1980s, the retail wine price index has fallen by more than one-third relative to the overall consumer price index, while the beer and spirits price indexes have increased by about half (ABS, 2022). Much of that change in relative prices is due to differences in the way consumption of the three beverage types are taxed (see Section IV).
E. The desire for a greater variety of beverage styles: Via the craft revolution
One way that preferences for a greater variety of beverage styles have manifested themselves is in the craft beverage revolution. Craft breweries began to emerge in the 1970s, such that by the 1980s, in numerous high-income countries, the total number of breweries began to reverse its long-run decline (Caravaglia and Swinnen, Reference Caravaglia and Swinnen2017a). Soon thereafter, social media and consumer associations were able to spread information about craft beverages at little cost. The difficulties in securing finance and appropriate equipment were initial handicaps, but once enough early entrepreneurs succeeded (often following experiments in home brewing), more funding flowed from venture capitalists and via crowd-funding.
An indicator of the speed of this craft beer revolution is the growth in the number of breweries operating (Figure 5). In Australia, that number doubled between 2015 and 2019, from 360 to 740, according to Euromonitor International (2022), while it grew almost as fast from 2016 to 2021 in the United Kingdom (from 1,540 to 1,902 for independent breweries) and the United States (from 5,780 to 9,247). Many of those new breweries are tiny though, so the share of craft beer in the total volume of beer sales is small—although those shares have grown steadily each year, reaching 10% in Australia, 12% in Canada, and 13% in the United States by 2021. Other countries where their share exceeded 3% by 2021 are shown in Figure 6. Globally, craft beer accounted for less than 2% of the volume of global beer sales prior to 2009, but that share has since doubled, reaching 3.9% in 2021, according to Plato Logic (2022).
Growth in the number of breweries, selected countries, 2016–2021a (% change).
a Australia is 2015–2019.
Source: Euromonitor International (2022).

Share of craft beer in total beer sales, selected countries, 2016 and 2021 (%).
Source: Euromonitor International (2022).

Once it became clear that craft breweries were here to stay and were growing in number, traditional brewers began responding in several ways. One has been to develop their own craft-style beer brands, in some cases without disclosing the brand's connection to a large brewery. Another strategy has been to acquire emerging microbreweries (Caravaglia and Swinnen, Reference Caravaglia and Swinnen2017a, Reference Caravaglia and Swinnen2017b). A third strategy is developing a new range of profitable Lo-No beers that is more attractive than the earlier-developed but watery “light” category.Footnote 2
F. The desire for a greater variety of beverage styles: Via imports
Another way that demand for a greater variety of styles of beverages has been satisfied is through increased imports (Tremblay and Tremblay, Reference Tremblay, Tremblay, Caravaglia and Swinnen2017). Globally, the share of national beer production that is exported averaged less than 2% in the 1960s and 1970s, but it rose to 4.6% in the 1990s, 6.0% in the 2000s, 7.6% in the 2010s, and 8.8% in 2020–21 (Plato Logic, 2022).Footnote 3 Cross-border trade in beer has been able to grow with globalization's lowering of the costs of trading internationally and the concentration of production in the hands of ever fewer multinational brewers.Footnote 4
III. Responding to the demand for lower-alcohol beers
The demand for Lo-No beers is a natural extension of the developments summarized in the preceding section. New technologies are beginning to allow full-flavored beers with lower-alcohol levels to be marketed and sold at lower retail prices than their full-strength counterparts, thanks in many countries to lower rates of excise tax on those beers. They are thus proving to be a win-win for producers and consumers.
A. Range of alcohol contents
While the categories of lower-alcohol beers have varied through time and across countries, a consensus seems to be emerging. Where data permit, this report focuses on the following categories (based on official Australian definitions):
-
No-alcohol: ≤1.15% of alcohol by volume (ABV),
-
Low-alcohol: >1.15% but ≤3% ABV,
-
Mid-alcohol: >3% but ≤3.5% ABV, and
-
Full-strength: >3.5% ABV.
The alcohol content of “light” beers, which began to emerge during the 1980s and focused on calorie reduction (accomplished primarily by reducing the carbohydrate content but also by reducing the alcohol content), is usually >2% but ≤3.5% ABV, hence this category overlaps the low- and mid-strength beer categories.
B. Lo-No's potential beneficiaries
Consumers looking for new varieties/styles are pleased with this new development, as are those seeking lower-alcohol beverages for health, driver safety, and lifestyle reasons. So are some wine drinkers who are looking for substitutes for their preferred wines as global warming keeps raising the latter's alcohol levels (Alston et al., Reference Alston, Fuller, Lapsley, Soleas and Tumber2015) and as the wine industry only slowly develops appealing Lo-No wines. Some abstainers of alcohol may also be willing to try the new zero-alcohol beers. And many of those beer drinkers who previously sought out “light” beers but were disappointed by the bland, watery taste of many of them will be more enthusiastic about this new alternative.
Breweries stand to gain insofar as the net profits from Lo-No beer sales exceed those lost from the drop in sales of full-strength beer. The most obvious potential contributor to such an outcome is the excise tax regime, especially in those countries where duties are based on the alcohol content by volume (ABV) of each beverage so that Lo-No beers are subjected to less taxation. The situation is even more favorable—to consumers as well as producers—in jurisdictions such as Australia's that encourage the Lo-No revolution by imposing lesser tax rates per % ABV on lower-alcohol products (see Section IV).
C. Lo-No production methods
Typically, lower-alcohol beers have been produced through the thermal or physical separation of alcohol from regular beers. These methods appeal to brewers because they harness existing beer production and do not require much additional brew house capacity. The thermal separation technique makes use of the fact that the boiling temperature of alcohol is lower than that of the remaining beer solution. The physical separation technique uses reverse osmosis to collect materials across a semi-permeable membrane that separates alcohol and part of the water from a beer but does not remove larger molecules such as flavor compounds. Both methods normally require further re-formulation after the alcohol is removed to get an acceptable product.
To date, these methods have been more successful with beer than with wine, for two reasons. One is that regular beer starts with just one-third the ABV of wine, so less alcohol needs to be removed. The other is that wine relies on grape juice as its sole ingredient, whereas beer's aromas may be enhanced by perfumed hops that can help mask any undesired flavors derived from the de-alcoholizing process.
The equipment required to take on the techniques noted earlier is expensive, and additional skills are required to successfully manage these processes compared with conventional brewing. That is not a major constraint for large brewers, but these extra capital requirements do handicap small microbreweries, which helps explain why no-alcohol beers are not (yet) hugely cheaper than regular beers. However, attempts are under way to develop alternative technologies for them as well. For example, malt and hop extracts can now be used to formulate a highly drinkable alcohol-free beer without the requirement for brewhouse processes. Such alternative methods provide brewers with an opportunity to tailor their recipe to the exact color, flavor, and mouthfeel desired. Formulations from extracts also provide the product with a consistent profile from batch to batch.
D. Increasing Lo-No uptake
So far, brewers have been much quicker than distillers and winemakers in responding to this new Lo-No demand by fine-tuning or creating new techniques, developing new products, and mass-marketing them successfully. True, this development is still in its infancy, with the shares of no-alcohol, low-alcohol, and mid-strength beers respectively accounting in 2021 for just 2%, 0.7%, and 1% of the volume of global beer sales, according to Plato Logic (2022). However, that 3.7% total is nearly double the 2.0% from a dozen years ago, hence the interest in these categories’ further growth potential.
Australia has been among the leaders in the low- and mid-strength categories globally (although a laggard in the no-alcohol category). According to Plato Logic, the former two categories’ combined share in Australia was 23% in the 1990s and 28% in the 2000s, when it was only 1% in the rest of the world, and by 2021, those shares were over 30% for Australia (all but one-tenth of it mid-strength) compared with 2% for the world (Table 3). By contrast, when 2% of beer sales globally were zero alcohol in 2021, that category share in Australia was under 1%. Meanwhile, the share of full-strength beer in Australia's total beer sales volume has fallen from 79% in the 1990s to 75% in the 2000s and to 69% by 2021 (row 1 of Table 3).
Shares of volume of beer consumption that is Low- and Mid-alcohol (L&M), No-alcohol,a and Craft, Australia and the world, 1990–2021 (%)
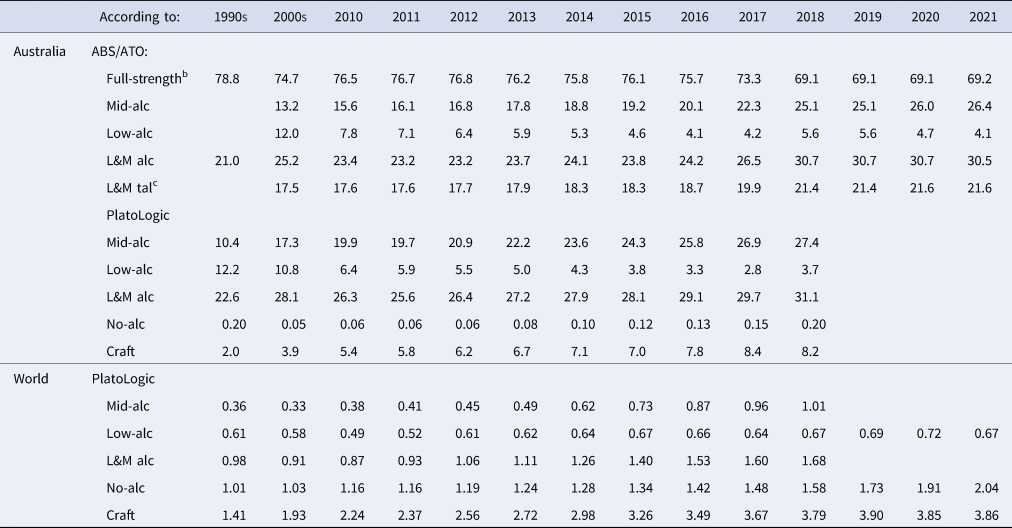
a For Australia, No-alcohol means ≤1.15% of alcohol by volume (ABV); Low-alcohol is >1.15% but ≤3% ABV; mid-alcohol is >3% but ≤3.5% ABV; and full-strength is >3.5% AVB. The break between low- and mid-strength in Plato Logic data is 2.8%, not 3%.
b The full-strength share is 100 less the ABS's L&M alc share less the No-alc share as estimated by Plato Logic, so it includes the Craft share.
c L&M tal is the share of total alcohol from beer that is consumed as low- or mid-strength beer, from ATO (2022).
The Australian shares of no-alcohol, low-alcohol, and mid-strength beers in national beer consumption are shown alongside those of other countries in Table 4. Of those countries, only New Zealand and the Netherlands have lower no-alcohol shares than Australia, only Germany and Sweden have had higher low-alcohol shares than Australia, and only Sweden has a substantial share like Australia (around one-quarter) of mid-strength beer.Footnote 5 The long-term trends for Australia since the mid-1980s are summarized in Figure 7. Overall annual sales volumes have been flat for more than three decades, and full-strength beer sales have been steadily declining. The combined share of low- plus mid-strength beers rose from 15% to 24% in the 1990s (when it was mostly “light” beer) before plateauing over the 2000s and then rising again in the 2010s to 31%. By then, the low-alcohol share had fallen to around 4% (with “light” making up perhaps half that) while the mid-strength share rose above 25%. Had the mix of beers in 2012–13 remained unchanged in the decade that followed instead of some substituting for lower-alcohol beers, an additional 3 million liters of alcohol (4% more) would have been drunk in 2021–22.
Shares of no-alcohol, low-alcohol, and mid-strengtha beers in total beer consumption, selected high-income countries and the world, 1991–2018b (%)
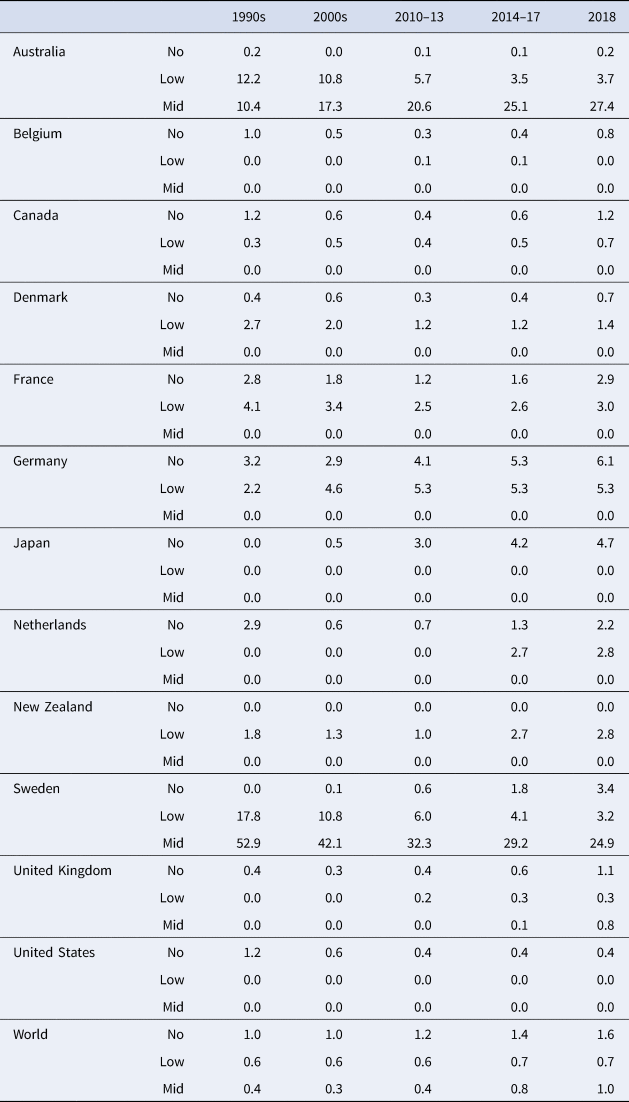
a The division between low- and mid-strength beer in this table is 2.8% ABV.
b In the three years after 2018, the World “No-” share rose to 1.7%, 1.9%, and 2.0%, respectively, while the “Low-” share stayed at 0.7%.
Source: Compiled from Plato Logic (2022).

IV. Excise taxation of beer, wine, and spirits
Beer consumption per person depends on many things, including per capita income, relative retail (tax-inclusive) prices, climate, culture, and religion (Colen and Swinnen, Reference Colen and Swinnen2016). Even if differences in income, VAT rates, and prices of other beverages are ignored, it is clear from Figure 8 that there is a negative association between beer excise taxes and the volume of beer consumption.
Beer consumption per adult per year (liters) and beer excise tax rate (% at the pre-tax wholesale price of US$2/liter), OECD and EU member countries, 2018.
Sources: Anderson (Reference Anderson2020a) for tax rates and Plato Logic (2022) for consumption levels.

In 2018, the ad valorem equivalent of the excise tax on the wholesale price of full-strength packaged beer was 81% in Australia, compared with percentage rates in the mid-50s for the United Kingdom, Ireland, and Sweden, 27% in Norway and 19% in Denmark (Figure 8). Tax rates are typically lower for on-trade tap beer than for packaged beers and for lower-alcohol beers (OECD, 2020; European Commission, 2020).
Recently, a proposal has been put forward to standardize the tax in the United Kingdom on all beer below 8.5% ABV at £19.08 per liter of alcohol (HM Treasury, 2021; Anderson and Wittwer, Reference Anderson and Wittwer2022). By contrast, lower-alcohol beers are taxed only slightly less than full-strength beers in Australia. That suggests a decrease in Australia's tax on and thus the price of mid- relative to full-strength beers would encourage more substitution away from full-strength beer, and possibly some also from wines and spirits (Fogarty, Reference Fogarty2010; Srivastava et al., Reference Srivastava, McLaren, Wohlgenant and Zhao2015). In so doing, overall alcohol and calorie consumption would decline, along with health costs and some other costs of antisocial and unlawful activities associated with binge drinking (Srivastava, Yang, and Zhao, Reference Srivastava, Yang and Zhao2022).
V. Lessons and prospects for lower-alcohol beer and wine consumption
The preceding analysis makes two things clear. First, increasing affluence is associated with less alcohol consumption but with higher-quality products and a wider variety of them. Second, globalization is leading to a concentration of beer production in a declining number of multinational breweries and increased international trade in iconic brands of beer. Both drivers (increasing affluence and globalization) may be temporarily halted or even reversed in the short term, however, due to higher inflation and interest rates and a possible recession while the war in Ukraine continues to generate policy and market uncertainty.
Growth in the Lo-No category is projected to continue by the International Wine and Spirits Research (Gilbert, Reference Gilbert2023). IWSR expects the category over all beverages—which is just 2% of the overall alcohol beverage market but just 0.4% of the on-trade—to grow by one-third (7% per year) between 2022 and 2026, compared with the 5% rate during 2018–22, with the no-alcohol sub-category accounting for 90% of that growth. Beer is the clear leader in this category, with more than 3% of its global sales already Lo-No. An increasing number of brands are likely to launch more lower-alcohol variants. The world's biggest beer brewer, for example, has set a goal of having at least one-fifth of its global beer output be lower-alcohol products by 2025 (https://www.ab-inbev.com/smart-drinking/smart-drinking-goals/). Should the current difference in the excise duties on mid- and full-strength beers be widened, that would open a further opportunity for this category.Footnote 6
How much impact the emergence of lower-alcohol beverages will have on overall global alcohol consumption is the subject of current research (Anderson, Kokole, and Llopis, Reference Anderson, Kokole and Llopis2021), but initial findings in Britain and Spain support the previously mentioned finding for Australia that it is leading to less alcohol consumption as drinkers substitute them for full-strength products rather than non-drinkers becoming (low-alcohol) drinkers (Llopis et al., Reference Llopis, O'Donnell, Kaner and Anderson2022; Anderson and Kokole, Reference Anderson and Kokole2022).
Even if this category's share of the Australian market were not to rise much more, its remarkable local success suggests there may be scope for Australia expanding its exports of this category. Australia's two largest producers, which are responsible for the mid-strength boom locally, have strong international connections on which to draw. True, those connections are mainly in East Asia, but the larger of those two local firms (now owned by Asahi) also has experience of very successfully developing the Fosters brand abroad. Australia's wine industry has also had great success exporting branded commercial premium products this century, with export sales accounting for 60+% of domestic wine production (almost all of which is full-strength). By contrast, currently less than 2% of Australian beer is exported (compared with a peak of 5% in 1988), suggesting huge scope for expansion.
The prospects for successfully producing lower-alcohol wine continue to depend on the development of new, affordable technologies. Current technologies are such that it is more costly to generate lower-alcohol wines than regular-alcohol wines, and, even so, to date, the former have not been able to match the perceived quality of the latter. Unless and until that changes through innovations, this is likely to remain a small niche part of global wine markets. Such innovation could be spurred, though, if excise duties were to become significantly lower for lower-alcohol wines in major markets.
Acknowledgments
The author is grateful to Karl Storchmann and an anonymous referee for helpful comments on an earlier draft.


 Open access