


Introduction
A large number of glaciers and ice-cap outlets in Svalbard have been either observed or inferred to have undergone surge activity (Liestøl, 1969; Dowdeswell and others, 1991; Hagen and others, 1993; Hamilton and Dowdeswell, 1996). However, it has been suggested recently that some Svalbard glaciers, which are known to have surged in the past, are no longer building up to new surges (Dowdeswell and others, 1995). This is probably a result of warming of the Arctic climate, and that of Svalbard in particular, since the termination of the cold period known as the Little Ice Age about 100 years ago (Dowdeswell, 1995). This shift to warmer conditions has led to consistently negative mass balances on the relatively large number of Svalbard glaciers for which measurements are available (Hagen and Liestøl, 1990; Lefauconnier and Hagen, 1990). This in turn has resulted in glacier thinning and increases in glacier vertical temperature gradients, with the result that some smaller ice masses have become predominantly cold-based, and now lack the active basal hydrological system that is assumed to be required to initiate high surge-phase velocities (Dowdeswell and others, 1995).
This paper investigates whether Finsterwalderbreen, a south Spitsbergen glacier which last surged at around the start of the 20th century, has retained a predominantly warm-based thermal structure and is continuing to build up mass for a future surge. Geometric and velocity changes on this glacier are investigated and, together with evidence on basal thermal structure, are used to examine whether or not this ice mass is likely to undergo renewed surge activity.
Study Area
The Svalbard archipelago (76–81∘ N, 11–31∘ E) is about 60% glacier-covered, and includes many surge-type glaciers (Hagen and others, 1993; Hamilton and Dowdeswell, 1996). Finsterwalderbreen, a valley glacier in southern Spitsbergen, last surged between 1898 and 1910 {Liestøl, 1969), and has been the subject of glaciological studies since 1950 (Hagen and Liestøl, 1990). It is presently about 11 km long (Fig, 1), with an extensive terminal moraine complex separating the glacier front from the coast of Van Keulenfjorden. In the upper regions are several nunataks which divide the glacier into a main basin and an eastern basin. At about 4 km from the present front a tributary glacier, Revtannbreen, joins the main glacier from the west (Fig. 1). There are also two minor tributaries to the cast, but these are separated from Finsterwalderbreen by large moraines, and appear to be stagnant. They are therefore not considered in this analysis.
A line of 13 survey stakes, F1–F13, was installed along the centre line of the main glacier (Fig. 1). In addition, three stakes were positioned on the eastern branch of Finsterwalderbreen (FE1–FE3) and two on the western branch,

Fig. 1. Map of Finsterwalderbreen, Svalbard, showing positions of stakes. Arrows at stakes show the magnitude and direction of annual velocities for 1994–95. Closed triangles indicate survey stations. Open circles indicate stakes used for 1950–52 velocity measurements. Inset shows location of Finsterwalderbreen and Vøringbreen within Svalbard.
Revtannbreen (FW1 and FW2). Two further stakes were installed to the east and west of stake F9 (F9E and F9W) to provide a cross-profile. Throughout this paper, up-glacier distances are given relative to the position of stake Fl, as the front has retreated by over a kilometre since the surge (Fig. 2).
Geometric Evolution Since The Surge
Finsterwalderbreen was first mapped photogrammetrically in 1898 by Hamberg (1905) and has since been mapped or surveyed by the Norwegian Polar Institute (NP) in 1920, 1936, 1950, 1964 and 1970. A map and a digital elevation model (DEM) have recently been produced by digital photogrammetry from aerial photographs taken for NP in 1990, and the 1970 map has also been digitised to allow detailed comparisons (Fox and Nuttall, 1997). The evolution of the glacier centre-line profile as derived from the maps is shown in Figure 2. For clarity, not all years are included, but Liestøl (1969) discusses all surveys up to 1964.
The glacier front advanced by 1.5 km and thickened by up to 100 m between 1898 and 1920. Above 430 m elevation, the glacier surface dropped by up to 50 m between these years, although these older maps are likely to be less accurate further up the glacier, as they were produced from oblique photographs. Since 1920, the terminus region of the glacier has thinned and retreated progressively, and it now has roughly the same form as in 1898, before the last surge. About 5 km up-glacier, a surface bulge appears to have developed since 1936, corresponding to a ridge on the glacier bed detected by low-frequency radio-echo sounding (Fig. 2). Here, the ice thins from 210 m to 120 m in less than a kilometre as it flows over the ridge. The bulge is not apparent on the 1898, 1920 or 1936 maps, but this may be due to mapping inaccuracies before the availability of vertical aerial photogrammetry. Since 1950, the surface profile of this central region of the glacier, from 320 to 500 m elevation, has remained relatively constant. Above 500 m, the glacier appears to have built up slightly between 1970 and 1990, the two years for which digital maps are available to enable accurate comparisons. This is confirmed by subtracting the 1970 DEM from the 1990 DEM to show the change in elevations over the whole glacier (Fig. 3). This indicates that above about 400 m elevation, the glacier has generally built up by up to 10 m. There are small areas around Tommeliten where there has been no build-up or even a slight lowering, which may be due to different accumulation or flow velocity patterns in this area.
Note that Liestøl’s profile for 1898 (i.e. shortly before the surge), which was taken directly from the 1898 photographs,
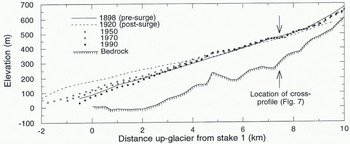
Fig. 2. Evolution of centre-line profile of Finsterwalderbreen since 1898. Glacier bed from radio-echo sounding.

Fig. 3. Change in elevation obtained by subtracting 1970 DEM from 1990 DEM. Dashed lines are contours at 100 m spacing (see Fig. 1).
shows a marked bulge at 2 km up-glacier. This bulge is not apparent on Hamburg’s map of Van Keulenfjorden (constructed from the same photographs), from which the profile in Figure 2 was extracted. Also note that the centre line used by Liestøl (1969) differs from that used in this paper, as it follows a line over the nunatak Tommeliten (Nixon and others, 1985).
Velocity Variations
Annual velocities
The annual surface velocities along the main profile, measured between April 1994 and April 1995, are shown in figure 4b. The velocity and angle of the ice movement at each stake are also illustrated as scaled arrows in Figure 1. Velocities near the snout (stakes Fl and F2) are very low at about 1 m a–1. The glacier is less than 100 m thick in this area (Fig. 4a), and hence the basal shear stress is low (Fig. 4c). Multi-frequency radar data suggest that it is frozen to the bed here (Ødegård and others, 1997). Up-glacier from F2, velocities increase steadily to over 12 m a–1 at stake F7. From F7 to F12 the velocities generally decrease. Basal shear stresses (calculated using a constant shape factor of 0.85, and surface slopes averaged over 1.5 km, or ten times the average ice thickness) also increase up-glacier from stake Fl, reaching a maximum of 95 kPa at F4. Above this, they steadily decrease to about 60 kPa, with variations due to changes in ice thickness and surface slope (Fig. 4a and c). The marked drop in velocity between stakes F12 and F13 is probably because the latter is located on the upslope side of a bergschrund.
The average annual velocities measured between summer 1950 and summer 1952 can be compared with contemporary velocities (Fig. 4b), although there are fewer data points, and the stakes were not in exactly the same locations (Fig. 1). From the glacier front up to stake F9, the 1994–95 velocities are consistently higher than the 1950–52 velocities, by up to 100% at F5. This increase may be caused by changes in the surface profile, as the front of the glacier has thinned by up to 60 m and is correspondingly steeper over this section (Fig. 4a). Other explanations for the changes could be adjustment towards dynamic equilibrium and changes in the thermal and hydrological regime of the glacier.
Seasonal velocity variations
As well as long-term changes on the scale of decades, variations in the flow rates of Finsterwalderbreen have been detected on a seasonal scale. Velocities during the summer (i.e. mid-April to late August 1994) were up to 15 m a.–1 higher than those over the winter (late August 1994 to mid-April 1995), the difference being greater in the central part of the

Fig. 4. (a) Surface and bedrock profiles measured by differential GPS (global positioning system) and low-frequency radar, spring 1994. The profile from the 1950 map is also shown. Profiles follow the line of stakes F1–F13 along the centre line (Fig. 1). (b) Annual velocities measured on centre line of Finsterwalderbreen in 1950–52 and 1994–96. Range bars on the latter indicate minimum and maximum values measured. (c) Surface gradient of 1990 profile (extracted from the DEM with 10 m spacing, and calculated over a window of 1.5 km or ten times the glacier thickness), and calculated basal shear stress.

Fig. 5. (a) Comparison of centre-line velocities measured over summer (April–August 1994) and winter (August 1994–April 1995). (b) Difference between summer and winter velocities. (c) Winter velocities expressed as a percentage of summer velocity.
glacier and less at the snout and the head (Fig. 5a and b). Winter velocities were as low as 10% of summer velocities near the snout, increasing to 50–60% near the head (Fig. 5c).
Thermal Regime
Evidence from radar and borehole data
Multi-frequency radio-echo sounding data were collected over much of the glacier in spring 1995 and clearly show the interface between cold and temperate ice. The data are supported by detailed thermistor measurements from boreholes, described by Ødegård and others (1997). These authors conclude that the glacier is at the pressure-melting point over most of the bed, with the exception of the terminal 500 m of the glacier, and that this temperate ice is over-lain by a cold layer 50–100 m thick over much of the glacier. At higher altitudes, however, there is a warm firn accumulation zone. It appears that a significant proportion of the accumulation at Finsterwalderbreen is from superimposed ice (Ødegård and others, 1997; Pinglot and others, 1997).
Evidence from hydrochemistry and hydrology
Hydrochemical and hydrological studies carried out during the 1994 and 1995 melt seasons indicate that solute levels and chemical weathering rates are high at Finsterwalderbreen (Wadham and others, 1997), and that large volumes of meltwater and suspended sediment were produced during these two seasons (Hodson and others, 1997). Both of these findings indicate that there is a well-developed basal drainage system beneath Finsterwalderbreen during the melt season, which would explain the increase in surface velocities during the summer, as basal sliding is enhanced by the presence of such a drainage system.
Mass Balance
Mass-balance measurements
Mass balance has been measured at Finsterwalderbreen intermittently since 1950 (Liestøl, 1976; Hagen and Liestøl,
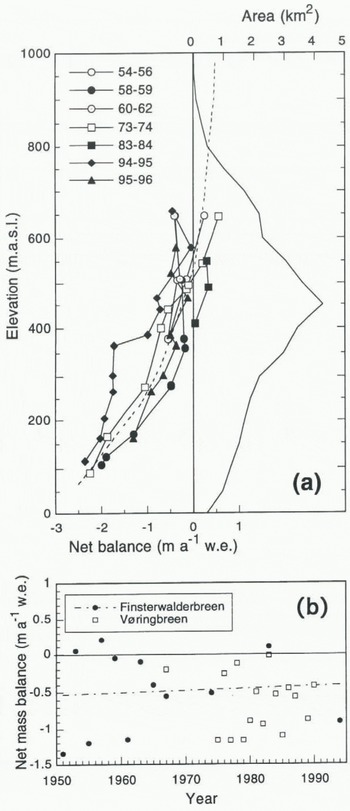
Fig. 6. (a) Mass-balance variation with elevation for Finsterwalderbreen 1950–94, and area–altitude distribution derived from 1990 DEM. Dashed line indicates average curve used in balance-flux calculations. (b) Total net mass balance for Finsterwalderbreen and Vøringbreen. Dashed line indicates regression line for Finsterwalderbreen.

Fig. 7. Cross-profile of Finsterwalderbreen surface and bed at approximately 470 m elevation measured by low-frequency radar and GPS. Average annual velocities measured across the glacier at stakes F9W, F9 and F9E (at about 450 m elevation) are also shown, joined by a polynomial curve fit. Range bars indicate minimum and maximum values measured.
1990). figure 6a shows curves of specific mass balance with altitude for various years, together with the glacier hypsometry derived from the 1990 DEM (excluding Revtannbreen). The total net mass-balance values are shown in figure 6b. Data from Vøringbreen (Fig. 1) are also plotted, as they cover many of the years when measurements were not made at Finsterwalderbreen (Hagen and Liestøl, 1990). Over the last 50 years, there has been no statistically significant trend in the total net mass-balance data as shown by the near-horizontal regression line for Finsterwalderbreen data points (Fig. 6b). An average of all balance–altitude curves was therefore used in the following balance-flux calculations (shown as a dotted line in figure 6a).
The measured mass-balance curves in figure 6a generally show similar gradients, although there is considerable interannual variability in the magnitude of the net balance at a given altitude, with a corresponding uncertainty in the calculated balance flux. The stakes at which balance measurements were made do not extend above 650 m in altitude, but the elevation range covered represents over 65% of the accumulation area. Spring snow measurements indicate little increase in accumulation above this elevation. Summer balance curves show a similar gradient to the net balance curves, and so the average balance curve used to calculate fluxes was extrapolated to higher elevations following the average gradient (Fig. 6a).
Balance flux
A low-frequency (6 MHz) radar profile was recorded across the width of the glacier at approximately the line formed by stakes F9W, F9 and F9E Fig. 7). The cross-sectional area of the glacier at this profile is 0.45 km2, and the average elevation of the surface is 470 m. To calculate the flux through this cross-section which would be necessary to maintain balance, the surface area up-glacier of the profile and the total specific mass balance for this area were calculated. From the area–altitude distribution (Fig. 6a), it was found that 14.9 km2 out of a total of 35 km2 is above 470 m elevation on the main glacier. Multiplying the area distribution curve with the average mass-balance distribution curve, and then summing, gave a total volume gained over this area of 4.14 x 10⁻³ km3 a–1 w.e. Hence, the depth-averaged ice velocity through the cross-section needed to maintain equilibrium is 10.2 m a–1 (assuming an ice density of 0.9 g cm–3). The ice velocities measured on a profile across the glacier at stakes F9W, F9 and F9E (averaged over three sets of annual velocity measurements) (Fig. 7) give a mean surface velocity of 7.2 m a–1, which is equivalent to a depth-averaged velocity of 6.1 m a–1, using a shape factor of 0.85 to compensate for bed friction. This gives an ice flux through the cross-section of 2.75 x 10⁻³ km3 a–1, which is a mass flux of 2.48 x 10⁻³ km3 a–1 w.e. Hence, it appears that the actual flux is only about 60% of the balance flux at present.
Discussion
The pattern of accelerated summer velocities seen on Finsterwalderbreen has been noted on many alpine glaciers (e.g. Hodge, 1974; Iken, 1978) but also in polar regions such as Alaska (Raymond and Harrison, 1988), Arctic Canada (Iken, 1974) and Greenland (e.g. Paterson, 1961; Andreasen, 1985). It was not, however, observed on the fast-moving Jakobshavns Isbræ in West Greenland (Echelmeyer and Harrison, 1990). It is commonly assumed that such seasonal velocity variations are primarily due to changes in the sub-glacial water pressure (Hooke and others, 1983; Willis, 1995) as a consequence of increased meltwater production.
This assumption has implications for the thermal regime of the glacier, as it requires that at least part of the bed is at the pressure-melting point (in order for subglacial water to be present), and that surface meltwater has access to the hydrological system at the bed. This requires, in turn, either that the ice column is temperate throughout, or that meltwater can penetrate cold surface ice via crevasses or moulins. Grevasses and moulins are seldom observed on Finsterwalderbreen, but a large proportion of the glacier has been inferred to consist of temperate ice (Ødegård and others, 1997).
The balance velocity of 10.2 m a–1 is slightly higher than the present depth-averaged velocity of 6.1 m a–1 (Fig. 7), which implies that the glacier is gaining mass in the accumulation area faster than it is being transported down-glacier. This would indicate that the glacier is gradually building up in the upper basin, which is confirmed by the slight increase in elevation between the 1970 and 1990 DEMs (Fig. 3). It appears that velocities in the upper basin were higher in 1950–52 than at present (Fig. 4b) and may have exceeded the balance velocity at the time. This may explain the slight drop in the surface profile in some parts of the upper basin between 1950 and 1970 (Fig. 2).
The average equilibrium line from the mass-balance curves is at about 500 m elevation (Fig. 6a). This agrees with the position of the equilibrium line determined from radioactivity measurements on ice cores, although the measurements were affected by problems with percolation and infiltration (Pinglot and others, 1997). Ødegård and others (1997) demonstrate that the pattern of accumulation is very complex, and hence the position of the equilibrium line is also complex. The map of elevation changes between 1970 and 1990 (Fig. 3) shows that there is a broad zone where the change is very close to zero between about 300 and 400 m elevation. The fact that this zone is at a lower elevation than the equilibrium line determined from mass-balance measurements could be due to several factors: A small error in the DEM elevation differences could cause a much larger horizontal error in the location of the zero-change zone, and hence in the elevation.
The mass-balance measurements may be consistently underestimating the accumulation, for example due to the accumulation of superimposed ice.
The glacier may not be in equilibrium, i.e. the flow is not compensating for the accumulation. In the region between 400 and 500 m elevation, the elevation has increased, whereas the measured mass balance is zero or negative, which implies that the down-glacier ice flux is insufficient to compensate for the mass gained upglacier. This may be related to the surge-type behaviour of the glacier.
The two main requirements for Finsterwalderbreen to surge again are thai it is gaining mass in the accumulation area, and that it has a predominantly temperate bed. It appears from the evidence above that it currently satisfies both criteria, and it may therefore be approaching a new surge. It has been reported from Scott Turnerbreen, a smaller valley glacier (6 km2) in Spitsbergen, that a consistently negative mass balance since the end of the Little Ice Age has resulted in this glacier, which surged in the 1930s, thinning to a point at which it has become frozen to the bed throughout, and thus is unable to surge again (Hodgkins, 1994; Dowdeswell and others, 1995). This is clearly not the case for the larger Finsterwalderbreen, but the quiescent phase of this glacier may have been lengthened by the consistently negative mass balance over the period of observations (Fig. 6b).
Conclusions
Since the last surge at the start of the 20th century, the geometry of Finsterwalderbreen has gradually evolved to a profile similar to the pre-surge topography of 1898.
Comparison of present-day balance and observed fluxes indicates that the mass being transported by ice flow is only about 60% of the mass gained in the upper basin.
Velocities in the upper basin appear to have decreased since 1950, but there has been no significant trend in mass balance. This may indicate that the actual flux has decreased relative to the balance flux.
Detailed comparison of DEMs from 1970 and 1990 shows that the glacier is building up in the upper basin by up to 10 m in 20 years.
Independent evidence from several sources (seasonal velocity variations, high-frequency radar profiles, borehole temperatures, hydrochemistry and hydrology) confirms that Finsterwalderbreen is at the pressure-melting point over much of the bed. Hence, Finsterwalderbreen, unlike some smaller surge-type glaciers in Svalbard, may be building up towards a new surge.
Acknowledgements
We thank O. Liestøl for permission to use unpublished maps and mass-balance and velocity data, A. J. Fox for painstaking compilation of the 1990 map and help with surveying, M. I. Kennett for collecting the radar data, and R. S. Ødegård, A. Fox and J. L. Wadham for assistance in the field. This work was supported by EU grant EN5V-CT93-0299.


