Hypovitaminosis D is a prevalent global public health problem causing a pressing need to address it promptly(Reference Hilger, Friedel and Herr1,Reference Edwards, Cole and Harvey2) . The occurrence of circulating 25-hydroxycalciferol (25(OH)D), the specific biomarker of vitamin D status, below 75 nmol/l is very common around the world(Reference Palacios and Gonzalez3). However, concentrations below 30 nmol/l indicating severe deficiency are most common in regions such as South Asia and the Middle East(Reference Edwards, Cole and Harvey2,Reference Mithal, Wahl and Bonjour4,Reference Lips, Cashman and Lamberg-Allardt5) .
Suboptimal vitamin D status is considered to impact the incidence of various health conditions such as poor bone health, muscle pain and weakness. There is a growing body of evidence indicating an association between low vitamin D status and increased risk of non-skeletal health outcomes, including CVD, hypertension, diabetes and certain malignancies(Reference Holick6,Reference Holick, Binkley and Bischoff-Ferrari7) . While vitamin D is mainly obtained via the cutaneous biosynthesis following exposure to ultra-violet B light, body requirement for this vitamin may not be fully met just by sun exposure due to many reasons, including latitude, air pollution, age, sex, darker skin pigmentation or personal behaviour influenced by widespread public health advice on the association of sun exposure with skin cancers(Reference Mithal, Wahl and Bonjour4).
According to WHO/FAO, in the lack of sufficient skin synthesis, maintenance of vitamin D adequacy must be achieved through dietary sources(Reference Dary and Hurrell8). However, the contribution of vitamin D intake from habitual diet is generally low and there is increasing evidence that the dietary supply is commonly insufficient to offset the deficit, especially during the winter months(Reference Grønborg, Tetens and Ege9). Consequently, additional attention is being paid to safe, applicable and efficient approaches to improve vitamin D intake in the general population such as supplementation(Reference Holick, Binkley and Bischoff-Ferrari7) and food fortification(Reference Del Valle, Yaktine and Taylor10). Although supplementation has been repeatedly shown to be effective in improving vitamin D status(Reference Tripkovic, Lambert and Hart11,Reference Whiting, Bonjour and Payen12) , this strategy may not be sustainable at community level even among high-risk subgroups due to cost and low compliance(Reference Datta and Vitolins13). There is, therefore, a need to establish and promote sustainable food-based strategies to improve vitamin D status in population subgroups, without increasing the risk of excessive intakes(Reference Grønborg, Tetens and Ege9,Reference Cashman and Kiely14,Reference Buttriss and Lanham-New15) . This issue has been, and continues to be, a challenge for health policymakers(Reference Green, Li, Whiting, Burckhardt, Dawson-Hughes and Weaver16).
Generally fortification and biofortification strategies are more sustainable and cost-effective, as compared with other community-oriented intervention approaches, and can be suitable for both developed and developing countries(Reference Chadare, Idohou and Nago17). Though findings from different studies altogether indicate the efficacy of vitamin D fortification in raising circulatory 25(OH)D concentrations in both adults and children(Reference Black, Seamans and Cashman18,Reference O’Donnell, Cranney and Horsley19,Reference Al Khalifah, Alsheikh and Alnasser20,Reference Brandão-Lima, Santos and Aguilera21) , technically there are still some issues to address for a mass fortification programme(Reference Buttriss and Lanham-New15). Among these, the possible effects of matrix of the food vehicle as well as consumers-associated factors including diet, initial vitamin D status and body weight are especially noticeable as they can affect vitamin D bioavailability(Reference Borel, Caillaud and Cano22,Reference Maurya and Aggarwal23,Reference Gleize, Hiolle and Meunier24) . Stability of vitamin D fortificant during processing is also challenging as some studies have reported up to 30 % and 50 % loss during heating in vitamin D-fortified cooking oils and flat breads, respectively(Reference Saghafi, Nikooyeh and Jamali25,Reference Nikooyeh, Neyestani and Zahedirad26) . Hence, new technologies of microencapsulation are being developed to overcome these problems(Reference Maurya, Bashir and Aggarwal27). These concerns are rising up the agenda for mandatory or voluntary food fortification programmes in a number of countries(Reference Dary and Hurrell8,Reference Calvo and Whiting28) . Notwithstanding, there are limited food vehicles suitable for vitamin D fortification which are consumed by the majority of the population. These include milk and milk products, margarines, bread, oils and fruit juices(Reference Calvo and Whiting29,Reference Cashman and O’Dea30) .
Several clinical trials on efficacy of vitamin D-fortified foodstuffs in adult subjects have been performed during the last two decades with different powers and qualities. The baseline vitamin D status of the participants, the latitude of the study place (that can affect endogenous vitamin D synthesis during the intervention period), the amount and the isoform of vitamin D fortificant used (D2 v. D3 and physiological v. pharmacological doses), the weight status of the participants and also the vehicle used for vitamin D fortification are among the factors causing conflicting results from those studies(Reference Mazahery and von Hurst31). To provide an updated evidence for future attempts by policymakers to reduce the burden of vitamin D deficiency and to evaluate whether vitamin D-fortified products can be an efficient strategy for tackling low vitamin D status, we conducted a meta-analysis of studies, including recently published ones, performed worldwide on the effect of vitamin D-fortified products on circulating 25(OH)D concentration according to age, sex, BMI, latitude vitamin D isoform (D2 v. D3) and the vehicle.
Methods
This meta-analysis was planned, conducted and reported according to the widely accepted quality standards(Reference Macleod, Tanriver-Ayder, Hair, Bespalov, Michel and Steckler32) and was registered at http://www.crd.york.ac./Prosperouk (registration no. CRD42020191749).
Description of the interventions
The interventions examined in this review were the foods fortified with vitamin D2 or vitamin D3 as a single ingredient or in combination with Ca. No limit was placed on the dose, type of vehicle or frequency at which fortified foods were taken.
Search strategy
A comprehensive search of electronic databases was conducted for eligible trials from January 2000 to July 2020. The following databases were covered: National Library of Medicine (PubMed), Scopus, Web of Science (WoS), Cochrane Database of Systematic Reviews (Cochrane Library, CDSR) and Google Scholar using the following search terms in titles and abstracts: (vitamin D OR cholecalciferol OR ergocalciferol) AND (fortification) AND/OR (fortified). All of the studies were limited to English language and those performed on humans.
Types of studies: inclusion and exclusion criteria
Two investigators separately searched and reviewed articles for eligibility via the following inclusion criteria: all studies had to have: (1) a randomised clinical trial design; (2) enrolled adults aged 18 years and older; and (3) data description as mean ± standard deviation and sufficient information on serum 25(OH)D concentrations at baseline and at the end of follow-up in each group or the net change values.
Studies were excluded based on the following criteria: (1) incomplete data; (2) duplicate publication of articles; (3) obscurely reported outcomes, or lack of control groups; and (4) non-interventional studies.
Types of interventions and outcome measures
We evaluated the effect of foods fortified with vitamin D2 or vitamin D3 alone or in combination with Ca v. unfortified foods or no intervention. Outcome measure was total serum/plasma 25(OH)D concentrations.
Data extraction and management
To review the articles, authors independently screened titles and/or abstracts to exclude studies which failed to meet the inclusion criteria and then obtained the full-text reports for further evaluations. Discrepancies were resolved through consensus. Detailed data of study design, context, participants’ information, interventions and outcomes were extracted.
For multi-armed studies, pairs of arms relevant to the review were compared. Data for the control group were used for each intervention group comparison. The weight assigned to the control group was reduced by dividing the control group number (n) by the number of intervention groups.
The selection process in sufficient detail to complete a PRISMA flow diagram is demonstrated in the Fig. 1 and Tables 1 and 2.
Flow diagram of the study.

Characteristics of the studies selected for analysis
(Mean values and standard deviations)

NM: Not mentioned
Demographic features and baseline variables of the studies selected for analysis
(Mean values and standard deviations)

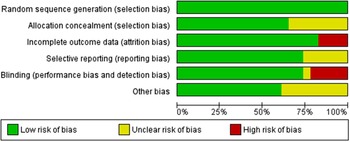
Assessment of risk of bias in included studies
Criteria for the assessment of study quality were the criteria outlined in the Cochrane Handbook for Systematic Reviews of Interventions (Reference Cumpston, Li and Page33), including random sequence generation, allocation concealment, blinding of participants, personnel and outcome assessment, incomplete outcome data, selective outcome reporting and other biases (bias due to problems not covered elsewhere, e.g. industry funding).
Assessment of reporting biases
Funnel plots were used to assess the potential existence of bias. We performed a regression asymmetry test for the detection of bias(Reference Egger, Smith and Schneider34); P < 0·10 was considered significant.
Subgroup analysis and investigation of heterogeneity
If we identified substantial heterogeneity and there were sufficient data, we would investigate this heterogeneity using subgroup analyses and sensitivity analyses.
The following subgroup analyses were carried out:
-
Duration of intervention
-
Type and dose of the fortificant
-
Population (gender and latitude of living place)
-
Type of the fortified food
Sensitivity analysis
The aim of the sensitivity analysis was to examine the effect size when including studies meeting less stringent inclusion criteria. If there were sufficient data to allow for sensitivity analysis, this analysis would be performed for examining the effects on results by excluding:
-
Trials at high risk of bias, as specified in the ‘Assessment of risk of bias in included studies’ section.
-
Trials with small sample size (less than 15 participants in each group);
Meta-regression
Random effects model meta-regression analyses were performed to assess the sources of inter-trial heterogeneity.
Statistical analysis
Meta-analysis was performed using STATA version 16.0 (StataCorp.). We did not report any dichotomous data. For continuous outcomes, a mean difference (MD) and 95 % CI were calculated for each study (i.e. intervention group minus control group differences). In addition, heterogeneity was assessed using Q test and I 2 test. The fixed effect model was used when there was no statistically significant heterogeneity (P > 0·1 and I 2 < 50 %), whereas a random effects model was employed on the contrary (P < 0·1 or I 2 > 50 %).
Results
Characteristics of the included studies
Figure 1 shows the study selection procedure. Our search identified 231 unique studies of which 208 did not meet our inclusion criteria, resulting in 23 papers included for the systematic review. Mean follow-up varied between 3 weeks(Reference Natri, Salo and Vikstedt35) to 2 years(Reference Daly and Nowson36). Of the twenty-three studies included, four were from North America(Reference Biancuzzo, Young and Bibuld37,Reference Johnson, Mistry and Vukovich38,Reference Tangpricha, Koutkia and Rieke39) including Canada(Reference Wagner, Sidhom and Whiting40), six from Asia(Reference Nikooyeh, Neyestani and Farvid41,Reference Nikooyeh, Neyestani and Zahedirad42,Reference Nik, ooyeh, Zargaraan and Kalayi43,Reference Kruger, Chan and Lau44,Reference Jafari, Faghihimani and Feizi45,Reference Shab-Bidar, Neyestani and Djazayery46) and the rest from Europe and Australia(Reference Natri, Salo and Vikstedt35,Reference Daly and Nowson36,Reference Bonjour, Benoit and Atkin47,Reference Bonjour, Benoit and Payen48,Reference Bonjour, Benoit and Rousseau49,Reference Bonjour, Dontot-Payen and Rouy50,Reference Green, Skeaff and Rockell51,Reference Grønborg, Tetens and Christensen52,Reference Kukuljan, Nowson and Bass53,Reference Manios, Moschonis and Mavrogianni54,Reference Tenta, Moschonis and Koutsilieris55,Reference Toxqui, Blanco-Rojo and Wright56,Reference Tripkovic, Wilson and Hart57) (Table 1).
Participants
Table 1 provides details of the eligible studies that evaluated the effect of fortified foods with vitamin D on circulating 25(OH)D concentrations. Twelve studies were conducted in women(Reference Natri, Salo and Vikstedt35,Reference Kruger, Chan and Lau44,Reference Jafari, Faghihimani and Feizi45,Reference Bonjour, Benoit and Atkin47,Reference Bonjour, Benoit and Payen48,Reference Bonjour, Benoit and Rousseau49,Reference Bonjour, Dontot-Payen and Rouy50,Reference Green, Skeaff and Rockell51,Reference Grønborg, Tetens and Christensen52,Reference Manios, Moschonis and Mavrogianni54,Reference Toxqui, Blanco-Rojo and Wright56,Reference Tripkovic, Wilson and Hart57) and only two in men(Reference Daly and Nowson36,Reference Kukuljan, Nowson and Bass53) . Subjects with type 2 diabetes were enrolled in three studies(Reference Nikooyeh, Neyestani and Farvid41,Reference Jafari, Faghihimani and Feizi45,Reference Shab-Bidar, Neyestani and Djazayery46) . The number of participants included in trials was 2002 (1173 in the intervention group and 829 in the control group). All trials but four studies(Reference Johnson, Mistry and Vukovich38,Reference Tangpricha, Koutkia and Rieke39,Reference Kukuljan, Nowson and Bass53,Reference Toxqui, Blanco-Rojo and Wright56) reported BMI of participants at baseline. Only three studies were conducted in participants who were initially vitamin D insufficient(Reference Natri, Salo and Vikstedt35,Reference Bonjour, Benoit and Atkin47,Reference Bonjour, Benoit and Payen48) , and vitamin D status was not among the inclusion criteria in other studies.
Mean baseline serum 25(OH)D concentrations across the trials ranged from 19·2 (sd 6·7) nmol/l(Reference Bonjour, Benoit and Payen48) to 83·6 (sd 32·7) nmol/l(Reference Kukuljan, Nowson and Bass53) in the subjects of the intervention groups and from 16·2 (sd 3·1) nmol/l(Reference Bonjour, Benoit and Payen48) to 85·7 (sd 40·3) nmol/l(Reference Kukuljan, Nowson and Bass53) in those of the control groups.
Intervention and control groups
The range of dose of vitamin D used as fortificant was 100 /d(Reference Bonjour, Benoit and Rousseau49) to 4000 IU/d(Reference Wagner, Sidhom and Whiting40). Ten trials applied vitamin D plus Ca (100 mg/d to 1200 mg/d)(Reference Daly and Nowson36,Reference Nikooyeh, Neyestani and Farvid41,Reference Kruger, Chan and Lau44,Reference Bonjour, Benoit and Atkin47,Reference Bonjour, Benoit and Payen48,Reference Bonjour, Benoit and Rousseau49,Reference Bonjour, Dontot-Payen and Rouy50,Reference Kukuljan, Nowson and Bass53,Reference Tenta, Moschonis and Koutsilieris55) . Most trials (twenty-one out of twenty-three) used dairy products as the vehicles for vitamin D fortification. With the exception of two studies in which control group received no intervention(Reference Bonjour, Dontot-Payen and Rouy50,Reference Kukuljan, Nowson and Bass53) , all other included studies used unfortified foods as a placebo for control group.
Risk of bias in the included studies
All trials provided data on losses to follow-up; only four reported losses of >10 %(Reference Daly and Nowson36,Reference Biancuzzo, Young and Bibuld37,Reference Kruger, Chan and Lau44,Reference Bonjour, Benoit and Atkin47) . In eight trials, the information on the methods used for allocation concealment was unclear(Reference Natri, Salo and Vikstedt35,Reference Daly and Nowson36,Reference Johnson, Mistry and Vukovich38,Reference Wagner, Sidhom and Whiting40,Reference Kruger, Chan and Lau44,Reference Bonjour, Benoit and Rousseau49,Reference Green, Skeaff and Rockell51,Reference Manios, Moschonis and Mavrogianni54) . Two trials reported small sample size (< 15 subjects in each arm)(Reference Natri, Salo and Vikstedt35,Reference Wagner, Sidhom and Whiting40) (Figs. 2 and 3).
Risk of bias graph: review authors’ judgements about each risk of bias item presented as percentages across all included studies.

Summary of the risk of bias for each study.

Effects of interventions
Serum 25(OH)D concentrations
Twenty-three trials compared vitamin D alone or combined with Ca with control. From five trials two pairs of arms and from one study four arms relevant to the review were compared. Pooled data comparing vitamin D with or without Ca with control showed statistically significant effect on circulating 25(OH)D concentrations (2002 participants, MD: 25·4 nmol/l, (95 % CI 19·5, 31·3) (Fig. 4).
Forest plot of the effect of vitamin D2/D3-fortified foods (with or without calcium) compared with control on absolute mean change.

Subgroup analyses
We conducted stratified analyses according to duration of intervention (less than 12 weeks v. 12 weeks and more), vehicle (dairy product, juice, grain product, oil and dairy together with grain products), isoform of the vitamin (D3 v. D2) and dose of the fortificant (≥ 1000 IU/d v. < 1000 IU/d). We found a statistically significant effect in the subgroups of all studies with all doses used for fortification (both more than and less than 1000 IU/d). However, the effect was significantly stronger in those trials that used more than 1000 IU vitamin D a day (>1000 IU, MD: 41·5 nmol/l, (95 % CI 33·0, 50·0) v. < 1000 IU, MD: 18·2, (95 % CI 12·7, 23·7), P < 0·001) (Fig. 5).
Forest plot of subgroup analysis of the effect of vitamin D-fortified foods (with or without calcium) compared with control on absolute mean change.

There was no difference between trials that used vitamin D2 or D3 as fortificant (MD: 27·9 nmol/l, (95 % CI 19·3, 36·4) v. MD: 25·2 nmol/l, (95 % CI 18·7, 31·7), P = 0·62). However, it is noteworthy that only two trials (three arms) assessed the effect of vitamin D2 (Reference Biancuzzo, Young and Bibuld37,Reference Tripkovic, Wilson and Hart57) (Fig. 5).
The subgroup analysis by duration of intervention (less than 12 weeks v. more than 12 weeks) and type of vehicle (dairy product, juice, grain product, oil and combination of dairy and grain products) also indicated significant effect of fortification with vitamin D on circulating 25(OH)D concentrations (Fig. 5).
Thirteen trials included both men and women and showed better effect compared with those trials that included just women (MD: 35·3 nmol/l, (95 % CI 23·7, 47·0) v. MD: 19·3 nmol/l, (95 % CI 14·4, 24·1), P = 0·01) (Fig. 6).
Forest plot of subgroup analysis (based on sex of participants and latitude of study location) of the effect of vitamin D-fortified foods (with or without calcium) compared with control on absolute mean change.

We also conducted stratified analyses according to the latitude of place wherein trials had been performed. Most of the trials were conducted in countries located in latitude higher than 35o. The treatment effect was better in trials from countries located in lower than 35o. However, no differing patterns were clearly evident between these subgroups (χ 2 3·65, P 0·06) (Fig. 6).
Sensitivity analysis
We excluded trials at high risk of attrition bias (> 10 % loss to follow-up) in order to assess whether this exclusion could affect the overall results. However, the analyses demonstrated very similar findings (MD: 26·1 nmol/l, (95 % CI 19·2, 32·9)). Excluding the trials with small sample size (less than 15) from each arm made no remarkable change in the overall results (MD: 24·5 nmol/l, (95 % CI 18·7, 30·2)).
Meta-regression
The meta-regression revealed a significant association between age of participants (β -0·48, (95 % CI -0·67, -0·29), P < 0·001), baseline circulating 25(OH)D concentration (β -0·47, (95 % CI -0·72, -0·22), P < 0·001) and dose of the fortificant (β 0·02, (95 % CI 0·01, 0·02), P < 0·001) with the difference in circulating 25(OH)D concentrations between intervention and control groups. The BMI of participants at the beginning of the study (P = 0·321) and latitude of location (P = 0·096) did not significantly influence the between-group difference of 25(OH)D concentrations. The analysis showed that circulating 25(OH)D concentrations increase by 2 nmol/l for every 100 IU of vitamin D after adjustment for age, BMI, baseline circulating 25(OH)D concentration and latitude (Table 3).
Multivariate meta-regression models
(Coefficients and 95 % confidence intervals)

The results of the meta-analysis demonstrated a quadratic, dose–response relationship between treatment effect and circulating 25(OH)D concentrations at baseline with higher effects in participants with lower initial 25(OH)D concentrations (Fig. 7).
Association between treatment effect and 25(OH)D concentrations (nmol/l) at baseline.

The meta-regression in subgroups of studies that had baseline 25(OH)D lower than 50 nmol/l showed an increment in circulating 25(OH)D concentrations by 3 nmol/l for every 100 IU of vitamin D after adjustment for age, BMI and latitude.
Analyses of bias risk
A regression asymmetry test to the analysis of the bias risk of publications showed no significant evidence of bias (P = 0.670).
Discussion
The findings of this meta-analysis showed that foods fortified with vitamin D, either alone or in combination with Ca, are effective means to improve vitamin D status of the consumers in a dose-dependent manner, that is, fortificant dose of 1000 IU or more a day is more effective. However, it should be noted that all the studies included in this meta-analysis were conducted under controlled conditions, that is, certain amount of the fortified food for a limited period of intervention. For a mass fortification programme, therefore, determination of the fortificant dose is crucial for which several questions must be answered including the vitamin D status of the target population and the goal concentration of 25(OH)D that must be attained by fortification(Reference Pilz, März and Cashman58).
Our analyses failed to show a superiority of vitamin D3 over D2 as a fortificant. The efficacy of these two isoforms has been the subject of several supplementation studies, most of which reported the higher efficacy of D3 (Reference Shieh, Chun and Ma59,Reference Shieh, Ma and Chun60,Reference Batacchi, Robinson-Cohen and Hoofnagle61,Reference Tripkovic, Lambert and Hart11) . However, these studies commonly used high-dose, low-frequency supplement intake. The shorter half-life of 25(OH)D2, compared with 25(OH)D3, may partly explain the higher efficacy of D3 supplementation(Reference Jones, Assar and Harnpanich62). Furthermore, at least one study found the daily vitamin D supplementation, as compared with weekly and monthly, was more effective in improving vitamin D status of the elderly subjects(Reference Chel, Wijnhoven and Smit63). Along the same line, a fortification study using daily intake of low dose of both D2 and D3 as fortificants did not find any significant difference between these two isoforms in raising circulating 25(OH)D concentrations(Reference Fisk, Theobald and Sanders64). Nevertheless, this finding should be interpreted cautiously due to paucity of the fortification studies that have compared the efficacy of D2 v. D3.
Our findings indicate that duration of vitamin D-fortified product consumption longer than 12 weeks does not result in more increment in 25(OH)D concentration. The active metabolite of vitamin D, 1, 25(OH)2D, is under homeostatic control. While increasing 25(OH)D following consumption of a fortified product will cause a shift to 1, 25(OH)2D production, an increase in 1, 25(OH)2D will induce metabolic clearance of 25(OH)D(Reference Halloran and Castro65). Consequently, once 25(OH)D reaches to its maximum concentration, continuation of vitamin D-fortified food consumption will just maintain the serum levels. This issue is especially important for a successful fortification programme as the half-life of 25(OH)D is just about 2–3 weeks(Reference Zerwekh66).
Choosing a proper vehicle for fortification is a very critical issue for which several aspects must be taken into consideration including coverage and consumption of the fortified products as well as bioavailability issues(Reference Neufeld, Baker and Garrett67,Reference Dary and Hurrell8) . While dairy products may be one of the best choices for fortification(Reference Zahedirad, Asadzadeh and Nikooyeh68), especially in the countries with high milk consumption per capita(Reference Itkonen, Erkkola and Lamberg-Allardt69), our analyses showed less efficacy of dairy products in terms of raising circulating 25(OH)D concentrations than oil, fruit juice and grain products. We have no explanation for this finding at present. Notwithstanding, we found out that the mean baseline 25(OH)D concentration in the studies of fortified dairy products was significantly higher than other studies (51 (sd 17·4) v. 40·4 (sd 6·9) nmol/l, P = 0·049). This may, at least in part, explain the reason of this observation. Though juices may be considered as a good vehicle for market-driven fortification, it can hardly be considered as a suitable vehicle for mass fortification due to its sugar content and also various consumption patterns among different population subgroups(Reference Duffett70,Reference Francou, Hebel and Braesco71) . Edible oils, on the other hand, could be a suitable choice for fortification with certain micronutrients including vitamin D with the advantage of broad population coverage in many countries(Reference Cashman and O’Dea30,Reference Raghavan, Aaron and Nahar72,Reference Aaron, Friesen and Jungjohann73) . However, high diversity of both amount and type of household edible oils in most countries may potentially cause several technical problems for using them as a vehicle in a mass fortification programme(Reference Gould and Lin74,Reference Cashel and Greenfield75,Reference Pot, Prynne and Roberts76) . Moreover, due to scarcity of evidence on efficacy of vitamin D-fortified cooking oils, more studies are warranted. Nevertheless, edible oils can be considered as appropriate vehicles for market-driven fortification thus contributing in overall amount of vitamin D intake(Reference Yang, Laillou and Smith77). Grain products including bakery wheat flour, on the other hand, can be regarded as an appropriate vehicle for vitamin D fortification, especially in the countries wherein bread is a staple food and there is an ongoing flour fortification programme for other micronutrients like Fe and folate(Reference Nikooyeh, Neyestani and Zahedirad42,Reference Mocanu, Galesanu and Vieth78) .
The results of this meta-analysis revealed more efficacy of those fortification studies whose subjects were of both sexes than the studies conducted just on women. This may, at least in part, be explained by the higher percentage of body fat mass in women than in men(Reference Karastergiou, Smith and Greenberg79) and the inverse association between percentage of fat mass and circulating 25(OH)D(Reference Carrelli, Bucovsky and Horst80,Reference Oliai Araghi, van Dijk and Ham81) .
We found an inverse association between age and the initial circulating 25(OH)D concentrations of the participants and the rise in serum 25(OH)D concentrations following the consumption of vitamin D-fortified foods. The effect of age on vitamin D metabolism is especially noticeable as decreased dermal synthesis and intestinal absorption of vitamin D due to ageing have already been documented(Reference Russell82,Reference Gallagher83) . As dietary intake may decrease with ageing(Reference Morley84,Reference Engelheart and Akner85) , D fortification of foodstuffs may be less efficient in the elderly people. Effectiveness of vitamin D-fortified foodstuffs in this age group needs more investigations. The effect of initial (pre-intervention) concentration of serum 25(OH)D on the amount of rise of circulating 25(OH)D following vitamin D intake has been already reported and reconfirmed recently(Reference Nikooyeh, Neyestani and Farvid86,Reference Žmitek, Hribar and Hristov87) . Actually, this is a homeostatic mechanism through which the enzyme 24-hydroxylase is activated whenever the conversion of 25(OH)D to its active form 1, 25(OH)2D reaches to its threshold, whereby catabolism of both metabolites is enhanced(Reference Gil, Plaza-Diaz and Mesa88).
Several dose–response studies have reported various amounts of 25(OH)D rise following vitamin D intake (mostly in the form of supplement). One study reported an average of 1·2 nmol/l increase in serum 25(OH)D for every 100 IU vitamin D in supplementation interval of 0–1000 IU/d(Reference Ekwaru, Zwicker and Holick89), whereas another study suggested 5 nmol/l increase per 100 IU/d(Reference McKenna and Murray90). However, as mentioned earlier, the response to vitamin D intake is influenced by initial concentrations of 25(OH)D, age and BMI(Reference Gallagher83,Reference Žmitek, Hribar and Hristov87,Reference Ekwaru, Zwicker and Holick89) . Therefore, our estimation of 2 nmol/l increase in 25(OH)D concentration for every 100 IU vitamin D intake per d, which is adjusted for all these variables, seems reasonable for designing mass fortification programmes.
Conclusion
With the high occurrence of vitamin D deficiency and commonly inefficient direct sun exposure around the world, we should inevitably rely on dietary approaches, including supplementation and food fortification, to improve vitamin D status of the general population. While supplement use has the disadvantages of potential risk of overdosing and poor adherence for several reasons including high costs which makes it less sustainable strategy(Reference Pilz, März and Cashman58), food fortification is indicated as the most sustainable and cost-effective approach to improve nutritional status of the whole community(Reference Buttriss and Lanham-New15). A study from the USA reported that 3·2 % of the general population use vitamin D supplements at high doses, that is, ≥100 μg (4000 IU)/d(Reference Rooney, Harnack and Michos91). Nevertheless, food fortification has some disadvantages including lower effectiveness than supplements due to low consumption of the fortified foods in some subpopulations and/or suboptimal amount of the fortificant in the vehicle. The establishment of the effective dose of vitamin D fortificant considering its upper tolerable intake level and also selecting a suitable staple food(s) as a vehicle(s) is, therefore, necessary for a successful mass fortification programme(Reference Olson, Gavin-Smith and Ferraboschi92). Our findings showed that vitamin D fortification of foodstuffs is an effective strategy to combat vitamin D deficiency, though the circulating 25(OH)D response to vitamin D-fortified food consumption can be under the influence of age, BMI and the baseline 25(OH)D concentrations. Notwithstanding, an average increase of 2 nmol/l increase in circulating 25(OH)D concentration for each 100 IU vitamin D intake per d is expected for general adult population. These findings can be beneficial for policymakers to tackle vitamin D deficiency through food fortification strategy.
Acknowledgements
Not applicable
This research received no specific grant from any funding agency, commercial or not-for-profit sectors.
B. N., with the aid of T. N., designed the study and performed the searches and data extraction. T. N. and B. N. analysed and interpreted the data and were major contributors in writing the manuscript. Both authors read and approved the final manuscript.
The authors declare that there are no conflicts of interest.