


Phytate represents the primary storage form of P in plant seeds. It is defined as any salt of phytic acid (myo-inositol 1,2,3,4,5,6-hexakis (dihydrogen phosphate) or InsP6). The utilisation of InsP6-P depends on InsP6 hydrolysis because P absorption occurs mainly as orthophosphate( Reference Greiner and Konietzny 1 ). InsP6-hydrolysing enzymes such as phytases (myo-inositol hexakisphosphate phosphohydrolases) catalyse the hydrolytic cleavage of InsP6 and its salts via several phosphorylated intermediary products (myo-inositol pentakis-, tetrakis-, tris-, bis- and monophosphate) down to myo-inositol. The International Union of Pure and Applied Chemistry/International Union of Biochemistry differentiates among three types of phytases: 3-phytases (EC 3.1.3.8), 4-/6-phytases (EC 3.1.3.26) and 5-phytases (EC 3.1.3.72), a classification that refers to the initiating position on the inositol ring during in vitro InsP6 dephosphorylation. The 6-phytases usually originate from plants and initiate hydrolysis at the d-4 (l-6) position of InsP6 ( Reference Cosgrove 2 ); 3-phytases are usually of microbial origin (starting hydrolysis at the d-3 (l-1) position), such as the fungal Aspergillus niger phytase( Reference Skoglund, Näsi and Sandberg 3 – Reference Greiner, da Silva and Couri 5 ) or the bacterial Pseudomonas phytase( Reference Cosgrove 2 ). However, Escherichia coli phytase as an exception was characterised as a 6-phytase (starting hydrolysis at the d-6 (l-4) position)( Reference Greiner, Konietzny and Jany 6 , Reference Greiner, Carlsson and Alminger 7 ). We are not aware of any study that has investigated whether this in vitro-based classification is reflected also in the pathways of InsP6 degradation in the more complex and variable environment of the digestive tract of broilers.
InsP6-P has long been assumed to be poorly used by avian species because of the lack of sufficient endogenous InsP6-hydrolysing enzymes and the denaturation of intrinsic plant phytases in the stomach and during feed manufacture. In broilers, although the activity of endogenous mucosal phytase in the small intestine has been described( Reference Maenz and Classen 8 – Reference Abudabos 10 ), its contribution to InsP6 hydrolysis has been considered almost negligible. Although some more recent studies have indicated that InsP6-P is highly available for broilers( Reference Leytem, Willing and Thacker 11 ), the origin of phytase activity in the digestive tract is controversial. Some authors have suggested that endogenous mucosal phytase of the small intestine is very capable of high InsP6 hydrolysis( Reference Tamim and Angel 12 , Reference Tamim, Angel and Christman 13 ). Others hypothesise that InsP6 is hydrolysed by phytases produced by micro-organisms present in the small intestine and particularly in the caeca( Reference Kerr, Classen and Newkirk 14 , Reference Leytem, Thacker and Turner 15 ).
It is not known which positional inositol phosphate (InsP) isomers are formed by different phytases in the digestive tract of avian species. Some studies have described different positional isomers of InsP6 degradation products in several segments of the digestive tract in pigs( Reference Schlemmer, Jany and Berk 16 – Reference Pontoppidan, Glitsoe and Guggenbuhl 18 ), but the variations in digestive tract physiology and anatomy between pigs and birds (for example, passage rate, digesta viscosity, presence of a crop, variable pH values) caution against assuming that findings in pigs will be similar to that in broilers. One consequence of the uncertainties regarding the availability of InsP6-P is that commercial poultry diets are supplemented with mineral P sources. This costly supplementation increases the P concentration in excreta, which may contribute to environmental problems such as eutrophication of surface waters and exhaustion of global raw phosphate resources( Reference Rodehutscord 19 ). An understanding of the rate of degradation of InsP6 to the different positional InsP isomers along the digestive tract would enable a more precise alignment of the feed composition to the birds' P requirements and thus increase the likelihood of averting a ‘potential planet phosphate crisis’( Reference Abelson 20 ). Phytases of different origin, varying in their properties, such as pH optimum, proteolytic stability and kinetic efficiency, may differ in effectiveness with transit as the conditions along the digestive tract change. The in vitro-determined pH optimum of most phytase supplements is particularly aligned to the conditions of the anterior segments of the digestive tract( Reference Campbell and Bedford 21 ).
The first objective of the present study therefore was to characterise InsP6 hydrolysis and formation of InsP isomers in different segments of the digestive tract of broilers. The second objective was to investigate the InsP6 degradation pattern of different phytase additives and their effectiveness in releasing phosphate in broilers and to compare the findings with known in vitro properties. In the absence of supplementary phytase, InsP6 was hypothesised to be mainly hydrolysed in the posterior intestinal segments of the digestive tract. In contrast, the different phytase supplements were expected to result in greater overall rates of InsP6 hydrolysis and to elicit different InsP patterns in the anterior segments.
Materials and methods
Experimental diets
The basal diet (BD) was calculated to contain adequate levels of all nutrients according to the recommendations of the Gesellschaft für Ernährungsphysiologie (Society for Nutrition Physiology)( 22 ) with the exception of Ca and P. It was mainly based on maize and solvent-extracted soyabean meal (Table 1). Ingredients were chosen to obtain low concentrations of total P (tP), high proportions of InsP6-P in tP and low intrinsic phytase activity. Concentrations of Ca and tP were calculated to be 7·9 and 5·0 g/kg of DM, respectively, and these levels were confirmed by analyses (Table 1). Titanium dioxide (TiO2) was included at a rate of 5 g/kg as the indigestible marker, and the intended Ti concentration was confirmed by analysis.
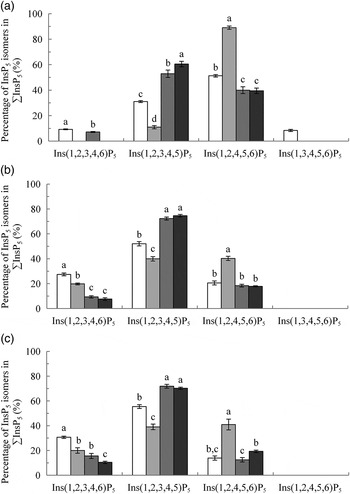
Fig. 1.
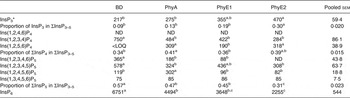
Myo-inositol pentakisphosphate (InsP5) isomers in the crop (A), duodenum/jejunum (B) and ileum (C), expressed as a percentage of ∑InsP5. Values are means, with their standard errors represented by vertical bars. a–d Values with unlike letters within an InsP5 isomer were significantly different (P ≤ 0·05; Fisher's protected least significant difference test). Mean separation was only computed if the overall F test was significant. □, Basal diet (BD); ░, BD supplemented with Aspergillus niger 3-phytase, Finase® P (PhyA); ![]() , BD supplemented with Escherichia coli 6-phytase, Quantum® (PhyE1);
, BD supplemented with Escherichia coli 6-phytase, Quantum® (PhyE1); ![]() , BD supplemented with E. coli 6-phytase, Quantum® Blue (PhyE2).
, BD supplemented with E. coli 6-phytase, Quantum® Blue (PhyE2).
Table 1. Ingredient composition and analysed characteristics of the experimental diets

BD, basal diet; PhyA, BD supplemented with Aspergillus niger 3-phytase, Finase® P; PhyE1, BD supplemented with Escherichia coli 6-phytase, Quantum®; PhyE2, BD supplemented with E. coli 6-phytase, Quantum® Blue; InsP6, myo-inositol 1,2,3,4,5,6-hexakis (dihydrogen phosphate); InsP5, myo-inositol pentakisphosphate; ND, not detected; LOQ, limit of quantification.
* P-free: Mineral mix (Gelamin SG 1 Geflügel, GFT MBH), provided per kg of complete diet: 15 mg Cu; 1·6 mg I; 90 mg Fe; 120 mg Mn; 80 mg Zn; 0·5 mg Se; 0·6 mg Co.
† Vitamin mix (Raiffeisen Kraftfutterwerke Süd GmbH), provided per kg of complete diet: 3·6 mg retinol; 75 µg cholecalciferol; 30 mg α-tocopherol; 2·4 mg menadione; 3 mg thiamin; 6 mg riboflavin; 6 mg pyridoxine; 0·03 mg cyanocobalamin; 50 mg nicotinic acid; 14 mg pantothenic acid; 0·1 mg biotin; 1 mg pteroyl(mono)glutamic acid.
‡ Determined at pH 4·5 and 60°C.
§ Determined at pH 5·0 and 37°C.
Diets were prepared in the certified feed mill facilities of Hohenheim University's Agricultural Experiment Station. The BD was mixed in one lot and divided into four equal parts. One part remained without phytase supplementation (BD). The other parts were supplemented with three different phytase-containing products at an intended activity of 500 U/kg of diet. The supplemented phytase products were a commercial A. niger-derived 3-phytase (PhyA; Finase® P, EC 3.1.3.8; AB Vista) and two E. coli-derived thermotolerant 6-phytases (PhyE1 (Quantum®) and PhyE2 (Quantum® Blue); EC 3.1.3.26; AB Vista). To ensure adequate mixing of each phytase, premixes of each product were prepared by mixing with a small amount of the BD before addition to the treatment diet. Diets were pelleted through a 3-mm die without using steam. The temperature of pellets measured immediately after release from the press ranged between 57°C and 69°C. Representative samples of the diets were taken for analyses of phytase activity, proximate nutrients, DM, Ca, tP, Ti and InsP isomers. The samples were pulverised using a vibrating cup mill (type 6-TOPF; Siebtechnik GmbH) and stored at 4°C until further handling. The experimental diets contained similar concentrations of myo-inositol pentakisphosphate (InsP5) and InsP6 (Table 1). The InsP6-P was 57 % of tP in the diets on average and that of InsP5-P was 3 % of tP. Lower InsP isomers were not detected in the diets. The phytase activity of the BD was below the limit of detection, but phytase activities of the supplemented diets ranged between 399 and 467 U/kg of diet.
Animals and management
The study was conducted in the Agricultural Experiment Station of Hohenheim University, location Lindenhöfe in Eningen (Germany). It was approved by the Animal Welfare Commissioner of the University in accordance with the German Welfare Legislation. Birds underwent routine vaccination against coccidiosis, Newcastle disease and infectious bursal disease on 3, 10 and 14 d of age, respectively.
A total of 600 unsexed Ross 308 broilers aged 1 d were obtained from a commercial hatchery (Brüterei Süd GmbH & Co.) and randomly allocated to forty floor pens (approximately 1·5 m × 1·5 m) bedded with wood shavings. Each pen had fifteen birds. The room temperature was 34 and 32°C on days 1 and 2, respectively. Thereafter, the temperature was reduced in steps of 0·5°C per d, reaching 20°C on day 25. Artificial lighting was provided with an intensity of 10 lux. During the first 2 d, the animal house was illuminated continuously. A lighting regimen of 18 h light and 6 h dark was applied from day 3 onwards. Feed and tap water were available for ad libitum consumption. Until day 15, the animals were fed a commercial starter diet containing 1·10 % Ca, 0·55 % tP, 22·0 % crude protein, 6·6 % diethyl ether extract and 12·5 MJ metabolisable energy/kg. On day 16, the birds were weighed, and ten pens of fifteen birds were assigned to each of the four dietary treatments and distributed in a completely randomised block design.
Sampling and analytical methods
At 25 d of age, the animals were asphyxiated by CO2 exposure and weighed. To standardise feed intake before sampling and thus retention time of feed in the crop, birds were deprived of feed for 1 h. The feed troughs were then moved back into the pens 1 h before the birds were killed, on an individual-pen basis to ensure the same time schedule for all replicates. The first samples were taken 1 h after the beginning of the light period. Samples from five parts of the digestive tract (crop, proventriculus and gizzard (pooled), duodenum and jejunum (pooled), the terminal part of the ileum (defined as the posterior two-thirds of the section between Meckel's diverticulum and 2 cm anterior to the ileo-caeco-colonic junction( Reference Rodehutscord, Dieckmann and Witzig 23 )) and the caeca) were taken. After opening of the abdominal cavity, the total digestive tract was removed except the crop. Digesta of the intestinal segments were gently flushed out with double-distilled water whereas the segments of the anterior digestive tract (crop, proventriculus and gizzard) were cut open and purged. The samples were pooled for all birds from one pen separately for each segment, immediately frozen at –18°C, freeze-dried (type Delta 1-24; Martin Christ Gefriertrocknungsanlagen GmbH) and pulverised as explained for the diets. The ground samples were stored at 4°C until analysis.
Concentrations of proximate nutrients were determined according to the official methods in Germany (Verband Deutscher Landwirtschaftlicher Untersuchungs- und Forschungsanstalten; VDLUFA)( 24 ). Feed samples were analysed for DM and crude ash (method 3.1), crude protein (method 4.1.1), diethyl ether extract (method 5.1.1) and crude fibre (method 6.1.1). The concentrations of Ca, tP and Ti in diet and digesta samples were determined by a modification of the method of Boguhn et al. ( Reference Boguhn, Baumgärtel and Dieckmann 25 ). In brief, 20 ml of sulfuric acid (18 mol/l) and 2·5 ml of nitric acid (14 mol/l) were added to 0·4 g of sample. Solutions were heated from 100 to 200°C for 30 min in a block digestion system equipped with a system to trap nitrous gases (Behr K 20 L; Behr Labor-Technik GmbH). After cooling to 100°C, 2·5 ml of the nitric acid were added. Following heating from 225 up to 300°C for 75 min and subsequent cooling to room temperature, the solutions were filled with double-distilled water to a volume of 500 ml and filtered. The Ca, P and Ti concentrations of the solutions were measured using an inductively coupled plasma optical emission spectrometer (VISTA PRO; Varian Inc.) at specific wavelengths for each element according to Shastak et al. ( Reference Shastak, Witzig and Hartung 26 ).
For the analysis of InsP isomers in diet and digesta samples, 1·0 g of the sample was extracted for 30 min with 10 ml of a solution containing 0·2 m-EDTA and 0·1 m-sodium fluoride (pH = 10) as phytase inhibitor using a rotary shaker. The samples were centrifuged at 12 000 g for 15 min and the supernatant fraction was removed and preserved on ice. The residue was re-suspended in 5 ml of the EDTA–sodium fluoride solution and extracted again for 30 min. The supernatant fractions of the two extraction steps were then combined. A quantity of 1 ml of the pooled supernatant fraction was centrifuged at 14 000 g for 15 min and 0·5 ml of the resulting supernatant fraction were filtered through a 0·2 µm cellulose acetate filter (VWR) into a Microcon filter (cut-off 30 kDa) device (Millipore) and centrifuged again at 14 000 g for 30 min. Throughout the whole extraction procedure, the samples were kept below 6°C. The procedure for caecal samples was slightly different: glass beads (diameter 0·6 mm) were added before extraction. To obtain a clear supernatant fraction for the caecal matrix, the extracts were centrifuged for 30 min at 12 000 g and 6°C. Filtrates were analysed by high-performance ion chromatography and UV detection at 290 nm after post-column derivatisation using an ICS-3000 system (Dionex). InsP with different degrees of phosphorylation (InsP3–6) and their positional isomers were separated, without enantiomer differentiation, on a Carbo Pac PA 200 column and corresponding guard column. Fe(NO3)3 solution (1 g/l, Fe(NO3)3.9H2O, product no. 103883; Merck KGaA) in HClO4 (20 g/l, product no. 100518; Merck KGaA) was used as reagent for derivatisation according to Philippy & Bland( Reference Phillippy and Bland 27 ). The elution order of InsP isomers was established using commercial standards if available. InsP5 isomer standards were purchased from Sirius Fine Chemicals. Seven out of nine myo-inositol tetrakisphosphate (InsP4) and nine out of twelve myo-inositol trisphosphate (InsP3) isomer standards were available from Santa Cruz Biotechnology. One detected peak out of the group of InsP4 isomers could not be attributed but was presumed to be Ins(1,2,4,6)P4 by comparison with the elution order of Chen & Li( Reference Chen and Li 28 ), who used similar chromatographical conditions. A clear identification of the InsP3 isomers present was not possible. However, a peak was detected, corresponding in its retention time to the retention time of Ins(1,3,4)P3, Ins(1,4,6)P3, Ins(1,2,6)P3, Ins(1,4,5)P3 and Ins(2,4,5)P3 (out of the available standards), which all coeluted under the conditions used. InsP2 and InsP1 could not be analysed with this method. InsP6 was used for quantification, and correction factors for differences in detector response for InsP3–5 were used according to Skoglund et al. ( Reference Skoglund, Carlsson and Sandberg 29 ). The limit of detection was defined for a signal:noise ratio of 3:1 and was 0·1 µmol/g of DM for InsP3–4 isomers and 0·05 µmol/g of DM for InsP5 isomers and InsP6. The limit of quantification was defined for a signal:noise ratio of 6:1. A mean for an InsP isomer was calculated only if the isomer was detected in at least five out of the ten samples of one treatment. If the detected value was below the limit of quantification in five or more samples, this was noted as less than the limit of quantification in the tables, and means were not calculated. All samples were analysed in duplicate. The InsP concentration is reported on a DM basis.
Because of differences in the extractability of the phytases used, the phytase activity in the diets was determined under product-specific conditions and expressed as U/kg for all diets. Determination of phytase activity was assayed according to the internal, validated methods of the supplier (BD + PhyA: assay at pH 5·5 and 37°C; BD, BD + PhyE1 and BD + PhyE2: assay at pH 4·5 and 60°C). Both assays were run by Enzyme Services & Consultancy.
Calculations and statistical analysis
Body-weight gain, feed consumption and feed:gain ratio were determined on a pen basis for the period between days 16 and 25. InsP6 hydrolysis and P net absorption in the digestive tract (y) were calculated for each pen based on the ratio of InsP6 or P and Ti according to the generally accepted equation:
 $$\eqalign{y\lpar \% \rpar & = 100 - 100 \times \left({\displaystyle{{\hbox{Ti in the diet}\, \lpar \hbox{g/kg DM}\rpar } \over {\hbox{Ti in the digesta}\, \lpar \hbox{g/kg DM}\rpar}}} \right) \cr & \quad \times \left({\displaystyle{{\hbox{Ins}\hbox{P}_{6} \hbox{ or P in the digesta} \, \lpar \hbox{g/kg DM}\rpar } \over {\hbox{Ins}\hbox{P}_{6} \hbox{or P in the diet} \, \lpar \hbox{g/kg DM}\rpar }}} \right)}$$
InsP6 hydrolysis was calculated for the crop, duodenum/jejunum, lower ileum and caeca. It was not calculated for the proventriculus/gizzard since this segment clearly contained particles of different sizes, which presumably were of variable retention times and thus were not accurately represented by the marker( Reference Svihus, Hetland and Choct 30 ). P net absorption was calculated in the duodenum/jejunum and lower ileum.
The percentage of InsP3, ∑InsP4 or ∑InsP5 in ∑InsP3–5 was calculated for each treatment and segment to investigate the rapidity of InsP6 hydrolysis and the extent to which intermediary products with different degrees of phosphorylation were formed. Because InsP1–2 isomers were not determined, ∑InsP3–5 was calculated, representing the sum of identified InsP6 hydrolysis products.
Untransformed data are expressed as means with their standard error or the pooled standard error of the mean. Statistical analysis was performed using the MIXED procedure of the software package SAS for Windows (version 9.1.3; SAS Institute Inc.). Before statistical analysis, data that showed non-normal residuals or heterogeneity of variance were log- or square root-transformed. For data expressed as percentages the arc-sine transformation was used. The following statistical model was chosen: yij = μ + ri + τj + eij, where yij is the ith measurement in the jth treatment, μ is the overall mean, ri is the ith block (random), τj is the effect of the jth treatment (fixed) and eij is the error term. Statistical significance was evaluated by a one-way ANOVA. Mean separation was computed using Fisher's protected least significant difference test (P ≤ 0·05) only if the overall F test was significant (P ≤ 0·05).
Results
The initial body weight was on average 531 g and was similar between treatments (P > 0·05). During the 9-d assay period, average body-weight gain, feed consumption and feed:gain ratio were not significantly different between treatments (Table 2).
Table 2. Body-weight (BW) gain, feed consumption (FC) and feed:gain (F:G) ratio of broiler chickens between the ages of 16 and 25 d
(Mean values and pooled standard errors; ten pens per treatment with fifteen birds per pen)
BD, basal diet; PhyA, BD supplemented with Aspergillus niger 3-phytase, Finase® P; PhyE1, BD supplemented with Escherichia coli 6-phytase, Quantum®; PhyE2, BD supplemented with E. coli 6-phytase, Quantum® Blue.
* The overall F test was not significant.
Myo-inositol 1,2,3,4,5,6-hexakis (dihydrogen phosphate) hydrolysis
In birds fed the BD, low InsP6 hydrolysis was measured in the crop (9 %; Table 3). Average InsP6 hydrolysis in this treatment was 59, 74 and 91 % until the duodenum/jejunum, the lower ileum and the caeca, respectively.
Table 3. Myo-inositol 1,2,3,4,5,6-hexakis (dihydrogen phosphate) hydrolysis (%) in different segments of the digestive tract of broiler chickens
(Mean values and pooled standard errors; ten pens per treatment with fifteen birds per pen)
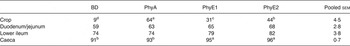
BD, basal diet; PhyA, BD supplemented with Aspergillus niger 3-phytase, Finase® P; PhyE1, BD supplemented with Escherichia coli 6-phytase, Quantum®; PhyE2, BD supplemented with E. coli 6-phytase, Quantum® Blue.
a–d Mean values in a row with unlike superscript letters were significantly different (P ≤ 0·05; Fisher's protected least significant difference test). Mean separation was only computed if the overall F test was significant.
Supplementation of phytase had a significant effect on InsP6 hydrolysis in the crop (P < 0·01) but not in the duodenum/jejunum and lower ileum. In the crop, supplemented phytases significantly increased InsP6 hydrolysis, and the effect by PhyA (64 %) was significantly higher than by the other phytase treatments (PhyE1: 31 %; PhyE2: 44 %). Until the duodenum/jejunum and the lower ileum, the difference in InsP6 hydrolysis between treatments became lower and statistical difference between treatments disappeared. The average InsP6 hydrolysis was 64 % (duodenum/jejunum) and 77 % (lower ileum). InsP6 hydrolysis up to the caeca was significantly higher with PhyE1 (95 %) and PhyE2 (96 %) compared with the BD (91 %) and PhyA (93 %) (P < 0·01).
Net absorption of phosphorus
In birds fed the BD, a P net absorption of 34 and 57 % was measured until the duodenum/jejunum and lower ileum (Table 4). Supplementation of phytases caused a significant increase in P net absorption until the duodenum/jejunum (PhyA: 38 %; PhyE1: 38 %; PhyE2: 39 %) (P = 0·04). P net absorption until the lower ileum tended to be higher with PhyE1 (60 %) and was significantly higher with PhyE2 (64 %) compared with PhyA (56 %) and BD (57 %) (P = 0·03).
Table 4. Net absorption of phosphorus (%) in segments of the small intestine of broiler chickens
(Mean values and pooled standard errors; ten pens per treatment with fifteen birds per pen)

BD, basal diet; PhyA, BD supplemented with Aspergillus niger 3-phytase, Finase® P; PhyE1, BD supplemented with Escherichia coli 6-phytase, Quantum®; PhyE2, BD supplemented with E. coli 6-phytase, Quantum® Blue.
a,b Mean values in a row with unlike superscript letters were significantly different (P≤0·05; Fisher's protected least significant difference test). Mean separation was only computed if the overall F test was significant.
Appearance of inositol phosphate isomers
In the crop digesta of birds fed the BD, an average concentration of 638 and 388 nmol/g DM was detected for Ins(1,2,4,5,6)P5 and Ins(1,2,3,4,5)P5 and lower concentrations were measured for Ins(1,2,3,4,6)P5 and Ins(1,3,4,5,6)P5 (Table 5 and Fig. 1(A)). The only detectable inositol tetrakisphosphate Ins(1,2,5,6)P4 was found in low concentration (141 nmol/g DM), and inositol trisphosphates were not found in the crop in this treatment. About 90 % of ΣInsP3–5 in the crop was present as InsP5 when the BD was fed. In the proventriculus/gizzard, Ins(1,2,4,5,6)P5 and Ins(1,2,3,4,5)P5 were the only detectable lower InsP (Table 6), and their concentrations were lower than in the crop. In the duodenum/jejunum, the InsP pattern again was more diverse than in the proventriculus/gizzard and different from the crop (Table 7).
Table 5. Concentrations of different inositol phosphate (InsP) isomers (nmol/g DM) in the crop digesta
(Mean values and pooled standard errors; ten pens per treatment with fifteen birds per pen)
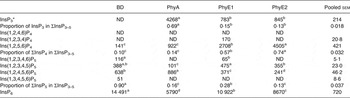
BD, basal diet; PhyA, BD supplemented with Aspergillus niger 3-phytase, Finase® P; PhyE1, BD supplemented with Escherichia coli 6-phytase, Quantum®; PhyE2, BD supplemented with E. coli 6-phytase, Quantum® Blue; InsP3, myo-inositol trisphosphate; ND, not detected (the InsP isomer was not detectable in the majority of samples); InsP4, myo-inositol tetrakisphosphate; InsP5, myo-inositol pentakisphosphate; InsP6, myo-inositol 1,2,3,4,5,6-hexakis (dihydrogen phosphate).
a–d Mean values in a row with unlike superscript letters were significantly different (P ≤ 0·05; Fisher's protected least significant difference test). Mean separation was only computed if the overall F test was significant.
* At least one out of the following InsP3 isomers: Ins(1,4,5)P3, Ins(1,2,6)P3, Ins(2,4,5)P3, Ins(1,3,4)P3, Ins(1,4,6)P3.
Table 6. Concentrations of different inositol phosphate (InsP) isomers (nmol/g DM) in the proventriculus/gizzard digesta
(Mean values and pooled standard errors; ten pens per treatment with fifteen birds per pen)
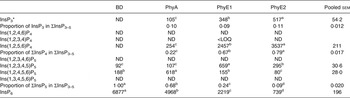
BD, basal diet; PhyA, BD supplemented with Aspergillus niger 3-phytase, Finase® P; PhyE1, BD supplemented with Escherichia coli 6-phytase, Quantum®; PhyE2, BD supplemented with E. coli 6-phytase, Quantum® Blue; InsP3, myo-inositol trisphosphate; ND, not detected (the InsP isomer was not detectable in the majority of samples); InsP4, myo-inositol tetrakisphosphate; LOQ, limit of quantification (the InsP isomer was not quantifiable in the majority of samples); InsP5, myo-inositol pentakisphosphate; InsP6, myo-inositol 1,2,3,4,5,6-hexakis (dihydrogen phosphate).
a–d Mean values in a row with unlike superscript letters were significantly different (P ≤ 0·05; Fisher's protected least significant difference test). Mean separation was only computed if the overall F test was significant.
* At least one out of the following InsP3 isomers: Ins(1,4,5)P3, Ins(1,2,6)P3, Ins(2,4,5)P3, Ins(1,3,4)P3, Ins(1,4,6)P3.
Table 7. Concentrations of different inositol phosphate (InsP) isomers (nmol/g DM) in the duodenal/jejunal digesta
(Mean values and pooled standard errors; ten pens per treatment with fifteen birds per pen)
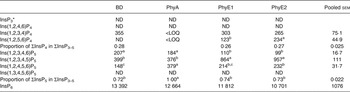
BD, basal diet; PhyA, BD supplemented with Aspergillus niger 3-phytase, Finase® P; PhyE1, BD supplemented with Escherichia coli 6-phytase, Quantum®; PhyE2, BD supplemented with E. coli 6-phytase, Quantum® Blue; InsP3, myo-inositol trisphosphate; ND, not detected (the InsP isomer was not detectable in the majority of samples); InsP4, myo-inositol tetrakisphosphate; LOQ, limit of quantification (the InsP isomer was not quantifiable in the majority of samples); InsP5, myo-inositol pentakisphosphate; InsP6, myo-inositol 1,2,3,4,5,6-hexakis (dihydrogen phosphate).
a,b,c Mean values in a row with unlike superscript letters were significantly different (P ≤ 0·05; Fisher's protected least significant difference test). Mean separation was only computed if the overall F test was significant.
* At least one out of the following InsP3 isomers: Ins(1,4,5)P3, Ins(1,2,6)P3, Ins(2,4,5)P3, Ins(1,3,4)P3, Ins(1,4,6)P3.
The predominant InsP5 isomer changed in the intestinal segments (Fig. 1 (B) and (C)). Ins(1,2,3,4,5)P5 was the predominant InsP5 isomer in the duodenum/jejunum and the subsequent intestinal segments, accompanied by Ins(1,2,3,4,6)P5 and Ins(1,2,4,5,6)P5 (Tables 7–9). In the duodenum/jejunum, high concentrations of Ins(1,2,3,4)P4 (355 nmol/g DM) were noted and it remained the predominant InsP4 isomer in subsequent segments in the BD treatment. In the lower ileum, the same pattern of InsP5 isomers as in the duodenum/jejunum was found whereas within the InsP4 isomers, Ins(1,2,4,6)P4 also appeared (Table 8). The pattern of the InsP5 isomers in the caeca of birds fed the BD was similar to that of the lower ileum, except that Ins(1,3,4,5,6)P5 appeared in relatively low concentrations (75 nmol/g DM) (Table 9). High concentrations of Ins(1,2,3,4)P4 (750 nmol/g DM) were detected in the caeca whereas Ins(1,2,4,6)P4 was not found and InsP3 and traces of Ins(1,2,5,6)P4 appeared.
Table 8. Concentrations of different inositol phosphate (InsP) isomers (nmol/g DM) in the digesta of the lower ileum
(Mean values and pooled standard errors; ten pens per treatment with fifteen birds per pen)
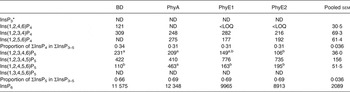
BD, basal diet; PhyA, BD supplemented with Aspergillus niger 3-phytase, Finase® P; PhyE1, BD supplemented with Escherichia coli 6-phytase, Quantum®; PhyE2, BD supplemented with E. coli 6-phytase, Quantum® Blue; InsP3, myo-inositol trisphosphate; ND, not detected (the InsP isomer was not detectable in the majority of samples); InsP4, myo-inositol tetrakisphosphate; LOQ, limit of quantification (the InsP isomer was not quantifiable in the majority of samples); InsP5, myo-inositol pentakisphosphate; InsP6, myo-inositol 1,2,3,4,5,6-hexakis (dihydrogen phosphate).
a,b Mean values in a row with unlike superscript letters were significantly different (P ≤ 0·05; Fisher's protected least significant difference test). Mean separation was only computed if the overall F test was significant.
* At least one out of the following InsP3 isomers: Ins(1,4,5)P3, Ins(1,2,6)P3, Ins(2,4,5)P3, Ins(1,3,4)P3, Ins(1,4,6)P3.
Table 9. Concentrations of different inositol phosphate (InsP) isomers (nmol/g DM) in the caecal digesta
(Mean values and pooled standard errors; ten pens per treatment with fifteen birds per pen)
BD, basal diet; PhyA, BD supplemented with Aspergillus niger 3-phytase, Finase® P; PhyE1, BD supplemented with Escherichia coli 6-phytase, Quantum®; PhyE2, BD supplemented with E. coli 6-phytase, Quantum® Blue; InsP3, myo-inositol trisphosphate; InsP4, myo-inositol tetrakisphosphate; ND, not detected (the InsP isomer was not detectable in the majority of samples); LOQ, limit of quantification (the InsP isomer was not quantifiable in the majority of samples); InsP5, myo-inositol pentakisphosphate; InsP6, myo-inositol 1,2,3,4,5,6-hexakis (dihydrogen phosphate).
a,b,c Mean values in a row with unlike superscript letters were significantly different (P ≤ 0·05; Fisher's protected least significant difference test). Mean separation was only computed if the overall F test was significant.
* At least one out of the following InsP3 isomers: Ins(1,4,5)P3, Ins(1,2,6)P3, Ins(2,4,5)P3, Ins(1,3,4)P3, Ins(1,4,6)P3.
In the crop digesta of all phytase-containing treatments, the InsP5 pattern was less broad compared with the BD. For the PhyA treatment, the percentage of Ins(1,2,4,5,6)P5 in ∑InsP5 was significantly higher (P < 0·01) whereas the percentage of Ins(1,2,3,4,5)P5 in ∑InsP5 was significantly lower (P < 0·01) compared with the three other treatments (Fig. 1 (A)). In contrast, for PhyE1 and PhyE2, the percentage of Ins(1,2,3,4,5)P5 in ∑InsP5 was significantly higher, but the percentage of Ins(1,2,4,5,6)P5 in ∑InsP5 was significantly lower compared with the two other treatments. Ins(1,2,5,6)P4 and InsP3 also occurred in the crop in high concentrations for the phytase-containing treatments (Table 5). Ins(1,2,5,6)P4 appeared for the PhyE1 and PhyE2 treatment in significantly higher concentrations compared with the BD and PhyA (P < 0·01) and as the only inositol tetrakisphosphate formed by PhyA. InsP3 appeared in significantly higher concentrations for PhyA than PhyE1 and PhyE2 (P < 0·01). The proportion of ΣInsP4 in ΣInsP3–5 was significantly higher for PhyE2 (74 %) than PhyE1 (57 %) and PhyA (14 %) (P < 0·01), and that of InsP3 in ΣInsP3–5 was significantly higher for PhyA (69 %) compared with PhyE1 (15 %) and PhyE2 (13 %) (P < 0·01) in the crop. In the proventriculus/gizzard, the InsP5 pattern of the phytase-containing treatments was similar to that of the crop except Ins(1,2,3,4,6)P5 was not seen in the proventriculus/gizzard (Table 6). Ins(1,2,5,6)P4 and InsP3 were detected in significantly lower concentrations for PhyA compared with PhyE1 and PhyE2 (P < 0·01 for both). A higher proportion of ΣInsP5 in ΣInsP3–5 and a lower proportion of ΣInsP4 in ΣInsP3–5 were identified for PhyA compared with PhyE1 and PhyE2 (P < 0·01).
In the segments of the small intestine, almost the same InsP isomers were detected in all treatments, except Ins(1,2,5,6)P4, which occurred only in the phytase treatments (Tables 7 and 8). In the duodenum/jejunum, Ins(1,2,3,4,6)P5 appeared for the first time for PhyA and PhyE2 and again appeared for PhyE1. Ins(1,2,3,4)P4 was the predominating InsP4 isomer for all treatments. The concentrations of Ins(1,2,3,4,5)P5 in the duodenum/jejunum were similar for the BD and the PhyA, but significantly higher for the PhyE1 and PhyE2 treatments (P < 0·01) (Table 7). Ins(1,2,4,5,6)P5 was detected in significantly higher concentrations for the PhyA compared with the other treatments (P < 0·01). For all phytase treatments, a significantly lower proportion of Ins(1,2,3,4,6)P5 in ΣInsP5 was determined compared with the BD in the duodenum/jejunum (Fig. 1 (B)) and lower ileum (Fig. 1 (C)) (P < 0·01). In the lower ileum, the significant difference in Ins(1,2,4,5,6)P5 concentrations persisted (P < 0·01) whereas the difference in Ins(1,2,3,4,5)P5 concentrations lost significance (Table 8). InsP3 was not detectable in any of the treatments in the small intestine.
In the caeca, the differences in InsP patterns between the phytase-containing diets and the BD were less distinct than in other sections. Concentrations of Ins(1,2,3,4,6)P5 and Ins(1,2,3,4)P4 were lower (P < 0·01) and concentrations of InsP3 (P = 0·03) and Ins(1,2,5,6)P4 (P = 0·04) partially higher when phytases were supplemented, especially for PhyE2 (Table 9). The specific InsP isomers of the supplemented phytases were still present in the caeca. The predominating InsP5 isomer was Ins(1,2,3,4,5)P5 for all phytase treatments. For the PhyA treatment, significantly higher concentrations of Ins(1,2,4,5,6)P5 were measured compared with the other treatments (P < 0·01).
Discussion
Myo-inositol 1,2,3,4,5,6-hexakis (dihydrogen phosphate) hydrolysis and net absorption of phosphorus
In agreement with previous studies that used low-Ca and low-P diets( Reference Leytem, Willing and Thacker 11 – Reference Tamim, Angel and Christman 13 ) we found a high rate of InsP6 hydrolysis (76 %) and P net absorption (57 %) in the lower ileum. This raises the question of the origin of phytase responsible for this hydrolysis. We found that without supplemented phytase, the majority of InsP6 hydrolysis occurred by the end of the duodenum/jejunum, but hydrolysis still continued in the ileum and caeca. In the small intestine of broilers, the greatest endogenous mucosa phytase activity was found in the duodenum( Reference Maenz and Classen 8 , Reference Abudabos 10 ). Phytate-degrading activity has also been reported for different lactic acid bacteria isolated from chicken intestine( Reference Raghavendra and Halami 31 ). Thus, intestinal InsP6 hydrolysis was the result of a combination of endogenous and microbiota phytase, with as-yet-unknown contributions from each source. When phytase activity in different segments of the digestive tract was compared, the highest activity was found in the caeca( Reference Marounek, Skřivan and Rosero 32 ) and Kerr et al. ( Reference Kerr, Classen and Newkirk 14 ) detected higher concentrations of InsP6 in the caeca of gnotobiotic compared with conventional broilers. In line with this observation, caecal InsP6 hydrolysis determined in the present study was greater than 90 %. It should be noted that retrograde movement of digesta and micro-organisms has been described for all segments of the digestive tract in broilers( Reference Sacranie, Svihus and Denstadli 33 ) and it cannot be ruled out that this affected concentrations of InsP isomers, P and Ti anterior to the caeca.
With supplemented phytase, the crop and the proventriculus/gizzard were the main sites of InsP6 hydrolysis in the present study. The differences found between the supplemented phytases in these segments might be related to differences in enzyme kinetics, pH or resistance against gastrointestinal proteases. A higher temperature optimum was reported for E. coli compared with Aspergillus phytases( Reference Brüning 34 , Reference Igbasan, Männer and Miksch 35 ). At approximate body temperature (42°C), Aspergillus phytases show an activity of 85 % of the maximum whereas the activity of some E. coli phytases is reduced to 60 % of the in vitro analysed maximum( Reference Brüning 34 ). Furthermore, E. coli phytases are more resistant than Aspergillus phytases against pepsin and pancreatin and show a higher activity at pH 3, which is close to the pH in the proventriculus/gizzard( Reference Igbasan, Männer and Miksch 35 – Reference Elkhalil, Männer and Borriss 37 ). This might explain why the differences between phytases noted in the crop disappeared in the duodenum/jejunum. Moreover, a residual activity of 93 and 60 % has been found for an E. coli and an Aspergillus phytase, respectively, after incubation in digesta of the proventriculus( Reference Igbasan, Männer and Miksch 35 ).
Appearance of inositol phosphate isomers: basal diet
Past experiments in poultry have focused on the analysis of InsP6 and rarely considered clarification of the location of InsP6 hydrolysis( Reference Kerr, Classen and Newkirk 14 , Reference Marounek, Skřivan and Rosero 32 , Reference Leytem, Widyaratne and Thacker 38 ). A few studies have investigated the sum of InsP5, InsP4 and InsP3 isomers in digesta samples of poultry, without differentiation among positional isomers( Reference Leslie 39 – Reference Elkhalil, Osman and Simon 41 ). The authors are not aware of any published study investigating positional InsP isomers in the digestive tract of broilers, which led us to making this one of our objectives.
When the BD was fed, the dominating InsP5 isomers found in the crop were Ins(1,2,4,5,6)P5 and Ins(1,2,3,4,5)P5. Ins(1,2,3,4,6)P5 and Ins(1,3,4,5,6)P5 that occurred in concentrations close to the limit of detection may have originated from the diet (Table 1). The changing pattern of InsP5 isomers (Fig. 1 (A)) in the crop compared with the diet affirm InsP6 hydrolysis in the crop, as does the additional occurrence of InsP4. The appearance of Ins(1,2,4,5,6)P5 might have been caused by residual intrinsic soyabean phytase, which is a 3-phytase, that withstood exposure to heat in the desolventiser–toaster and was below the limit of detection in the feed. However, this could also have been caused by microbial phytases because 3-phytases are primarily found in fungi (A. niger, A. terreus, A. fumigatus, Neurospora crassa), yeasts (Saccharomyces castellii, Saccharomyces cerevisiae) and bacteria (Selenomonas ruminantium, Selenomonas lacticifex, Megasphaera elsdenii, Klebsiella terrigena, Pantoea agglomerans, Pseudomonas syringae, Bacillus subtilis, Bacillus amyloliquefaciens). Phytases of plant origin are primarily classified as 4-/6-phytases but 6-phytases were also found for specific bacteria such as E. coli, Peniophora lycii and Bifidobacterium pseudocatenulatum ( Reference Greiner, Carlsson and Alminger 7 , Reference Van der Kaay and Van Haastert 42 , Reference Haros, Carlsson and Almgren 43 ). Therefore, it remains open whether in the present study Ins(1,2,3,4,5)P5 was formed by plant or microbiota phytase. Ins(1,2,5,6)P4 (perhaps co-eluted with Ins(2,3,4,5)P4) measured in the crop could have been formed by 3- or 6-phytases( Reference Greiner, da Silva and Couri 5 , Reference Greiner, Carlsson and Alminger 7 ). A formation by other phosphatases which further degraded Ins(1,2,4,5,6)P5 or Ins(1,2,3,4,5)P5 to Ins(1,2,5,6)P4 also is possible.
The fact that there was so little InsP5 in the proventriculus/gizzard suggests that when no phytase is added there is very little InsP6 hydrolysis in that acid environment. Some remaining intrinsic plant phytase may rapidly be inactivated at low pH values and in the presence of pepsin and pancreatin( Reference Greiner, Konietzny and Jany 44 – Reference Greiner, Muzquiz and Burbano 47 ). The lack of InsP3–4 isomers and the dominance of InsP5 isomers in the proventriculus/gizzard further indicate that InsP5 hydrolysis is less rapidly advanced. However, InsP and their complexes are soluble under acidic conditions and mineral chelates of lower InsPs are more soluble. Hence fast breakdown of InsP3–4 also could have happened in the proventriculus/gizzard.
Following passage through the acid phase of the proventriculus/gizzard, a higher accessibility of phytate in the posterior segments can be assumed. In the duodenum/jejunum, a greater range of InsP isomers compared with those found in the stomach was found for the BD treatment, showing intense hydrolysis of InsP6 in this segment. This increase probably was the result of substrate-induced InsP6 hydrolysis by microbiota or endogenous mucosa phytase. Phytate-induced phytase production was reported for several bacteria( Reference Greiner, Haller and Konietzny 48 – Reference Lan, Abdullah and Jalaludin 50 ). The results of Schlemmer et al. ( Reference Schlemmer, Jany and Berk 16 ) showed substrate dependence of microbiota phytase activity in the colon of pigs. For mucosal phytase, increased activity with dietary phytic acid was also reported in rats( Reference Lopez, Vallery and Levrat-Verny 51 ). In addition to an alteration of InsP6 hydrolysis and diversity of InsP isomers, the InsP pattern changed between the anterior and intestinal segments of the digestive tract (Fig. 1). This change in InsP pattern suggests the involvement of phosphatases of different origin in different segments, with 3- and 6-phytases dominating in the crop and 6- and 5-phytases dominating in the intestinal segments. Ins(1,2,3,4,5)P5 can be formed by bacterial 6-phytase of the intestinal microbiota, for example, an E. coli 6-phytase. Ins(1,2,3,4)P4 first appeared in the duodenum/jejunum and was the dominating InsP4 isomer in all intestinal segments when the BD was fed. It might have been a hydrolysis product of a 5-phytase because the majority of phytases continue dephosphorylation adjacent to a free hydroxyl group. Ins(1,2,3,4)P4 (perhaps co-eluted with Ins(1,2,3,6)P4) was also characterised as a hydrolysis product of a 5-phytase in lily pollen and Selenomonas ruminantium subsp. lactilytica ( Reference Barrientos, Scott and Murthy 52 , Reference Puhl, Greiner and Selinger 53 ). However, as Ins(1,2,3,4)P4 was also detected as a minor hydrolysis product of specific 6-phytases, it principally could have been formed by both 5- and 6-phytases. In addition, the involvement of other phosphatases which further degraded InsP5 cannot be ruled out. Because 5-phytase is described only for Selenomonas ruminantium subsp. lactilytica ( Reference Puhl, Greiner and Selinger 53 ), lily pollen and Bifidobacterium pseudocatenulatum ( Reference Haros, Carlsson and Almgren 43 ), its origin in the intestine of broilers was unexpected. Human gut-isolated Bifidobacterium pseudocatenulatum initiates InsP6 hydrolysis at the C-6 and C-5 position of the myo-inositol ring and proceeds via Ins(1,2,3,4)P4 ( Reference Haros, Carlsson and Almgren 43 ), but the authors are not aware of any study that found this species of Bifidobacterium in broilers.
For the caeca, the broad pattern of InsP isomers is an indication of a highly diverse microbial population likewise producing several phytate-degrading enzymes. From bacteria occurring in the chicken digestive tract, phytate-degrading activity has been described for Lactobacillus spp.( Reference Raghavendra and Halami 31 ), Enterobacter spp.( Reference Yoon, Choi and Min 54 ), E. coli ( Reference Greiner, Carlsson and Alminger 7 ), Klebsiella pneumoniae ( Reference Escobin-Mopera, Ohtani and Sekiguchi 55 ), Bacillus spp.( Reference Greiner, Farouk and Alminger 56 ), Bifidobacterium spp.( Reference Palacios, Haros and Rosell 57 ) and Pseudomonas aeruginosa ( Reference Sasirekha, Bedashree and Champa 58 ). Differences between the InsP pattern of the intestinal segments might be caused by the differing microbial community composition as described by Lu et al. ( Reference Lu, Idris and Harmon 59 ) and coupled with the variations in activity of the endogenous phytase. Ins(1,3,4,5,6)P5, which appeared in the caeca, indicates the activity of a phosphatase in the caeca that initiates hydrolysis at the C-2 position of the inositol ring. If this was not undegraded Ins(1,3,4,5,6)P5 from the feed then this finding contradicts the general assumption that phytate-degrading enzymes are unable to cleave the axial phosphate group of the myo-inositol ring.
Appearance of inositol phosphate isomers: phytase treatments
The second objective of the present study was to investigate the InsP6 degradation pattern of different phytase supplements and their effectiveness in releasing phosphate in different segments of the digestive tract. For the PhyA treatment, Ins(1,2,4,5,6)P5 was the predominant InsP5 isomer whereas Ins(1,2,3,4,5)P5 was predominant for the PhyE1 and PhyE2 treatments. This shows, for the first time, that in the crop of broilers the patterns are very similar to the in vitro pattern of hydrolysis of these 3- and 6-phytases, initiating InsP6 hydrolysis at the d-3 (l-1) and d-6 (l-4) positions of the inositol ring( Reference Greiner, da Silva and Couri 5 , Reference Greiner, Carlsson and Alminger 7 ). Ins(1,2,5,6)P4 (perhaps co-eluted with Ins(2,3,4,5)P4) and InsP3, both of which were present in high concentrations for the phytase treatments, are the two other main hydrolysis products of the three phytases. This pattern conforms with in vitro results that showed d-Ins(2,3,4,5)P4 as a hydrolysis product of E. coli and d-Ins(1,2,5,6)P4 of Aspergillus phytase( Reference Greiner, da Silva and Couri 5 , Reference Greiner, Carlsson and Alminger 7 ). The proportion of ΣInsP4 in ΣInsP3–5 was higher for PhyE1 and PhyE2 compared with PhyA whereas the proportion of InsP3 in ΣInsP3–5 was higher for PhyA in the crop. Accumulation of myo-inositol tris- and bisphosphates following hydrolysis by A. niger phytase has already been shown in vitro ( Reference Wyss, Pasamontes and Friedlein 60 ). In contrast, a fast progression from InsP5 to InsP4 is expected for E. coli, but InsP4 accumulated. This result corresponds to in vitro findings in which InsP4 accumulated during InsP6 hydrolysis by E. coli phytase and was later slowly hydrolysed to InsP3 ( Reference Greiner, Konietzny and Jany 6 ). Because the lower-molecular-weight esters of InsPs have a lower mineral-binding strength than InsP6 or InsP5 ( Reference Persson, Türk and Nyman 61 ), the solubility of these esters in the small intestine will be improved, allowing access to them by the endogenous phytase/phosphatases( Reference Cowieson, Wilcock and Bedford 62 ).
In the duodenum/jejunum and to some extent also in the ileum, the InsP5 and InsP4 isomers specifically formed by the respective supplemented phytases were present in higher concentrations compared with both the BD and the other phytase treatments. Thus, further activity of the enzymes can be assumed in these intestinal segments. However, the proportion of Ins(1,2,3,4,6)P5 in ΣInsP5 was significantly lower, and concentrations of Ins(1,2,3,4)P4 tended to be lower for the phytase treatments compared with the BD treatment in the duodenum/jejunum and lower ileum. Supplementation of phytase tends to reduce lactic acid bacterial count and significantly reduce E. coli count in the ileal digesta of broilers( Reference Aydin, Pekel and Issa 63 ), and, as mentioned earlier, both bacterial groups were suspected to be involved in phytate degradation. Aydin et al. ( Reference Aydin, Pekel and Issa 63 ) speculated that the decrease is related to a possible reduction in the quantity of substrate available to the intestinal microbiota. If there was a reduction of lactic acid bacteria (for example, Bifidobacteria) this might explain the decrease in 5-phytase activity for all phytase-containing treatments whereas a reduction of E. coli bacteria might explain the decrease in 6-phytase activity for PhyA. Furthermore, a reduction in intestinal mucosal phytase activity has been reported when chickens were supplemented with phytase( Reference Abudabos 10 ). Thus, a decrease in activity of endogenous mucosal phytase might also have contributed to different InsP pattern between the phytase and the BD treatments in the small intestine. In the lower ileum, the significant differences between treatments in Ins(1,2,4,5,6)P5 concentration persisted, but the differences in Ins(1,2,3,4,5)P5 concentration did not. An explanation could be that the activity of supplemented phytases was significantly reduced at this point due to increasing pH and/or proteolytic degradation. Igbasan et al. ( Reference Igbasan, Männer and Miksch 35 ) detected a residual activity of 60 and 55 % for an Aspergillus and 87 and 80 % for an E. coli phytase in the jejunal and ileal digesta, respectively. Intestinal phosphatases might continue to hydrolyse InsP3–5 isomers formed by the supplemented PhyE1 and PhyE2, but InsP5 isomers formed by PhyA seemed to be less degradable by intestinal phosphatases. In this regard, Yu et al. ( Reference Yu, Cowieson and Gilbert 64 ) showed that Ins(1,2,4,5,6)P5 was a more potent aggregator of protein at low pH compared with Ins(1,2,3,4,5)P5 which probably would reduce susceptibility of this isomer to phosphatase activity in the intestine.
Conclusions
We conclude that broilers and their microbiota have a high capacity to hydrolyse InsP6 in the intestine. The differentiation between InsP6 hydrolysis products of endogenous or microbiota phytases and their contribution to InsP6 hydrolysis in different segments still requires experimental work. Phytase supplements are more effective in the anterior than in the intestinal segments of the digestive tract, supporting in vitro properties. The main InsP6 degradation products of Aspergillus and E. coli phytases as determined from in vitro studies are also formed in the crop and proventriculus/gizzard of broilers. Differences in InsP6 hydrolysis between PhyE1 and PhyE2 compared with PhyA existing in the crop disappeared until the ileum. InsP4 accumulated in the crop when PhyE1 and PhyE2 were used. However, InsP3 accumulated when PhyA was used. It became apparent that the hydrolytic cleavage of the first phosphate group is not the only limiting step in phytate degradation in broilers.
Acknowledgements
The present study was supported by the Ministerium für Wissenschaft, Forschung und Kunst Baden-Württemberg (through a doctoral fellowship for E. Z.).
We would like to thank J. Boguhn for her assistance in trial planning and implementation.
The authors' contributions are as follows: E. Z. designed and performed the experiments, conducted parts of the chemical analysis, analysed data and drafted the manuscript. M. S. established and optimised the high-performance ion chromatography method and contributed to data presentation and interpretation. I. K. contributed to experimental design and data interpretation. M. R. contributed to all stages of the work, especially in the design, critical reflection on and interpretation of results, and preparation of the manuscript. All authors were involved in the discussion of the results and in editing of the manuscript.
The authors declare that there are no conflicts of interest.


 Open access