

In the mid-nineteenth century, Belgium exported a narrow range of manufacturing products to a handful of destinations. By the eve of WWI, the country had emerged as a workshop to the world. The number of products shipped abroad had more than doubled, as had the number of export destinations. Europe's fifth largest exporter in 1900 (De Leener Reference De Leener1906, Reference De Leener and Mahaim1926), Belgium was clearly punching above its size.
In this article, we reconsider the Belgian trade boom, the acceleration of exports and imports as a share of gross domestic product (GDP), drawing on recent advances in international trade theory with heterogeneous firms, and in empirical work exploiting highly disaggregated bilateral trade data.Footnote 1 In the standard account of the trade boom, the collapse in transport costs precipitated a global surge of exports in labor-intensive manufacture, Belgium's comparative advantage (O'Rourke and Williamson Reference O'Rourke and Williamson1999). Our account differs in several ways. First, we treat explicitly the fixed or beachhead costs of entering a new destination and creating a market for a new product. Not all goods reached all markets. Based on the comprehensive reports prepared by an international network of trade diplomats, we explore the idea that the diffusion of business intelligence lowered the threshold of setup costs in certain markets and for selected goods.
This article's second innovation is the sharpened attention on demand structure and industrial organization. The effect of trade costs on trade was mediated by the degree of product differentiation and the heterogeneity of firm-level productivity within industries. Manufacturing exports comprised a range of goods from highly differentiated to standardized items. Industrial structure was equally heterogeneous, industries consisting of firms of various sizes using different vintages of technology. Productivity records varied across industries, as did rates of entry and exit.
A third innovation consists of the new disaggregated trade dataset we assembled for Belgium between 1870 and 1910. The granular data provide the basis for the decomposition of the growth in trade into the contributions of the intensive and extensive margins. The intensive margin is measured as the value of bilateral exports per product; the extensive margin as the number of products exported to a destination.Footnote 2 Using theory to frame the empirics, we assess the relationship between fixed and variable trade barriers on the export margins.
Finally, we consider the association between international trade and productivity. The typical new model of trade with heterogeneous firms anticipates a strong positive relationship.Footnote 3 There are few historical studies of this relationship like that we propose. We provide a framework to identify circumstances in which a collapse in trade costs promoted strong productivity growth and those where the relationship was weaker.
Our interpretation of the drivers of Belgian international trade can be summarized as follows. Because of the sharp decline in fixed and variable trade costs, the acceleration in trade was as much about the expansion in the number of products delivered and markets served as it was about shipping more of the same items. In fact, the contribution of the extensive margin to the growth in trade exceeded that of the intensive margin. The intensive margin was responsive mainly to the fall in variable costs; the extensive margin was responsive to the decline in variable and fixed costs. In sectors grouping a diverse mix of large and small firms the extensive margin was small, but where firms were of roughly the same size, the opposite held. These findings cast a new light on the nature of the global trade boom before 1914. Despite the presence of large and rich commercial rivals, Belgium, like other small players, was able to reduce specific trade costs and grow market share. Our examination of the link between international trade and productivity growth suggests caution. Echoing recent research (Segerstrom and Sugita Reference Segerstrom and Sugita2015), we find that a strong positive relationship in certain sectors was offset by a weaker relationship in others, such that the overall association between trade and productivity in Belgium was modest.
Aside from data availability, our choice of Belgium merits comment. In many ways, Belgium was a microcosm of late nineteenth-century Europe. At the crossroads of the continent, it shared a common institutional framework, the legacy of longstanding commercial and political relations with its neighbors, and it participated in, if not initiated, international trade agreements on the Protection of Industrial Property (1883) and the Brussels Convention on unfair competition (1900). And like many of Europe's small economies, it maintained low tariffs in the face of rising protectionism on the continent (Bairoch 1989, pp. 42, 59, 76; O'Rourke and Williamson Reference O'Rourke and Williamson1999, pp. 98–99).
The article brings a novel approach to several themes in the economic history of globalization before 1914. In a widely accepted explanation of the relationship between trade and prosperity, Kevin O'Rourke and Jeffrey G. Williamson Reference O'Rourke and Williamson1999 (pp. 57–76) invoke a factor-endowment framework to emphasize the period's signature trade: the exchange of New World resources for Old World manufactures.Footnote 4 Here we consider firm productivity and intra-industry trade. Classic studies of the decline in trade barriers (North Reference North1958; Harley Reference Harley1988), and more recent evaluations (Shah Mohammed and Williamson Reference Shah, Saif and Williamson2004; Jacks and Pendakur Reference Jacks and Pendakur2011), have tended to concentrate on transport costs, normally classified as “variable” or ad valorem, partly due to the availability of information on freight rates or tariffs. We identify an essential role for fixed costs in the trade boom.
International Trade and Economic Growth in Belgium, 1870–1914
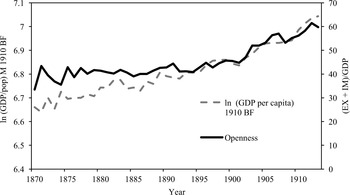
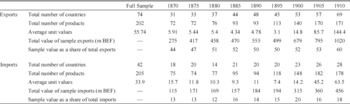
Belgium's international exposure increased at a rate of 1.1 percent per annum between 1870 and 1900, and 1.5 percent in the shorter period from 1900 to the eve of the war measured by the share of exports and imports in GDP in Figure 1.Footnote 5 On a per capita basis, the surge in Belgium's trade was the most pronounced in Europe.Footnote 6 Its aggregate performance, however, masks differences across sectors and products. To anticipate our findings, Table 1 assembles several dimensions of export performance for some representative sectors. Firm structure is an indicator of the distribution of firms by size within a sector, size being presumably correlated with productivity as in modern trade models. We anticipate that an industry with a high concentration of several large firms, and some smaller ones, would have greater heterogeneity than an industry populated by firms of nearly equal size. The metal and machine industries were dominated by a cluster of technologically advanced large firms (Brion and Moreau Reference Brion and Moreau1995, p. 104); the distribution of firms was moderately less heterogeneous in glass manufacture, although it retained an oligopolistic structure (Douxchamps Reference Douxchamps1951 pp. 495, 510). There were few large firms in cotton textiles and linen, the dispersion in firm size being relatively narrow (Van Houtte Reference Van Houtte1949, pp. 101–02, 229).Footnote 7 Intensive growth in trade refers to increase in the value of shipments per product, while extensive growth refers to the number of new products delivered to each destination or the number of new destinations. There was variability in the value of shipments with rubber exports outstripping linen goods by a factor of ten, as there was in the number of new products delivered and new destinations served, for instance the addition of 10 types of machinery exports and 21 new markets for cotton textiles between 1895 and 1910.
Trade Openness and Real GDP per capita, 1870–1913
The standard account of the trade boom (1870–1914) starts with the transport revolution that in Belgium can be dated to the opening of the Scheldt and subsequent investments in the port of Antwerp (Loyen Reference Loyen, Loyen, Buyst and Devos2002). Maritime freight rates fell by about 30 percent during the boom, much of the decline happening before 1900 (Jacks, Meissner, and Novy Reference Jacks, Meissner and Novy2010; Jacks and Pendakur 2011). Because of investments in rail and canal networks, the fall in shipping costs was matched by that of inland freight rates.Footnote 8 Although Antwerp remained the major traffic hub, the share of five other international ports (in order of importance: Ostend, Ghent, Brussels, Bruges, and Nieuwpoort) increased over the period. According to one maritime historian (Suykens Reference Suykens1986, p. 375), competition among ports compelled Antwerp to maintain the lowest pilotage and loading fees in Europe.
The fall in transport costs, while substantial, did not ensure Belgium foreign market access, if only because all countries benefited from lower freight rates. In sharp contrast, fixed and beachhead costs (Baldwin and Forslid Reference Baldwin and Forslid2010) of gaining presence in international markets and introducing new products were considerable and idiosyncratic, varying across items and destinations. These costs comprised, but were not restricted to, gaining familiarity with local market conditions, establishing or accessing wholesale networks, and learning about shipping methods and customs' formalities. Belgium, however, faced particular disadvantages in marketing its goods abroad. Unlike France and Great Britain, the country did not reap the rewards of a large empire, and unlike Germany and Italy it could not rely on emigrants to promote its goods back home. Footnote 9
Product Markets, Firm Structure, and Exports: Selected Industries
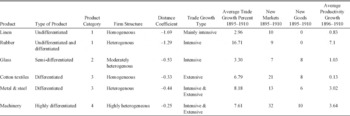
Notes: Product definitions and categories from Appendix. Linen (codes 310, 311); rubber (369); glass (391-402); cotton textiles (328-345); metal & steel (410-424); machinery (437-462).
Sources: Firm structure: Belgium (1907); Delbeke (Reference Delbeke1982); Douxchamps (Reference Douxchamps1951); Van der Wee (Reference Van der Wee, Coleman and Mathias1984); Van Houtte (Reference Van Houtte1949). Distance coefficient: Table 5. Trade growth type: authors' calculations. Trade growth, new markets, and new goods: Belgium, Tableau(various years). Productivity growth from Gadisseur (Reference Gadisseur, Van der Wee and Blomme1997).
Belgium pursued a mixed strategy of reducing fixed costs. From the 1860s, the country accorded most-favored-nation (MFN) treatment with its close neighbors and new trading partners.Footnote 10 The number of treaties actually peaked after protectionism reemerged in France and Germany. In addition, Belgium signed general trade agreements, traités d'amitié, for example with Venezuela in 1884, and specific treaties, such as protocols safeguarding product design and trademarks with Romania in 1881 (Traités de commerce 1900). The adoption of the gold standard (1878) progressively locked in exchange rates with commercial partners and reduced the financial risk of traders.Footnote 11
Belgium's comparative advantage seems to have been embedded in its particular institutional framework (Nunn and Trefler Reference Nunn and Trefler2013), the outcome of the role it had fashioned for itself in the international community. As a small, open, and non-aligned country, Belgium sought to participate, and often initiate, international networks, such as those in the fields of labor and social reform, and science. The state's engagement in nurturing trade networks was an extension of this focus. At home, the country hosted a series of international trade fairs (Antwerp 1885 and 1894; Brussels, 1888, 1897, and 1910; Liège 1905) that showcased export lines. Abroad, Belgium was the first foreign country to have a chamber of commerce in New York (Bairoch 1989, p. 97). Thus the state assumed responsibility for establishing an international presence in support of commercial interests.
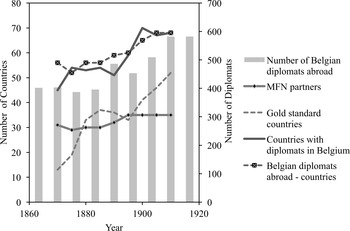
From an early date, the state invested considerable resources in developing an extensive network of consular offices. The first delegates around 1850 were located in neighboring countries, but, as early as 1870, Belgium was represented on all continents, even when trade with many of these regions was trivial or non-existent. By 1900, of the nearly 600 representatives (some of whom were actually foreign nationals) in 84 destinations (independent countries and colonies), more than half were located outside the European core (De Leener Reference De Leener1906, p. 209).Footnote 12 Altogether, spending on political and consular agents rose from 0.6 million francs in 1860 to 1.5 million in 1890 (Bairoch 1989, p. 96). The consular network was complemented by the presence of foreign representatives in Belgium. In Figure 2 we plot available information on Belgian and foreign diplomats, along with other means the country employed to manage trade costs. While the presence of foreign representatives in Brussels saw a steady rise, the growth in MFN partners after 1890, and in the number of Belgian delegates abroad and gold standard countries after 1895, went hand in hand with the acceleration in trade in the decades before WWI.
The reports of the trade delegates, published annually in the Recueil consulaire(RC), provided an exceptional source of business intelligence for Belgian manufacturers.Footnote 13 The résumé on Chile (Belgium RC, vol. 63, 1888, pp. 325–53) concentrated on exchange rates, tariff policy, and internal transport; that for Japan (RC, vol. 39, 1882, pp. 23–71) on consumer preferences and freight rates; the report on the Philippines on packaging, labeling, and the importance of keeping to contractual deadlines (RC, vol. 142, 1908, pp. 492–501). Ever practical in their outlook, the consuls gave recommendations on opportunities in individual markets. The representative (RC, vol. 53, 1885, p. 138) in Lisbon acknowledged that, although the productivity of British cotton-textile workers was superior and that Lancashire's hold on foreign markets in “sheetings” and “shirtings” was unshakable, Belgian firms had opportunities for “towlings, embroidered textiles, checked domestics,” and other narrow varieties.Footnote 14 Differentiated goods would appear to have benefited most from the investment in trade delegates, the growth in new markets for these goods exceeding that of more standardized items (Table 1). In this way, the Belgian state effectively subsidized the costs of conducting business abroad.
Diplomatic Representation and Other Trade Costs
International Trade with Fixed and Variable Trade Costs: A Conceptual Framework
Thomas Chaney's (2008) model of international trade with heterogeneous firms guides our inquiry of Belgian trade. The signature feature of this new vintage of trade theory lies in the decomposition of the effects of fixed and variable trade costs on the intensive and extensive margins of trade.
On the demand side, consumers in each country are identical and have a love of variety. Consumers can purchase from a set of goods, with each good k being produced by a number of firms that are heterogeneous with respect to productivity. Each product, k, is allowed to have a different elasticity of substitution between varieties, σk, such that varieties of a product with higher s are closer substitutes for each other. Heterogeneity in firm-level productivity is summarized by the Pareto distribution shape parameter γ. As γ increases, firms are more homogeneous and productivity more uniform. Since we have no information on shipments by firm and are restricted to product level data, our specification of the Chaney model equates each item exported as a variety produced by a representative firm, or a set of firms within which individual concerns are sufficiently homogenous and which share a common elasticity of substitution. We assume, however, heterogeneity in productivity across products. Thus, a sector k consists of a group of products. We are interested in the bilateral value of exports for a sector k, the value of exports per good in a given sector, and the number of exported goods of each sector.
We ask which goods are produced in equilibrium and then, for given variable and fixed trade costs, which goods, if any, are exported to a given country and at what value. In general, only firms that can cover the fixed costs of entry will produce and, within this set of firms, only the most productive (and presumably largest) firms are able to export because they meet the expenses incurred in gaining international exposure. Exceptionally, in export markets for brand items, small firms can survive. Since trade costs (fixed and variable) can vary by destination, so too does the range of goods exported. When firms face lower costs of selling abroad, the productivity threshold of entry into that sector recedes, competitive domestic firms become exporters and new goods are traded.
Chaney (Reference Chaney2008) thus provides the theoretical framework to study empirically the effects of changes in variable and fixed trade costs on bilateral (aggregate) exports for a sector, exports per firm (the intensive margin), and the number of firms engaged in export activity (the extensive side). Variable trade costs affect both margins. The elasticity of exports to a country dfor sector kwith respect to a change in variable trade costs is given by the sum of the elasticities on the intensive margin and extensive margins:
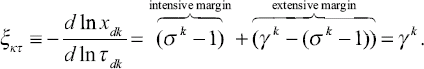
The first component, (σk –1), implies that the effect of a fall in variable trade costs on the intensive margin (or exports per good) is magnified by a higher degree of substitutability between goods which is the basic Krugman (Reference Krugman1979) result with homogeneous firms.Footnote 15 The innovation of the Chaney model lies in the second part of the equation, the extensive margin. The key insight is that σ has opposite signs on the two margins. When σ is small, that is a low degree of substitution, competitive pressures are weak and the sector is populated by relatively few firms. As variable costs contract, new entrants can capture market share, thus increasing trade conducted at the extensive margin, and to a greater degree than if σ were large. The other strong prediction is that, in a gravity regression for totalexports in a given sector, the overall elasticity of export values for a change in variable trade costs is larger as firm-productivity heterogeneity declines, or γ increases.Footnote 16
Consider now the effects of changes in the fixed costs of trade. In this setup, the elasticity of bilateral exports of a given sector k, with respect to a change in the fixed costs of trade, is given by:
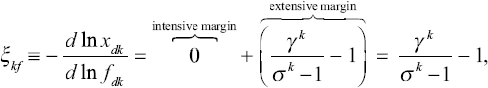
where fdenotes the fixed costs of exporting a specific good. Fixed costs affect the total value of trade, but only through the extensive margin, the second component in the equation. The intuition is that demand for a particular good is not related to fixed costs; rather these costs determine the entry decisions of goods (firms). The degree of product differentiation affects the elasticities on the extensive margin and on total trade with respect to fixed costs of trade positively. In industries with significant heterogeneity in productivity, the overall elasticity is expected to be small in absolute value.
Several key predictions of this model motivate our reappraisal of the trade boom. We study the proposition that the decline in variable trade costs affects both intensive and extensive margins, but that the decline in fixed costs is associated with changes only in the extensive margin. And while the (absolute value of the) elasticity of trade with respect to variable trade costs depends inversely on the level of heterogeneity of productivity within a sector (or a class of goods as in our case), that with respect to fixed costs is related to the ratio of the elasticity of substitution and the heterogeneity parameter.
Boats, Cars, and Trams: A Granular Look at the Belgian Trade Boom
Our main information source is the Tableau général du commerce extérieur from which we have recorded trade in manufactured goods, which represented about 50 percent of all exports in 1900 and 20 percent of all imports. We have data at five-year intervals from 1870 and until 1910.Footnote 17 The Tableau separates goods in transit from those manufactured in Belgium. It specifies shipments by all means of transport which remained relatively unchanged over the period. For exports, about 45 percent of goods were shipped by boat, 45 percent by land transport, and 10 percent by barge using the canal and river system.Footnote 18
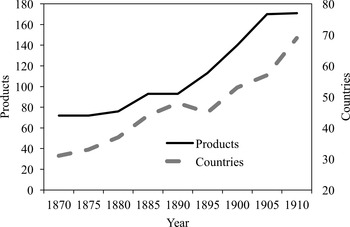
In Figure 3 we depict the growth in the number of export items and destinations. The expansion in products began in 1880, plateaued temporarily, and then had a sharp break after 1890; the growth in destinations was steady, reflecting, undoubtedly, the upper limit in the potential number of outlets. By 1910, the Tableau'slisting of approximately 70 destinations was a considerable achievement, since there were less than 200 possible trading partners at this date, comprised of sovereign states, colonies, and territories. But the figure conceals important variation in the number of products delivered and destinations served across space and over time. France, an adjacent and big trading partner, received the largest number of products, but countries poles apart, and at different levels of development with different commercial policies and population sizes, like Switzerland, the United States, and Argentina, imported the same number of products. Canada and Japan became trading partners of Belgium around the same time and had a similar range of imports including transport equipment and glass. Market expansion operated along extensive and intensive margins in tandem. In 1870, the typical product/export would have reached an average 17.75 destinations.Footnote 19 Goods exported continuously in the 20 years after 1870 had, on average, 26 markets. Thereafter, the number of destinations leveled off.Footnote 20 This pattern is consistent with sizeable fixed costs of entry, firms obtaining information about local preferences in a handful of markets and then deepening sales (Albornoz et al. Reference Albornoz, Hector, Pardo and Corcos2012; Besedeš and Prusa Reference Besedeš and Prusa2006).
Export Products and Destinations, 1870–1910
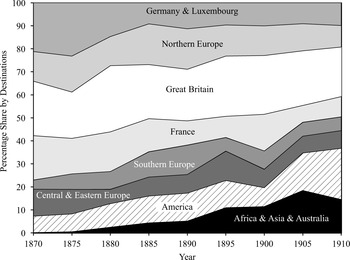
The range of goods traded (Figure 4A) and the breadth of destinations (Figure 4B) widened over the period. The relative share of textile exports receded from nearly 50 to about 30 percent between 1870 and 1910. The share of clothing, metal products, and vehicles increased. The decline in the textile share as a major export item clashes with Herman Van der Wee and Marine Goossens's (1991, pp. 113–14) description of fin-de-siècle Belgium being “ossified, rigid, and imprisoned in traditional, unviable sectors, without economic future.”Footnote 21 In terms of destinations, Europe bought more than 90 percent of exports in 1870; by 1910 its share had dropped to about 65 percent, replaced by new markets in Africa, the Americas, and Asia. On the import side, Belgium purchased manufacturing goods from 28 countries in 1910, an additional 10 sources since 1870.
Export Shares by Industry, 1870–1910

Export Shares by Destination, 1870–1910
Between 1880 and 1895, the extensive dominated the intensive margin.Footnote 22 There was a good deal of churning: new goods were being developed, and there was also a non-trivial proportion of exiting goods, perhaps indicating experimentation or a failure to achieve a foothold in new markets and deepen market presence. Continuing or incumbent goods gained in importance as markets became secured after 1895, the intensive topping the extensive margin in this period as a result. Overall, the contribution of new goods (58 percent) exceeded that of continuing goods (45 percent).
The portrait of international trade that emerges from the Tableau differs considerably from that usually described by economic historians for Belgium, and even for the rest of the world. In the factor-endowment trade model of O'Rourke and Williamson, goods are presumed to be homogenous, and as trade costs decline differentially endowed countries would ship more of the same types of goods. The canonical Paul Krugman (Reference Krugman1979) model of imperfect competition assumes that each destination purchases the full set of goods, if they are exported at all. The dataset we have assembled adds to our understanding of the development of country and world trade at the beginning of the twentieth century. The expansions in products and in destinations were the defining features of the Belgian trade boom.
Trade Costs and the Intensive and Extensive Margins
We now use the Chaney model more formally to study the evolution of trade. First, we classify products into four categories, from standardized to highly differentiated goods. We examine whether changes in trade costs affected categories differently. A stable relationship implies that consumers saw products as undifferentiated, suggesting that standard models (which do not presume firm-level heterogeneity in productivity) provide a reasonable framework in which to situate the Belgian trade boom, while new trade models predict that the effect of variable costs, like distance, would have diminished along with the degree of product differentiation. Second, we explore the effect of trade costs on the margins of trade. Our intent here is to gauge whether or not fixed costs had any effect on the intensive side.
Baseline Estimates
To begin, we divide products into four categories of differentiation based on information gleaned from the Recueil consulaire.Footnote 23 In their recommendations on market opportunities, trade delegates classified goods by the degree of overlap or substitution between Belgium's and other countries' product lines. Category 1, the least differentiated items, comprises labor-intensive manufactures, for instance, threads, hides, parchment, and paving stones and cheap metal products destined primarily for the domestic market. These goods faced stiff competition abroad. Category 2 goods consist of differentiated semi-skilled industrial goods and textiles. The Tableau in 1910 identifies exports and imports of 17 varieties of cotton textiles (items 38–55 in the Appendix). Category 3 includes semi-skilled and skilled-manufacturing goods with substantial capital input (fashionable textiles, crystal, and elaborate and finished metal products). Category 4, the most differentiated goods, comprises expensive capital-intensive items, such as transport equipment, machines, and machine tools. By the turn of the century, Belgium exported trams made of copper, iron, steel, and wood (items 164–167). To be clear, we impose no assumption about the correspondence between product differentiation and firm-level heterogeneity. For instance, from Table 1, the rubber industry which manufactured a mix of both standardized and specialized goods comprised several large technologically advanced firms. According to one estimate, three establishments accounted for half the workers in this sector (Belgium, Office du Travail, 1907, p. 195).
We use a standard gravity model to study the association between bilateral exports and the decline in trade costs. As in Martina Lawless (Reference Lawless2010a, Reference Lawless2010b; also Dutt, Mihov, and Van Zandt Reference Dutt, Mihov and Van Zandt2013), we are restricted to country-level data. Our sample covers 74 potential destinations every five years from 1870 to 1910. We are missing 27 country year observations, leaving a sample size of 639. Since GDP data are limited, we use population of the trading partner as our measure of size. In each year, the number of goods exported to a destination is limited to the number of actively exported products. The Poisson pseudo-maximum likelihood (PML) model we adopt allows us to include destination-years with zero trade. The Appendix describes more fully the nature of the panel data used in the gravity regressions.
We include proxies that could be considered either as variable or fixed costs in our regression specification. Diplomatic representation both in Belgium and abroad could, in principle, proxy for the fixed costs of gathering market intelligence and obtaining assistance with customs forms and regulations. These expenses do not depend on the value of product shipped. Other possible indicators of fixed costs include whether or not the trading partner shared a common border and language with Belgium, ratified a trade agreement, and pegged its exchange rate. To the extent these policy variables increased information and decreased uncertainty, they lowered fixed trade costs and promoted exports. We also include an indicator variable for whether or not the trading partner is a colony of another country. We anticipate that Belgium had a disadvantage accessing markets in other European countries' possessions.
To approximate the variable costs of trade, in the absence of direct information on freight rates, we use great circle distance in kilometers between national capitals, given as the logarithm of distance. To be sure, distance could include elements of the fixed costs of doing business abroad (Grossman Reference Grossman and Frankel1998). Since it would be problematic to classify fixed and variable costs based on qualitative information alone, we rely on theory to guide our predictions of which proxies are more likely to be a fixed cost, and which are likely to affect trade in the manner we expect an ad valorem/iceberg trade cost to do. Recall that the decline in fixed costs is associated with changes in the extensive margin only. While we cannot be definitive about our breakdown of fixed and variable costs, we are comfortable with our modeling strategy.
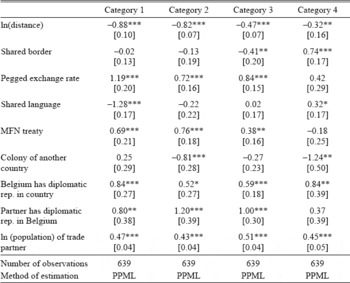
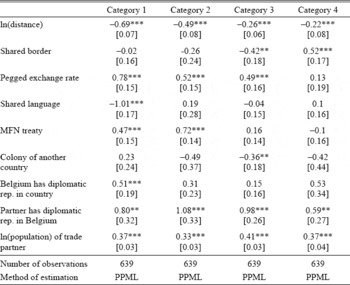
Table 2 reports a regression for total export values by category (C is category 1,…,4, d is a destination, t subscripts years, and Vindicates parameters allowed to vary according to the dependent variable—here total value) of the form:
The results confirm that the effect of distance, or ad valorem trade costs, varied by the degree of product differentiation in each category. Exporters depended on proximity to sell more goods. Doubling distance would decrease trade by up to 88 percent for category 1 goods, but only reduce that of category 4 products by 32 percent. The decrease in the absolute magnitude of the distance coefficient across categories is consistent with other studies and new trade theory (Crozet and Koenig Reference Crozet and Koenig2010).
The results in Table 2 also cast light on the role of fixed costs, and hence firm entry. The pegged exchange rate regime and MFN treaty coefficients are significant in categories 1–3, but not in category 4. Adoption of the gold standard from 1880 onwards would have been associated with an increase of trade of 228 percent for category 1 products, a figure consistent with that proposed by J. Ernesto López-Córdova and Christopher Meissner (Reference López-Córdova and Meissner2003), and 131 percent for category 3 products. Signing an MFN treaty is associated with a 100 percent rise in trade for category 1 and about 46 percent for category 3. For categories 1 and 3, the significant and positive coefficients of Belgian representation abroad and foreign diplomats in Brussels confirm the role of new and improved intelligence on trade. For the most highly specialized goods in category 4, reputation appears to have been a more important determinant of sales than a MFN clause or foreign representation in Brussels. Perhaps Belgium negotiated accords with long established trading partners, and, concurrently, lowered effective ad valorem tariff rates (Lampe Reference Lampe2011). We examine the possibility of endogeneity in our robustness checks later. But it may also have been the case that a MFN agreement was less effective in opening doors than diplomatic ties, since trade in differentiated goods was dependent on informal “related” networks abroad (Rauch Reference Rauch1999).
Determinants of Total Value of Trade for Belgian Exports by “Level of Differentiation,” 1870–1910
p-value<0.1
p-value<0.05
p-value<0.01
Notes: Dependent variable in each column is the ratio of the value of exports to the number of goods exported to country d at a given level of differentiation. Method of estimation is Poisson PML. Category 1, the least differentiated goods, include labor-intensive manufactures and manufacturing inputs, such as leather, thread; category 2, semi-skilled industrial goods and textiles, such as glass, paper, and some cloth and fabric; category 3, semi-skilled or high skilled manufacturing goods with substantial capital intensity, for instance, elaborate fabrics and clothes, finished metal and fine glass; category 4, the most differentiated goods, include high unit value capital-intensive manufactures, such as tramways, ships, machines, and machine tools. Time dummies included but not reported. Sample includes 1870, 1875,…,1910. Robust standard errors clustered over destinations are reported in brackets.
Sources: Belgium, Tableau (various years) and Appendix B.
Colonies of other nations posed a high barrier of entry for category 4 goods. For instance, Belgium was renowned for its streetcars, builders having customers in 40 destinations in 1910, but exports to British, French, and Portuguese possessions proved elusive. According to Alberte Martínez López (2003), sales of tramways and investments in supporting infrastructure were directed to the Middle East and Southern and Eastern Europe, since U.K. manufacturers of similar goods invested heavily in the British Empire. To face the risks involved in exporting in these countries, tramway builders relied occasionally on the support of large holding groups that secured the rights to construct and operate lines (Brion and Moreau Reference Brion and Moreau1995).
Product Differentiation, Productivity Heterogeneity, and the Margins of Trade
We now explicitly examine the effects of trade costs on trade margins. For each category, our regressions take the form:
![\[
\begin{array}
\mathrm {Intensive\,Margin}=\frac{\mathrm {Exports}_{dt}}{\mathrm{Number\,of\,Goods}_{dt}}=\mathrm{exp}[\delta_t+x'_{dt}\beta^{IM}]+\epsilon _{dt},\end{array}
\](https://static.cambridge.org/binary/version/id/urn:cambridge.org:id:binary:20170301095213664-0848:S0022050717000018:S0022050717000018_eqn4.gif?pub-status=live)
where βIM indicates the parameter estimates for the intensive margin and βEM indicates the parameters for the extensive margin
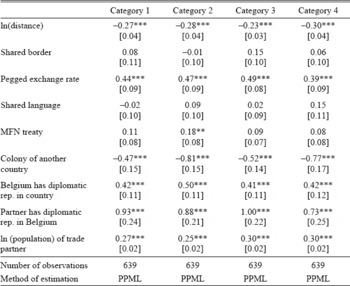
The results for the intensive margin are given in Table 3. As expected, the effect of distance on the intensive margin declines across categories. Several variables, including diplomatic representation, colonial status, and shared language, are statistically insignificant and relatively small. These variables approximate information available to manufacturers about foreign markets, and other technical, political, and economic barriers that comprise the beachhead costs of trade. While variable costs matter on the intensive side, fixed costs do not.Footnote 24
Determinants of Intensive Margin (Total Value/Number of Goods) for Belgian Exports by “Level of Differentiation,” 1870–1910
p-value<0.1
p-value<0.05
p-value<0.01
Notes: Dependent variable in each column is the total value of exports exported to country d at a given level of differentiation. Method of estimation is Poisson PML. Category 1, the least differentiated goods, include labor-intensive manufactures and manufacturing inputs, such as leather, thread; category 2, semi-skilled industrial goods and textiles, such as glass, paper, and some cloth and fabric; category 3, semi-skilled or high skilled manufacturing goods with substantial capital intensity, for instance, elaborate fabrics and clothes, finished metal and fine glass; category 4, the most differentiated goods, include high unit value capital-intensive manufactures, such as tramways, ships, machines, and machine tools. Time dummies included but not reported. Sample includes 1870, 1875,…,1910. Robust standard errors clustered over destinations are reported in brackets.
Sources: Belgium, Tableau (various years) and Appendix B.
Table 4 reports results on trade costs and the extensive margin.Footnote 25 Here the impact of our proxies for trade costs (such as the exchange rate and diplomatic representation) are significant and stable, the coefficients (and unreported marginal effects) having roughly the same magnitude across industries and goods. The distance coefficient of 0.27 (column 1, Table 4) suggests that a doubling of distance would decrease the number of goods exported to a destination by 27 percent. Magnitudes are similar across categories. Diplomatic representation by Belgium is associated with a 52 percent rise in the number of goods exported to a destination for category 1 products. A plausible explanation of the absolute decline in the distance elasticity as we move to higher product groups is a corresponding decline in the elasticity of substitution. If this were indeed the case, and the level of firm heterogeneity was constant across categories, then the coefficients on trade-cost proxies ought to decline across the columns in Table 4. However, this does not happen. An alternative explanation is that the effects of variable and fixed costs depend on the ratio or the difference of the heterogeneity parameter and the elasticity of substitution as shown in equations (1) and (2). Because most of these coefficients do not change appreciably across categories, we interpret these results to mean that the degree of heterogeneity in firm-level productivity increased, or γ declined, in proportion to the augmentation in the degree of product differentiation, a smaller σ. Other studies of the extensive margin report similar findings (Crozet and Koenig Reference Crozet and Koenig2010).Footnote 26
Determinants of Extensive Margin (Number of Goods) for Belgian Exports by “Level of Differentiation,” 1870–1910
p-value<0.1
p-value<0.05
p-value<0.01
Notes: Dependent variable in each row is total value of exports of industry kto country d for nine years 1870, 1875,…1910. Method of estimation is Poisson PML. Time dummies, item dummies, and other controls from the gravity model are included but not reported. Sample includes 1870, 1875,…,1910. Robust standard errors clustered over destinations are reported in brackets.
Sources: Belgium, Tableau (various years) and Appendix B.
The fate of the glass industry under open economy pressures illustrates the independent and joint effects of differentiated goods and firm heterogeneity. In 1870 the industry manufactured standardized goods that faced stiff competition in foreign markets. Over time, the industry came to produce more differentiated items (RC, vol. 90, 1895, pp. 126, 304, 388, 421), supplied by the establishment of several new, technologically advanced, large firms (Douxchamps Reference Douxchamps1951). The changes in demand and supply seem to have had opposing, if not equal, effects. The expansion in trade was modest as a result, with only seven new markets and eight new products, most of the growth after 1895 being attributed to the intensive margin (Table 1).
In summary, on the intensive side, the effect of declining variable costs increased with the elasticity of substitution. On the extensive side, the availability of new and improved information about markets and reduced uncertainty, among other factors, fed the expansion in products and possibly in destinations too. In industries exhibiting a considerable degree of product differentiation, new entrants in export activity could sell goods in distant markets. But there was a flipside to this story. The effect of trade costs varied inversely with the degree of firm heterogeneity. In the next section, we look at the implications of these offsetting forces on the relationship between productivity and growth.
Robustness Checks
Our estimation strategy raises several concerns. It can be argued the policy variables in the baseline regressions are endogenous to trade flows. For instance, suppose that trade diplomats were stationed in countries that had previously established strong trade relations with Belgium. To check for this possibility, we included leads and lags of five years for MFN, pegged exchange rate, and diplomatic variables in regressions shown in Table 2–Table 4. We also include the contemporaneous values. The Appendix gives full details of our procedure and reports some of our results. Few of the leads are significant with the potential exception of the establishment of Belgian diplomatic relations for category 1 and category 3. Because the lead and lag estimates are less consistent across estimations, we stand by our initial claim that the positive impact on trade of diplomatic representation, ratifying treaties, hosting diplomats, or achieving a pegged exchange rate was largely independent of established commercial relations or unobservable factors driving expectations of future trade prospects in specific categories of goods. Instead, many of these policies seem to have been put in place to create new trade opportunities.
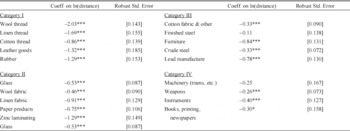
Another concern is that our results may be dependent on our categorization of goods. To check for this at the product level we examine the effects of the variable costs of distance on trade. To start, we aggregated products into 20 different industries.Footnote 27 We run a Poisson PML regression for total exports of each industry to country d at time t. We report the distance coefficient only to illustrate how the trade-cost elasticity depends on variable trade costs; all other trade-cost controls are included in the regressions. The results in Table 5 are in line with those we have reported using the breakdown by categories. Producers of standardized goods, like wool and linen threads, were restricted to customers closer to home; distance impeded trade even for goods with a high value to weight ratio. These industries' export growth was mainly on the intensive side, deepening sales to existing markets at the expense of expanding the number of destinations (Table 1). For instance, the rubber industry benefited from cheap raw material from the Congo—a good example of how empire reduced trade costs—but had difficulty in growing the number of markets because of foreign competition, mainly British and French (Belgium, Office du Travail, 1907, pp. 206–07). Interestingly, geography proved to be a low barrier for textiles (high value to weight ratio), as it was for steel (low value to weight ratio). Both items, however, exhibited a high degree of differentiation. Machinery and tramways, typical category 4 goods, were sent all over the globe despite their considerable bulk. In all, there appears to be no loss of information using the categories behind Table 2.
Coefficients on Distance for 20 Industries, 1870–1910
p-value<0.1
p-value<0.05
p-value<0.01
Notes: Dependent variable in each row is average annual growth rate of labor productivity in industry γ. Method of estimation is OLS. Observations are weighted by their export values in 1880. A constant is included in each regression but not reported. Sample includes two periods for each industry which cover 1880–1895 and 1895–1910. Furniture had no exports in 1880. It is excluded from the sample since the growth rate of exports is not defined. Robust standard errors clustered over destinations are reported in brackets.
Sources: Belgium, Tableau (various years) and Appendix B.
The Margins of Trade and Productivity
In heterogeneous-firm trade models an across the board reduction in fixed or variable costs may prompt formerly uncompetitive firms to begin exporting. New entrants should be at least as productive as foreign rivals since enhanced import competition forces the exit of the most inefficient firms in the domestic sector. Market share of the most productive firms expands. Taken together, aggregate productivity rises in the standard case of an across the board fall in variable trade costs.Footnote 28 A large body of research has focused on this type of selection (Bernard and Jensen Reference Bernard and Bradford Jensen1999; Melitz Reference Melitz2003), reinforcing the convention that trade liberalization improves welfare arising from firm selection and higher productivity.
Our contribution in this article is to exploit the new trade data we have assembled, alongside existing information on industry output, to investigate a reduced form relationship between trade and productivity. Historical data on productivity are not as detailed as that for exports and imports, so we are limited to using Jean Gadisseur's (Reference Gadisseur1980, 1997) estimates of real labor productivity and output growth for 20 industries for two subperiods, 1880–1896 and 1896–1910. These 20 industries span our four categories of differentiation. We match as many goods as possible from our trade dataset to these 20 industries. We recognize the limitations of our approach, but the Gadisseur sample constitutes nearly the entire set of industries engaged in trade, and comprises 80–90 percent of the products actually exported. Average productivity growth of these industries in the first period, 1880–1896, was 1.08 percent (1.26 on an export value-weighted basis), and for 1896–1910, 3.03 percent (2.45 percent on a weighted basis). These averages mask significant industry-level variation. We estimate a difference-in-differences (DID) model for the average impact of exports on the level of industry productivity. The model exploits variation in a continuous measure of treatment intensity, some industries receiving higher growth in exports relative to production than others. We exploit industry data in two waves, 1880–1896 and, 1896–1910, with the baseline or pre-treatment years being 1880 and 1896, and the corresponding post-treatment periods being 1896 and 1910. In later specifications we use an instrumental variables strategy to address the concern that the export share is endogenous. We also allow for heterogeneous slopes to deal with issues of selection (on observables).
To begin, we posit a (log) linear relationship between productivity levels in an industry and the level of exports to total output. Since we only observe growth rates in our data, we work in first differences of this model which also eliminates industry fixed effects (unobservables affecting inter-industry differences in levels). We then estimate the following regression:
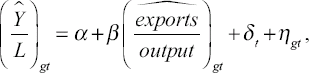
where t denotes one of two time periods (1880–1896 or 1896–1910), g is an industry, Y is real output, L is the number of workers, and the hats represent average percentage growth rates. We include a period indicator for 1896–1910 to control for economy-wide shocks to the growth rate of productivity across the two time periods.Footnote 29 In each period, industries experienced different rises in the level of trade depending on the change in trade costs and on the industry specific parameters we have previously introduced. This, together with the strategy of working in first differences, leads us to interpret β in equation (6) as a difference-in-differences estimate of the elasticity of productivity with respect to the export to output ratio.
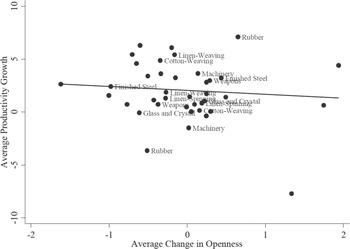
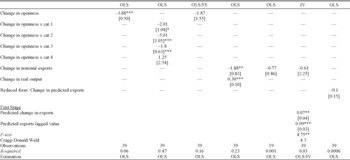
For our panel of 20 industries over two time periods, we plot in Figure 5 the relationship between the percentage change in openness (the difference in the change in the log of exports and cumulative output growth in percentage terms) and average productivity growth. The “circles” represent each of the 20 industries of Gadisseur (1997, pp. 178–79) in the two periods. Overall, the trade boom did not have much of a positive impact on productivity growth, if anything the relationship was negative. Column 1 of Table 6 reports the regression underlying Figure 5. The coefficient on the change in openness is –1.88 and is highly statistically significant, implying that industries having the highest growth in exports relative to output had significantly lower growth rates in labor productivity. A one standard deviation increase in openness is associated with a one-half standard deviation decline in the dependent variable.
Average Productivity Growth and Average Openness, 1880–1910
The estimated relationship from column 1 of Table 6 could be biased by endogeneity or simultaneity problems. Output growth enters directly on both sides, and other forces, not captured here, could have been acting to change exports and productivity at the same time. To limit these problems, we follow an instrumental variables approach related to that in Jeffrey Frankel and David Romer (Reference Frankel and Romer1999) who use ostensibly exogenous geographic information from a gravity model to predict trade at the bilateral level, and then use predicted total trade as an instrument. Specifically, we run a gravity regression of the following form:
OLS and Instrumental Variables Regressions, 1880–1910
p-value<0.1
p-value<0.05
p-value<0.01
Notes: Dependent variable in each row is average annual growth rate of labor productivity in industry γ. Method of estimation is OLS. Observations are weighted by their export values in 1880. A constant is included in each regression but not reported. Sample includes two periods for each industry which cover 1880-1895 and 1895-1910. Furniture had no exports in 1880. It is excluded from the sample since the growth rate of exports is not defined. Robust standard errors clustered over destinations are reported in brackets.
Sources: Belgium, Tableau (various years) and Appendix B.
where τ indicates a subset of years {1870, 1875, 1880}, {1890, 1895}, or {1900, 1905, 1910}, g indicates one of the 20 industries classified by Gadisseur, iindicates a particular item belonging to industry g, and drepresents a destination. The explanatory variables in the vector zinclude the logarithm of distance to Belgium, the log of population in the export destination, year dummies, and indicators if the trade partner was a colony of another country, shared a border, and a common language, and if the country had a diplomatic representative in Belgium. We allow for the impact of changes in trade costs to vary by industry, thereby generating industry level variation in predicted trade. We assume that the variables in z are exogenous in the sense that they drive trade patterns, but they do not have any influence on productivity except via their effect on trade. In order to generate excluded instruments (IV), we aggregate as follows:
We predict the exports for three years, t = 1880, 1895, 1910, using the coefficients estimated from the three subsets of years denoted by τ, one subset for each year of our sample. We then take the logarithm of total predicted exports. To gain statistical power, we use IV for the first year of each period as an excluded instrument, as well as the 16-year differences in IV. Our first stage regression results are presented in Table 6. A weak instrument problem remains a possibility, although individually the excluded instruments are highly statistically significant. Nevertheless, the second stage instrumental variables regression, where we use export growth to explain productivity growth, suggests no significant positive relationship between these two variables (ordinary least squares (OLS) estimates are reported in column 5). We also enter the changes in the log of predicted trade directly as a determinant of productivity in the last column. This regression measures the direct relationship between that portion of trade determined by trade costs, foreign market factors, and productivity growth. In effect, there is no statistically significant relationship, thereby redressing the negative association depicted in Figure 5. As trade costs fell, the benefits of greater market access accruing to established exporters would appear to have been offset by the entry of low-productivity firms that remained viable in sectors with a high degree of product differentiation.
Table 6 presents a closer look at the impact of exports on productivity by industry or category.Footnote 30 Column 2 allows for different slopes on the change in openness for each of our four categories of goods. Panel OLS regressions suggest much lower productivity growth in category 2 compared to category 4. The point estimates for category 1 and category 3 are also much lower than those of category 4, but we cannot reject equality at high levels of confidence. The result is that productivity was higher in sectors in which the distribution of firms was heterogeneous, indicating the presence of a cluster of high-performing export firms on the right-hand-side tail. In column 3 of Table 6 we include industry fixed effects revealing that the point estimate on openness to trade is nearly identical to that in column 1, but it is statistically insignificant. Unobservable heterogeneity in the level of productivity growth cannot explain the lack of a positive relationship between openness and productivity.
Case Studies: The Distribution of Firm Sizes
The fates of Belgium's metal and steel and textile industries illuminate the channels by which differentiated goods and firm heterogeneity impacted on productivity. The metal and steel sector produced a range of products, from crude and medium grade iron and steel to highly specialized machine-making equipment. At the same time, the dispersion of firm size indicates a high degree of heterogeneity, assuming, of course, that size is positively correlated with productivity and productivity growth. In fact, comparing the distribution of firms by level of capitalization in 1880 and 1910 reveals a hollowing out of middle-sized firms and magnified heterogeneity. In 1880, middle-sized firms having between 500,000 and 1 million Belgian francs (BEF) of capital possessed 32 percent of the industry's total; the figure in 1910 was cut in half. The same period saw increased concentration of capital in larger, technologically dynamic concerns and, to a lesser extent, in small establishments producing specialized items that complemented the sales of larger concerns.Footnote 31 Owing to the synergy between product differentiation and firm heterogeneity in this sector, the decline in trade costs translated into strong export performance andan increase in productivity. The share of steel output exported was about 30 percent, and, by 1910, producers served a customer base of more than 30 destinations, including 13 new markets since 1895 (Table 1; Brooks and La Croix Reference Brooks and La Croix1920; Burn Reference Burn1940, pp. 78-86). Productivity growth went hand in hand with the export expansion, achieving a rate of 2.61 percent per annum for between 1880 and 1896, and 3.38 percent for 1896–1910. Tramway and automobile producers, a related sector with a high degree of firm heterogeneity and a differentiated product line, recorded a similar strong productivity record of 3.50 percent.
Finally, we consider the effects of the presence of differentiated goods and the absence of firm heterogeneity in the cotton-textile industry. Informed by business intelligence provided by trade diplomats on market opportunities, manufacturers succeeded in widening the range of products exported and doubling the number of destinations served, from 25 to 50, between 1880 and 1910. The increase in trade through product differentiation reinforced the growth that can be attributed to the degree of firm similarity. According to one estimate, 20 new spinning firms began production after 1896 (Van Houtte Reference Van Houtte1949, p. 102).Footnote 32 These firms were often small, some of which were temporary sheds located in the countryside. In the manufacture of wool, linen, and cotton goods, the distribution of firm size by level of capitalization narrowed. In 1880, large firms over 1 million BEF in capital held 67 percent of the industry's total; in 1910, 34 percent. The corresponding figures for small and middle-sized firms, 100 to 1 million BEF, were 34 and 57 percent.Footnote 33 The flattening of the distribution in cotton textiles had implications for sectoral productivity which increased by a meager 0.13 percent per annum between 1896 and 1910.Footnote 34 Linen and wool spinning also recorded subpar performances with growth rates of 0.83 and 0.70 percent.Footnote 35
Conclusion: Trade Boom or Trade Bust?
Historians have lamented the slow pace of structural change of the Belgian economy during the great trade boom, with economic performance being dependent on a handful of old staples, such as textiles and glass making. Our new trade dataset presents a more vibrant portrait of Belle Époque Belgium, the gateway to Europe. Rather than incremental change, the number of products exported and new markets serviced expanded rapidly. In the spirit of modern trade theories, we find that trade costs explain much of the country's remarkable trade performance. Specifically, investments by the Belgian state in its trade diplomatic network enabled local exporters, even as they competed head on against larger and richer commercial rivals. At the industry level, the effect of trade costs on the value, direction, and type of trade, varied with the degrees of product differentiation and the similarity of firm productivity. More generally, our attention to trade costs incurred by small economies like Belgium, and to intra-industry trade, contrasts sharply with the inordinate focus of existing paradigms of globalization before 1914 on the trade of major countries and an over-reliance on aggregate statistics.
Still, historians' depiction of a torpid Belgian economy retains some currency. A reasonable conjecture is that the country's dramatic increase in international trade ought to have manifested itself in output growth. But strong productivity records in certain sectors, like tramways, were offset by modest results elsewhere, such as textiles. Drawing on the insights of new trade theory, we posit that the expansion in new trade partners and new goods did not guarantee faster growth in per capita income in sectors with high degrees of product differentiation and uniformity in firm productivity. In these areas, as the fixed costs of establishing new goods in new markets came down, new entrants with lower productivity than incumbents expanded market share. This process underlies the seemingly paradoxical acceleration in openness beginning in the 1890s and the country's lackluster productivity performance.
Can we generalize from these results? Evidently, more research using disaggregated trade at the firm level is needed to substantiate our claims. That said, our findings point to a need to specify the pathways by which trade expansion causes productivity growth. In the presence of entry costs, a type of race can ensue between the positive selection effects of allocating resources and the negative effects of declining trade costs, or, more broadly, technology vs. geography. The bottom line is that globalization may not always show up in the growth numbers. Our cautionary tale echoes Dani Rodrik's (2011) observation that, sooner or later, the process of international integration comes up against diminishing marginal returns.
Appendix A Background Information on Belgian Foreign Trade
General The Tableau général du commerce extérieurdistinguished between all goods shipped (commerce général), which included re-exports and goods in transit, and items produced exclusively in Belgium (commerce spécial). For the latter, we recorded trade in manufactured goods, which represented about 50 percent of all exports in 1900 and 20 percent of all imports, at five-year intervals beginning in 1870 and until 1910.Footnote 36 The degree of overlap in the types of trade, while certainly not trivial, narrowed over the period. The incentive to conceal goods from the authorities, either as re-exports or special goods, diminished during the period under investigation as custom duties receded. But the same fall in duties would have encouraged “disguised transit,” the incentive to declare goods intended for re-export as imports for domestic consumption, and, subsequently, to claim the same goods as exports of domestic origin (in order to avoid red tape and the delays associated with leaving goods in transit).Footnote 37 Edwin Horlings (Reference Horlings1997, p. 120) reports that most disguised transit consisted of low-taxed, low-value bulk and crude commodities, rather than the processed and manufactured goods that are our interest. Altogether, Federico and Tena (Reference Federico and Tena1991), measuring the accuracy of trade statistics using exports and imports from source and destination countries, score Belgium only slightly below the figure of the average European country.
Classification: Items, Categories, and Countries
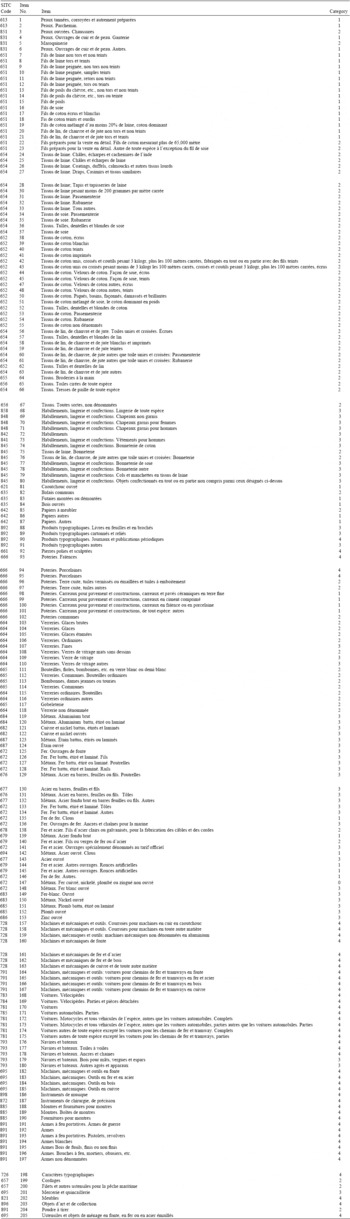
Our classification of products follows that recorded in the Tableau. The level of detail of the products listed in Appendix Table 1 corresponds to the SITC four or five-digit level. A recurrent problem with this type of exercise is the ability to distinguish genuinely new products from new titles given to existing products, and other products listed in a new separate entry but were in fact previously folded into another group. For clearly identified new products, like streetcars made with aluminum, this concern was immaterial, but in broader classifications, like cotton yarn, this problem was unavoidable. To minimize double counting, beginning with the 1870 product listing, we labeled as existing items those “new products” with similar titles, and other supposedly new goods whose export or import values were of the same order of magnitude as previously recorded products. For example, when the 1880 return subdivided tissus de coton unis into tissus de coton unis, croisés et coutils pesant 3 kilogr et plus les 100 mètres carrés, écrus, and tissus de coton unis…blanchis, we counted these as one new product. This procedure reduced the number of products by roughly 10 percent. For 1910, we recorded 171 distinct products exported. Over all years in our sample, the Tableaureported 202 export and 205 import products.
Comprehensive List of Goods Exported and Degree of Differentiation
Value of Exports by Category
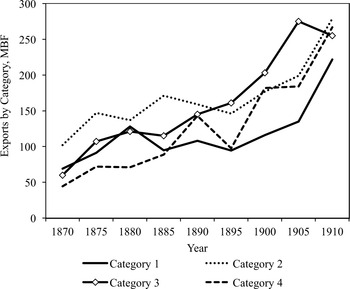
Appendix Table 1 classifies goods into four categories of product differentiation, with category 1 the least differentiated; in Appendix Figure 1 we present the value of exports in each category. There was strong growth in categories 3 and 4. This expansion coincides with the attention given by the trade consuls in the RC to highly differentiated goods.
With regard to export destinations and import sources, we had several considerations. We sought to retain the original destinations from the Tableau for which we had population figures. Exceptionally, we folded northern German ports into Germany, and Newfoundland into Canada. In other cases, we defined countries according to their 1910 borders. For instance, New South Wales was recorded as Australia. For colonies, we used the designations found in the Tableau. The complete list is:
Abyssinia, Aden, Algeria, Argentina, Australia, Austria, Bolivia, Brazil, Bulgaria, Canada, Chile, China, Colombia, Congo, Costa Rica, Cuba, Denmark, Dominica, East Africa France, East Africa Great Britain, East Africa Portugal, Ecuador, Egypt, France, Germany, Gibraltar, Great Britain, Greece, Guadeloupe, Guatemala, Haiti, Hong Kong, India, Indonesia, Italy, Japan, Luxembourg, Madagascar, Malaysia, Malta, Martinique, Mauritius, Mexico, Morocco, Netherlands, New Caledonia, New Zealand, Nicaragua, Papal States, Paraguay, Persia, Peru, Philippines, Portugal, Romania, Russia, San Salvador, Saudi Arabia, Serbia, Siam, South Africa, Spain, Sweden and Norway, Switzerland, Tripoli, Tunisia, Turkey, U.S., Uruguay, Venezuela, Vietnam, West Africa France, West Africa Great Britain, West Africa Portugal.
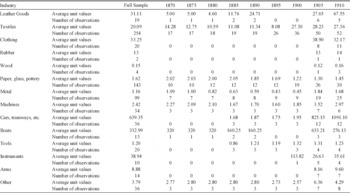
Altogether, our sample consists of 74 potential destinations, an additional observation being “other countries.” For all countries, we have nine observations except for: Papal States (1), Saudi Arabia (4), Tripoli (5), Congo (5), West Africa France (7), West Africa Great Britain (7), East Africa Portugal (8), West Africa Portugal (8). Appendix Table 2 presents the summary statistics of our dataset for imports and exports. The number of import sources was smaller than export destinations since imports of manufactured products were mainly from European countries. Until the mid-1890s, unit values of manufactured imports actually exceeded that of exports; thereafter the trend was reversed.
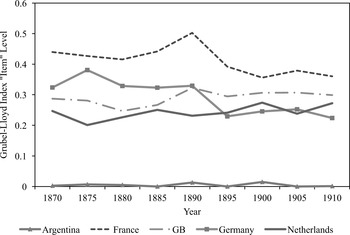
Import competition was stable in the period. In Appendix Figure 2 we plot the Grubel-Lloyd index for manufacturing items of major trading partners. Whereas intra-industry trade with the United Kingdom and Netherlands increased moderately, it declined slightly with France and Germany.
As for robust inference, we face the usual problems. Note we have many observations at the product level. In fact, we can expand the estimating sample to 71,458 observations. We have experimented by adding product dummies to the specification, but because our trade cost variables are not observed at the product or category level, our results are identical whether we aggregate by categories (Tables 3) or across goods.
Unit Values
The spike in average unit values in Appendix Table 2 merits discussion. The Tableau, like other nineteenth-century international trade sources, recorded official prices. This shortcoming is minimized because prices were adjusted annually, although their reliability varied across commodities. For some of the early years, many goods were declared in value only. The sources of the official prices and the nature of their revisions are unclear. Horlings (1997, p. 114) presumes they were wholesale prices rather than c.i.f. or f.o.b. prices. Despite these drawbacks, his own recalculation of trade values concentrated on the period before mid century. Until 1845, Horlings (1997, p. 117) reduced export prices by the order of 6 percent, but “during the remainder of the century the revision of price data caused a change of between 1 and 3 percent of import and export values.” Note that recorded prices do not vary with destination or source, again a common feature of historical trade statistics especially those collected on the European continent.
Appendix Table 3 gives unit values at the industry level. It presents a more nuanced picture of the increase in values after 1890. The price rise would appear to conflate the entry of capital-intensive firms producing high-quality-high-value added items, as in Kei-Mu Yi (Reference Yi2003), and the entry of poor performers with high marginal costs. For textiles, export prices in 1905 were only slightly higher than they were 20 years earlier, and this was the case for paper and glass products, and pottery as well. But machine and metal prices more than doubled. At the same time, there was also a spike in average unit values because of big-ticket items, including boats, cars, streetcars, and railroad wagons that Belgium began exporting toward the end of the century.
Exports and Imports: Destinations, Sources, Numbers of Products, and Unit Values
Intra-industry Trade by Product Item
Robustness Checks
We redid the gravity regressions of Tables 2, 3, and 4 including leads and lags of these potentially endogenous variables: pegged exchange rate, MFN treaty, diplomatic representation abroad by Belgium, and foreign diplomatic representation in Belgium. We included one lead, the contemporaneous value, and one lag of each variable. Since our trade data are available every five years, the leads and lags cover the same time horizon. Inclusion of lags diminished our sample to 487 country-year observations.
Suppose that institutional and policy variables responded to existing strong trade relationships with major commercial partners. The coefficients on the contemporaneous values of these variables would then be potentially upward biased. To check for this, we included lead values of the policy changes. The policy variables are themselves time variant. If there were no bias toward major trade partners, then the leads should not be statistically significant.Footnote 38
We conducted 15 additional regressions that include 120 new coefficients (leads and lags of the four policy variables). For gravity regressions at the country level (corresponding to Table 2), the leads on pegged exchange rate and partner representation in Belgium are highly significant, while the lags and contemporaneous values are not. For MFN treaties and Belgian representation abroad, the leads are not statistically significant. In regressions at the level of differentiation corresponding to Tables 2, 3, and 4, the lead variables are, in general, not important, with at most 2 out of the 4 leads for each of the variables being significant. An exception is the regression for the extensive margin (Table 4). In this case, the lead on partner representation in Belgium is significant for product categories 1, 2, and 3. But the contemporaneous and lag values maintain their significance, suggesting that even after controlling for the anticipation of adoption, policy change may have had a positive impact. As a further check, in regressions with lags only, the coefficients of the institutional variables generally have the same sign and level of significance as variables reported in Tables 2, 3, and 4. Overall, the mixed results on the lead variables, combined with the fact that the lags and contemporaneous values are also significant, give comfort to our claim about the independence of policy change.
Unit Values by Industry
Appendix B Data Sources
Common border: López-Córdova and Meissner (Reference López-Córdova and Meissner2003) and standard maps using historical border definitions.
Common language: Standard official languages.
Distance: Great circle distances between capitals or major cities. See López-Córdova and Meissner (Reference López-Córdova and Meissner2003) and Kristian Gleditsch and Michael D. Ward (Reference Gleditsch and Ward2001).
Diplomatic representation: Representatives in Belgium from Almanach de Gotha (various years); Belgian diplomats abroad Recueil consulaire (various years).
MFN clauses: Dates and sources reported in the working paper of López-Córdova and Meissner (Reference López-Córdova and Meissner2003) and Pahre (Reference Pahre2007), and accompanying trade dataset (personal communication with author).
Monetary regime and Gold Standard: Dates and sources reported in the working paper of López-Córdova and Meissner (Reference López-Córdova and Meissner2003) and Lawrence H. Officer (Reference Officer2014).
Population: Angus Maddison (Reference Maddison2015). Supplementary information from the Statesman's Yearbook(various years).


