


Introduction
The comprehensive work of compiling the World Atlas of Snow and Ice Resources, which tasted eight years, has been completed in the Soviet Union. This work was stimulated by a search for better ways of collecting and storing information and presenting it to the users and the development of new, indirect methods of overcoming shortages of data.
The Atlas arranges into a system a vast amount of information on snow and ice, assembled mainly since the beginning of the 1950’s. The basic objective of the Atlas is the global evaluation of natural ice, as a potential source of fresh water. This involves regional estimation of resources, regime, and variability of glacio-nival processes and phenomena.
The achievement of the Atlas is to show all the regions with snow and ice and alt the aspects of nature related to snow and ice in these regions, as well as the variability of the regions in the past, their present regime, and predictions for the future. Snow and ice resources are of special concern and, in the Atlas, this also includes melt waters derived from them, climatic peculiarities related to them and the prospects of using them for sports and recreation.
In compiling the maps, we used many different sources: inventories, reference books, annuals, the data of regime observations under the IGY, IHD and IHP programmes, the data on glacier fluctuations assembled by the International Permanent Service of Glacier Fluctuations, and comprehensive hydro-meteorological information. Satellite information, including surveys by the astronauts on board the orbital station, “Salyut 6”, made in 1978 – 1980 for the World Atlas of Snow and Ice Resources, was used for areas previously little studied, such as South America, Central Asia, some Alpine regions and Siberia.
The majority of territories covered by the Atlas are located at high altitudes and in polar latitudes, where there have been few research stations and little field work. With this in mind, when compiling the maps, we carried out broad research and created a number of computation methods to obtain regime parameters, characterising the nature of insufficiently-studied, mountain-glacier regions (Reference KotlyakovKotlyakov 1977). The concept of glacio-nival systems and the fields of such systems, recently developed in the U.S.S.R. provided the basis for this compilation. (Reference Kotlyakov and KrenkeKotlyakov, Krenke 1979; Reference KrenkeKrenke 1982).
Glacio-Nival Systems
A glacio-nival system is a natural system in which snow and ice dominate both its composition and its process of development, as well as its interaction with the environment. Separate components of a glacio-nival system, e.g. glaciers or snow cover, may themselves form independent systems, which can be mapped.
Glacio-nival systems and glacier systems, in particular, are characterized by the fields of their basic parameters, i.e. the distribution of this or that property over the territory. These fields remain continuous, despite the discrete points from which they are computed or plotted graphically, The representation of such a field is an abstraction, plotted according to rigid rules. It is concerned with the regularities of glacier systems, caused by the impact of continuously-distributed (e.g. climatic) factors and excludes the effects of random, discretely-distributed (e.g. orographic) factors.
The mapping of glacier systems involves the plotting of fields of individual parameters. Two main methods of representation were used: isopleths and zones of colour or of special symbols. The maps of glacierization extent, the altitude of glaciers’ termini, vertical range of glacierization, the equilibrium-line altitude on glaciers, the mean summer temperature of the air at this altitude and at a single, fixed level, close to the altitudinal position of glaciers, the accumulation and ablation values at the equilibrium line, annual precipitation, annual run-off and its melt water component, have been compiled using isopleths. Maps of the prevailing morphological type of glaciers, the extent of debris cover, glacier thickness and ice storage were prepared using zones of colour or of special symbols.
In the U.S.S.R., there exists considerable experience in compiling complex, glaciological atlases. Examples are the Atlas of Elbrus Glaciers, the Atlas of Antarctica, and the present World Atlas of Snow and Ice Resources. The complex nature of this Atlas is due to the provision of many maps on the same scale, each showing different properties, for each region. Most mountain regions of the World are covered in this way, with some differences only in covering those regions where data is scarce. In addition, each particular subject is covered by a series of maps of differing scales.
One of the characteristics of glacio-nival phenomena is the great range of their dimensions. The concentrated effects of small, separate, mountain glaciers presented a problem of how best to show their features on maps, of different scales, which also covered the fields of large glacier systems.
Maps of Three Groups of Scale
Maps of accumulation, ablation and mass balance of individual glaciers (Fig.1.), presented in the Atlas, are based on the results of actual measurements on the glacier, extrapolated to cover the whole area of the glacier after taking into account the altitude and other factors affecting accumulation and ablation. Traditional, large scale maps of the fluctuation of glaciers, showing their position on different dates, are also compiled from records of actual observations.
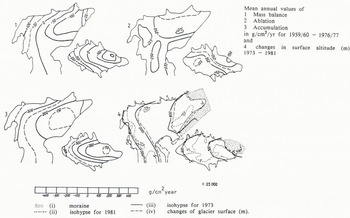
Fig. 1. Obruchev and IGAN glaciers. Accumulation, ablation, mass balance, changes in surface altitude, and area. Sketch.
Glacierized regions were mapped at a scale of 1:600 000, which allows us to show small mountain glaciers, but without much internal detail (Fig.2). These maps show the morphological types of glaciers, the values of accumulation and ablation at the equilibrium line and the nature of glacier retreat or advance.
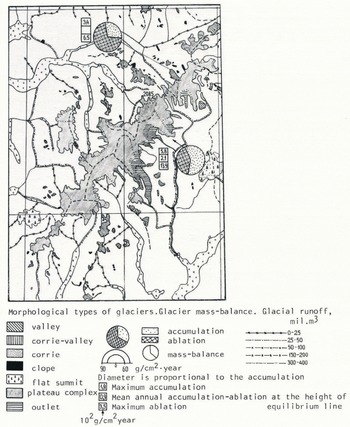
Fig. 2. Scandinavia. Jostedalsbreen. Fragment of the map “Glacier morphology and regime”. Scale 1:600 000.
On small-scale maps (1:1 500 000 and smaller), we pass from the specific properties of individual glaciers to the depiction of a glacier system as a whole, by way of plotting the fields of its properties (Fig.3). The compilation of such maps calls for information on the position, movement and continuity of the relevant natural processes. If comprehensive field data were available, one could plot an analysis of the fields of regime properties, but this is not feasible in any of the mountain regions. It is necessary, therefore, to resort to computations. For example, one can make computations of accumulation at the equilibrium-line altitude on glaciers, based on temperature totals at this altitude, and then proceed to compile synthesized maps. The compilation of such maps involves the assembly of whatever actual data are available, the selection of the most representative of those data, the computation of the property to be mapped, the selection of the scale interval, the interpolation of estimated data and, finally, the drawing of isopleths.
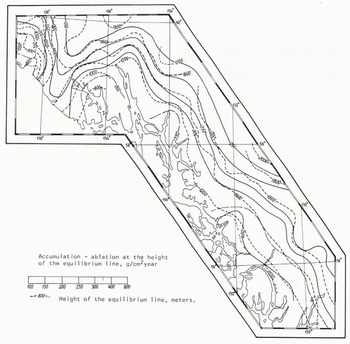
Fig. 3. North America. Northern part of the Coast Ranges. “Glacier regime”. Scale 1:1 500 000.
On the small-scale maps in the Atlas, numerical as well as qualitative values are plotted. Numerical values form the main contents of all the maps compiled with the help of isopleths. They include temperature, precipitation, snow cover and run-off. Maps showing qualitative values cover ice-formation zones, agents of avalanche formation, the extent of former glaciation, permafrost, and mud-flow activity. On some maps, numerical values are added to enhance the qualitative information. Examples of this are: the extent of avalanche activity, related to the density of the network of avalanches and the frequency of their recurrence; the nature of glacier fluctuations, related to the value of fluctuations of the terminus; the prevailing or accompanying type of glaciers, shown as a percentage of glaciers of different types.
In changing from large- to small-scale maps, we have, as a rule, to pass from relatively simple, analytical characteristics to more complex indices and to change the method of depiction accordingly from isopleths to qualitative backgrounds or symbols. Maps of glacier morphology, presented in the Atlas on three different scales, are good examples. Characteristics of surface morphology, plotted by means of isopleths on large-scale maps, are replaced on mid-scale maps by the properties of morphological types of individual glaciers, shown by means of zones. Last, but not least, small-scale maps show abstract, generalized characteristics, such as the dominant and accompanying types of glaciers in particular regions.
Generalization of Glacier Contours
Important features of the maps in the Atlas are glacier contours, which are subjected to significant generalization, depending on the scale. It is possible to plot the real contours of mountain glaciers effectively at a scale of not less than 1:600 000. In generalizing, we tried to preserve the differences in configuration between a wider accumulation area and a narrow glacier tongue; to show rocky crests between narrow glaciers while ignoring individual outcrops of rock on the glaciers; if possible, not to unite separate, but closely adjoining, glaciers by common contour lines; to depict glaciers on slopes of different exposures by exaggerating the width of rocky range, interrupting it only where there was a transverse glacier or a flat summit (Fig.4).
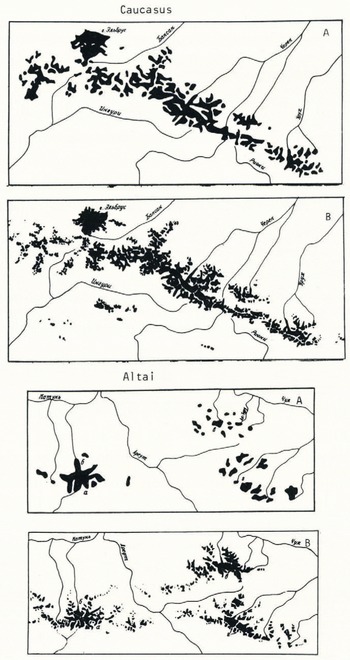
Fig. 4a. Contours of Glaciers of the Central Caucasus and Central Altai glacierization. Fragments of the contours of the general geographic map (A) and of the map compiled for the World Atlas of Snow and Ice Resources (B). Reduced to the same scale.
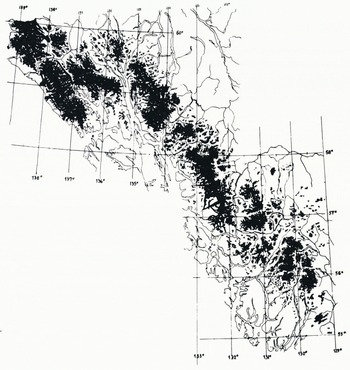
Fig. 4b. Contours of Glaciers in the Northern part of the Coast Ranges, North America.
Even on small-scale maps, it became possible to preserve, by generalization, the typical configuration of different morphological types of glaciers. For example, a complex dentritic lattice is outlined in dendritic glaciers; only selected, isolated accumulation areas are shown in compound, valley glaciers. For simple valley glaciers, we show only a rounded-off accumulation area and a glacier tongue of approximately the same length. In the case of slope glaciers, which may be located across the slope, we map the contour of indefinite configuration.
Numerous small-scale plottings of glacier contours, based on reliable large-scale sources, allowed us to present, for the first time, a picture of glacierization in different mountain systems. This revealed certain regularities in the development of glacierization contours in relation to two factors: 1. altitude and roughness of terrain, and 2. climatic conditions. The nature of contours permits a distinction between polar plateaux (monolithic ice sheets), alpine topography of polar countries (reticular or transection glacierization), mountains of maritime western parts of the continents (large glacier complexes with ice-covered territories dominant over ice-free areas), continental highlands up to 7 – 8 km a.s.l. (dendritic glacierization with approximately equal ratio between the areas of glaciers and abutting slopes), temperate, humid, continental uplands, from 3 to 5 km a.s.l. (concentration of glaciers in the highest areas and their separation over the periphery), low, peripheral ranges of up to 3 km a.s.l. (small glaciers along the crests), and vast, continental uplands (dispersed, scattered nature of glacierization).
On small-scale maps of the fields of glacier systems, the so-called “glacier zone” is defined, of which the limit intersects mountain valleys at the altitude of the lowest glacier termini and goes round all small glaciers on the range. Sometimes, when depicting the fields of regime properties, more abstract in their nature, the glacier zone was slightly widened.
Interrelation between Maps of Different Subjects
In all, the Atlas contains over 1000 maps of different scales. Many of the properties of glacio-nival phenomena, shown on the maps, are genetically interrelated and these interrelations were used in compiling the maps. In the course of compilation, the maps of 17 subject sections were interrelated, with three types of connection: 1) by common computations and parameters; 2) using some common parameters, or 3) by agreement and coordination at the final phase of compilation (Fig.5).
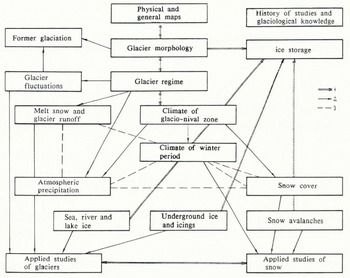
Fig. 5. Diagram of connections between subject sections of the World Atlas of Snow and Ice Resources.
The most closely related are the maps of the sections dealing with atmospheric precipitation, climate of glacio-nival zones, snow cover, snow avalanches, morphology and regime of glaciers, melt water and glacier run-off and ice storage. Thus, the maps of the annual amount of solid precipitation are used for compiling the maps of maximum snow storage over the territories, where data from snow cover measurements may be insufficient. The greater part of the precipitation, snow cover and melt run-off maps could not have been compiled without reference to the maps of glacier systems’ regimes and the information they contained, in particular, on accumulation values at the equilibrium-line altitude. The regime maps, in their turn, relied on data on air temperature, plotted on the maps dealing with glacio-climatic conditions.
Interrelationships like these enabled us to take advantage of the information contained in all the maps and reach common agreement between them, which improved their reliability. The basic principles and methods of this agreement were first formulated and eventually determined during compilation and editing of the maps on the basis of comparisons between already completed maps (Reference Kotlyakov and DreyerKotlyakov and Dreyer 1984).
During compilation, initial data were analysed on the basis of already known relationships between the properties to be mapped. Inadequate, non-representative data were rejected at this stage, while relationships involving spatial (horizontal and vertical) distribution of the mapped values were tested and the boundaries of the regions within which these relationships were valid were specified. At the stage of coordination with existing maps, the location, values, and areas of extreme values were visually compared, along with the general nature of distribution of the mapped properties.
The progress of coordination was determined by the interrelationships of properties and the extent of the independence of the initial data. Such pairings of properties as solid and liquid precipitation, solid precipitation and maximum snow storage, and duration of warm and cold periods, coordinated during compilation, were carried out independently of correlation with other properties. Correiation of the values of accumulation and ablation at the equilibrium-line attitude and temperature, solid precipitation, snow storage and melt run-off at this altitude was carried out after the compilation of the corresponding maps by means of their joint analysis and testing.
The agreement between contour lines and the isopleths of special properties was achieved by special methods, during compilation. The most important of these concerned the order of compilation, from large-scale maps to small-scale maps (e.g. the maps of continents were compiled after the maps of mountain regions). When preparing the maps of special subjects of the same scale, we mapped related phenomena only after analysing the maps of indices or agents. For example, maps of the extent of avalanche activity were compiled after comparing their information with that shown on existing maps of the density of the network of avalanche sites and the frequency of avalanche recurrence, and then making a joint analysis of both. In this case, agreement between maps is inherent in the methods themselves and does not require any additional work. Elements common to a whole series of maps (e.g. the boundaries of avalanche-safe regions, as shown on the series of maps of avalanche activity) are transferred to all the maps of this section and not compiled anew for each.
The concept of the field, widely used in the Atlas, led to studies of the extent of abstraction in the field maps and their reliability allowed us to carry out comprehensive cartographic analyses of glacier systems. These include studies of the interreactions between, and variety of, glaciological properties, evaluation of the contribution of different agents to the plotting of computation fields, computations of the accuracy of depicted properties and glaciological zoning.
Snow and Ice Resources
In view of the objectives of the Atlas in evaluating resources, we undertook for the first time a successive glaciological zoning of the World, including small-scale zoning of the globe and mid-scale zoning of selected areas. This zoning is of general geographical significance and is based on a combination of orographical, hydrological and glaciological approaches. It allows us to understand better the glacio-nival peculiarities of nature and to organize computations of snow and ice resources over particular natural regions.
The maps of natural ice storage give a general idea of the total area and volume of glaciers, the volumes and specific values of their daily melting (run-off) and seasonal snow cover on the date of its maximum, in each of the regions mapped. In preparing these maps, we evaluated, for the first time, the mean thicknesses of glacier basins and computed the residence time of ice in glaciers – an important index of glacier resources.
By now, the compilation of the authors’ original maps for the World Atlas of Snow and Ice Resources has been completed and the Atlas has been passed for publication. We hope that the results of this huge work will be of great significance for all Earth Sciences.


