


Introduction
The current pandemic brings to our attention that jobs can be risky in many different ways, and workers may need compensation for risks incurred at work. The concept of value of life (or injury) is essential to policy or business decisions to effectively reduce workplace fatality and injury risks. Before enacting any measures to compensate for or prevent injury, one must first calculate the associated value of statistical life (VSL), or a related concept – the value of statistical injury (VOI).Footnote 1 The best calculation of the VSL or VOI relies on an unbiased estimate of the compensating wage differential (CWD), which is based on true measures of risk from reported risk data. At the individual level, both employer and employee agree to a single, but multidimensional, wage rate for any job. This contracted wage reflects and includes the CWD, which incorporates both supply and demand factors (Smith, Reference Smith1979). The VOI is ascertained from nonfatal injury risk, which is heterogenous, ranging from trauma, mild injuries, or health adversities to more serious types of injuries or morbidity, making it difficult to place a single value on an injury and estimate the associated compensation. There are also reporting effects, which are not true differences in safety, but may cause standardised nonfatal injury information to vary widely among occupations and workers, particularly by gender.Footnote 2 Workplace risk itself can depend on many factors, which we examine below.
Few studies analyse the CWD by gender or race. Data limitations appear to be the primary reason for this paucity. Hersch (Reference Hersch1998) used the first set of data on gender-specific injury incidence rates from the Bureau of Census, adding a new dimension to the literature on the estimation of a wage risk trade-off. This was followed by Leeth and Ruser (Reference Leeth and Ruser2003), who examined gender- and race-specific occupation data from 1996 to 1998.
We undertook this research to examine the CWD for nonfatal injury risk by gender and race using individual-level data on occupation gender-specific, and race-specific injury and illness rates in the United States from 2012 to 2015, years during which such data were made publicly available by the Bureau of Labor Statistics (BLS).Footnote 3 Using this data, our study asks the question that, if the CWD for nonfatal risk can be measured, does it vary significantly by gender and race? What might account for those differences, if they exist? Viscusi (Reference Viscusi2004) underscores that Hersch’s seminal analysis has shown us the importance of estimating separate wage equations for men and women. Following this, we revisit the methods used by Hersch or Leeth and Ruser in this study. In addition, we contribute to the literature by including union membership and its effect on the CWD within this context of race and gender. The positive effect of unionisation on the CWD has been noted first by Thaler and Rosen (Reference Thaler, Rosen and Terleckyj1976) who interpret this as a collection of rents by unions because they restrict market entry for all workers. They also note there may be spillover effects which raise wages for nonunion workers. Duncan and Stafford (Reference Duncan and Stafford1980) say the presence of unions in blue-collar occupations with a structured work setting, inflexibility of hours, employer-set overtime, and a faster work face may be explanations for a higher CWD. Leeth and Ruser (Reference Leeth and Ruser2003) find that women blue-collar workers in unions earn large wage premia, which may overstate the true risk faced by women in these jobs, particularly for fatal risk.
Because our data are more recent than the studies cited above, we note that women and racial minorities make up a growing proportion of labour union members. We take subsamples of union workers from our full dataset to see if workers’ bargaining power may play a role in wage premia received for nonfatal risk. Also, we estimate an accurate VOI by gender and race based on both an ordinary least squares (OLS) and an endogeneity-corrected model.
In the United States, there are only indirect means with which to capture the extent of work-related illnesses, the largest category of nonfatal risk. In addition, the Survey of Occupational Injuries and Illnesses data are submitted only by employers, a practice that likely limits the completeness of reporting (Rappin et al., Reference Rappin, Wuellner and Bonauto2016). BLS focuses on lost-workday injuries, because they are more likely to result in long-term disabilities, making such data valuable for the calculation for VOI. It may be noted that injury risk has fallen considerably over the past several decades, as technology has allowed both safety improvements and a shift away from dangerous jobs. Despite this, adverse working conditions can have consequences for health that appear later in life and are not always recognised as work-related. This effect can only exacerbate any disparities we are able to estimate in this study.
A review of the relevant literature
CWD by race and gender
The standard model of CWD is to be understood thus: firms supply safety to workers at a price which is implicitly taken out of their wages. The lower the safety, the higher the risk. Workers, on the other hand, demand safety at work and expect they should be compensated for accepting jobs with higher risks. This results in a positive wage–risk relationship. However, the empirical literature suggests that worker compensation may be negative or positive in the presence of injury risk. Black and Kniesner (Reference Black and Kniesner2003: 17) have found that for nonfatal risks, ‘numerous estimates of the risk coefficients (as well as the VSL) are negative, contrary to theory’. To this existing complexity, we add questions of gender and race. Any worker’s job choice with respect to risk will be primarily determined by his or her risk aversion and the pay received. To this, we may add accident propensities of different demographic groups; when this is high enough and the risk aversion of workers low enough, we can expect to see estimates of CWD to be negative (Leeth & Ruser, Reference Leeth and Ruser2003). We also recognise that wage rates vary across the demographics that we are considering and may also be influenced through union membership, or the presence of unions. Hence, the estimation of these various prices of risk to workers by different groups may be useful for practical applications such as separate estimates of the VOI.
Many researchers have derived results consistently indicating that the gender wage gap can be explained by differences in occupations held by men and women (Blau & Kahn, Reference Blau and Kahn2017; Groshen, Reference Groshen1991). Occupations are also tied to different degrees of risk, with men being overrepresented in higher risk industries such as construction, mining, military, farming, fishing, and protective service. Men and women experience different types of occupational injuries and reasons for illness absences (Stergiou-Kita et al., Reference Stergiou-Kita, Mansfield, Bezo, Colantonio, Garritano, Lafrance, Lewko, Mantis, Moody, Power and Theberge2015). Men may be exposed to greater workplace hazards and traumatic injuries, and women may be exposed to more chronic musculoskeletal conditions, anxiety, and depression.
Yeoh et al. (Reference Yeoh, Lockhart and Wu2013) tell us that females have a greater incidence rate of injuries that entail falling on the same level when compared to their male counterparts. Such injuries also account for the majority of fall injuries, which are substantial in generating days away from work. This is especially true for female occupations in food preparation and serving, office and administration support, and healthcare.
Hersch (Reference Hersch1998) finds a negative CWD for white-collar male workers, but a positive estimate for all blue-collar workers. Using both industry and occupation data, she shows that women in both blue- and white-collar occupations earn positive CWDs for nonfatal injury risk. She notes that women are largely concentrated in safer white-collar occupations, representing 69 per cent of all workers in such jobs. Also, a puzzling negative wage–risk relationship is found from the full sample of male workers, which she explains may have resulted from pooling workers paid hourly with those on salary. Salaried workers may be compensated for risk through other means such as bonuses or promotions. Restricting the sample to hourly workers leads to a positive and significant effect of gender-specific occupational risk on wages, while lowering the magnitude of the coefficient.
Viscusi (Reference Viscusi2004) also finds that full sample results do not yield positive and statistically significant wage premia for fatality risks. Viscusi (Reference Viscusi2003) estimates a positive and significant CWD for Black employees, suggesting that the market has performed to their benefit, given that they face comparatively high nonfatal risk at work. However, their annual job risk compensation is lower than that for White workers, indicating differences in labour market opportunities, as well as the structure of offers for risky jobs, across White and Black workers. Workers of color, particularly Black workers, are historically overrepresented in high-risk occupations, and evidence shows that they have elevated occupational disease risk (Dorman & Boden, Reference Dorman and Boden2021).
Various types of measurement error, econometric problems, and the changing nature of labour markets keep us from being able to observe any true association between wages and work-related danger (Hintermann et al., Reference Hintermann, Alberini and Markandya2010). Most studies in the CWD literature find a negative or insignificant wage–risk ratio coefficient for females (Bender & Mridha, Reference Bender and Mridha2011; DeLeire & Levy, Reference DeLeire and Levy2001; Viscusi, Reference Viscusi2004). While this appears to go against the standard theory of compensating differentials, reasons given include a belief that women are more likely to choose less risky occupations (DeLeire & Levy, Reference DeLeire and Levy2001). This is contradicted by the fact that women workers are increasingly moving into male-dominated occupations because these tend to have higher pay, better benefits, and sometimes more flexible hours (Torre, Reference Torre2017). The evidence shows us that occupational differences alone cannot explain race and gender CWD gaps. Within occupations, the reasons and compensation for workplace risk may differ significantly by gender and race.
The literature reviewed above illustrates the paucity of research examining CWDs by race and gender. We found no studies linking unions and what their potential effect on CWDs might be, while also incorporating demographic differences. This paper contributes to the literature on CWDs by examining both at the same time.
Other effects on the CWD
Leeth and Ruser’s (Reference Leeth and Ruser2003) work uses occupation, gender, and race-specific data from 1996 to 1998. They find little consistency and determinate patterns for nonfatal injury by race across occupations, but sizeable differences within occupations. In their sample, Black and Hispanic females faced a higher risk of nonfatal injury compared to White females. Across all three races, men had higher injury rates than did women. Before dividing the sample by occupational category, they find a positive risk premium only for men’s wages and attribute this to variations in hazard pay between white-collar and blue-collar jobs, possible differences in risk preference by gender, and the choice of occupation by workers. Once the sample is divided by occupational category, they find a positive risk premium for both men and women for only blue-collar occupations, and within that, white women are found to earn the highest wage compensation for nonfatal injury risk.Footnote 4
Guardaro and Zeiberth (Reference Guardado and Ziebarth2019) use occupational injury data on workers of 14–22 years of age, finding a standard positive wage–risk relationship. However, when they take into account ‘obesity’, which proxies for lower safety-related productivity, they find a significant negative relationship between obesity and wages. While this is present only in high-risk occupations, it implies that when workers themselves introduce safety risk in the workplace through obesity, they command a lower wage.
Hintermann et al. (Reference Hintermann, Alberini and Markandya2010) UK study finds no evidence of CWDs in a framework that corrects for both the heterogeneity and endogeneity of risk. They conclude that while workers may demand compensation for risks that they take on, both the changing nature of labour markets and econometric limitations do not allow us to observe the valuation of such risk.
Kluve and Schaffner (Reference Kluve and Schaffner2007) merge German and US panel data on occupational injury risks to analyse gender wage differentials primarily for fatal occupational injury risk. They find that CWDs are reflected in the resulting gender wage gap and caused by greater occupational injury risks among men and women; in addition, nonfatal injuries are compensated by insurance payments in the German context.
In addition, during downturns, the bargaining power of various demographic groups may be reduced, particularly in local labour markets and weaken their ability to seek and win risk-related wage premia. Bender and Mridha (Reference Bender and Mridha2011) and Mridha and Khan (Reference Mridha and Khan2013) examine the bargaining power of male and female workers during a period of unemployment. The presence of local area unemployment is included in this study, as is the effect of unionisation, and whether workers belong to them or not.Footnote 5
The value of injury by race and gender
The term ‘value of statistical life’ was introduced by Thomas Schelling (Reference Schelling and Chase1968) and is usually defined as an individual rate of trade-off between small changes in own mortality risk and own spending on other goods and services, within a defined time period. Useful introductions to the VSL literature are available in Blomquist (Reference Blomquist and Wright2015), Viscusi (Reference Viscusi2003), and Viscusi and Aldy (Reference Viscusi and Aldy2003). Viscusi and Aldy (Reference Viscusi and Aldy2003) state that, since nonfatal injuries are far more common than fatalities, and have a wide variation in severity and probability, estimates of the loss of quality of life, which includes both pain and suffering and reduced income, needs to include potential victims’ willingness to pay (WTP) for personal safety. They review more than 60 studies of mortality risk premia from 10 countries and about 40 studies that present estimates of injury risk premia. Many of these studies had focused on male samples, because estimates using industry-based measures often failed to yield significant risk premia for women. Therefore, researchers hypothesised that women did not work in risky jobs that would pose health and safety risks, but the estimates by Hersch (Reference Hersch1998) indicate that the nonfatal injury risk for women is over two-thirds the size of that for men, and that the wage–injury risk trade-off rates are similar for men and women. The evidence from countries other than the United States, while based on a smaller set of studies, also indicates significant injury risk premiums.
The conceptual framework for valuing nonfatal health risk reductions is the same as for valuing mortality risk reductions (Robinson et al., Reference Robinson, Hammitt and O’Keeffe2019; Viscusi, Reference Viscusi1993). Viscusi (Reference Viscusi1993) states that the studies by Viscusi in the 1970s were the first to obtain statistically significant values of compensation for injuries from wage equations. Leeth and Ruser (Reference Leeth and Ruser2003) note that estimates of the value of life can be generated from wage regressions by multiplying the amount of money a worker would pay to reduce slightly the chance of his or her death, by the number of workers needed to eliminate one expected death. This is in keeping with the textbook idea that the statistical value of life is the amount that workers are jointly willing to pay to reduce the likelihood that one of them will suffer a fatal injury in a given year on the job.
Viscusi and Gentry (Reference Viscusi and Gentry2015) shows that the Department of Transportation estimates the VOI by multiplying a general job-related VSL estimate by a proportion reflecting the relative value of a nonfatal injury to a fatality. The proportions used vary by injury severity, resulting in five estimates of VOIs that range from USD 27,600 to USD 5.5 million. However, when data on nonfatal risk is available, a more reliable estimate of the VOI should come from a CWD generated from nonfatal risk data, despite their heterogeneity. Safety measures can affect the probability of these outcomes as well because, in principle, the resulting losses in quality of life, including both pain and suffering and reduced income, should be estimated by a potential victims’ WTP for personal safety. The VOI in this paper has been estimated on the basis of the equation used by Bender and Mridha (Reference Bender and Mridha2011), which calculated the VSL by adopting the methodology followed in Viscusi (Reference Viscusi2004),Footnote 6 and Leeth and Ruser (Reference Leeth and Ruser2003).
Data
Our study uses two sources of data. The primary dataset is individual-level data on wages and worker characteristics from the March Current Population Survey (CPS) Merged Outgoing Rotation Groups (MORG). Nonfatal injury data is obtained from the national Survey of Occupational Injuries and Illnesses (SOII), which reports the total number of yearly cases of nonfatal occupational injuries and illnesses by race and gender for 2012–2015.Footnote 7 A dataset for the nonfatal occupational injury rates is constructed by merging the SOII and CPS-MORG data.
Demographic data
Individual-level data from the 2012–2015 March CPS annual earnings files are compiled by the National Bureau of Economic Research (NBER). The set of regressors that were controlled for include gender, marital status, veteran status, race, education, region of residence, age, age squared, year, the metropolitan area in which respondents live, union, and unemployment rates.Footnote 8 The interaction of unemployment and the risk coefficient was also used to show the dampening or negative impact of unemployment on wages in that geographical area.Footnote 9 Average hourly wage and demographic information are taken from the CPS to form a sample of workers. It may be noted that the sum of workers from the three races that we consider here will not be equal to the sum of the male and female workers, because we do not consider all races available and because there is some overlapping of race and ethnicity in the definitions.Footnote 10 It is also important to note that because the Hispanic population in the United States is composed of numerous subpopulations, their labour market outcomes are heterogenous. The two largest groups are Mexican and Puerto Rican. Among the Mexicans, many are US born and may have roots in the Southwest for several generations before the region was part of the United States, along with many who are more recent immigrants. Puerto Ricans, who are mainland born as opposed to island born, will also differ in the effects they face in the labour market. These demographic subdifferences affect the result of our analysis.
Nonfatal injury risk data
The SOII data provides the total number of yearly cases of nonfatal occupational injuries and illnesses involving days away from work by gender and race (White, Black, and Hispanic).Footnote 11 The injury rates represent the number of injuries and illnesses per 10,000 full-time workers. They were calculated as ( N /W) x 10,000, where N = the number of fatal work injuries and W = the number of employed workers as a ratio of 10,000 full-time equivalent workers, working 40 or 50 weeks per year. This employment-based risk incidence dataFootnote 12 is combined with the number of employed persons published by the BLS on the basis of the CPS.Footnote 13 The BLS incidence data is reported at the four-digit Standard Occupational Classification codes (SOC) based on the Standard Occupational Classification Manual, 2010 (https://www.bls.gov/soc/), while the March CPS occupation codes are based on the 2010 Census Occupation Code. To calculate the employment-based occupational injury rate by race and gender, the SOII and CPS data are merged at the four-digit Standard Occupation Classification (SOC).
Method
The following hedonic wage equation is used to estimate the CWDs for occupation risk:
 $$\rm {w_i} = \rm\alpha + {\beta _1}{X_i} + {\beta _2}{p_i} + {\beta _3}pi*U{R_i} + {\beta _4}U{R_i} + {\varepsilon _i},$$
where w is the log of wage for person i, p is nonfatal occupational injury risk, and X is a vector of personal and/or job characteristics containing education, sex, race, marital status, age, unemployment rates,Footnote 14 and the interaction term between the unemployment rate and injury risk. UR stands for the unemployment rate in the area where worker i resides and β3 represents the interaction term between the unemployment rate and injury risk. The estimate of β3 is expected to be negative, capturing the magnitude of decrease in the CWD for risk when the unemployment rates increases. The CWD is represented by β2, which is expected to be positive, indicating a wage premium received for accepting workplace risk. The sign of β4 can be positive if unemployment reflects job insecurity (Marston, Reference Marston1985), while a negative sign will represent a dampening impact of unemployment on wages.
In all regressions, we correct for variations arising from unemployment data at the metropolitan statistical area (MSA) and risk data at the occupation effect. We include a fixed effect to control for errors resulting from the MSA level data and another occupation fixed effect to control for occupation-level data. We have also clustered the standard errors at the occupation level to re-estimate the model. However, we report results from the model with the occupation and MSA level fixed effects that are non-clustered. The coefficients are the same, but the standard errors and t-stats change slightly in the clustered estimates.Footnote 15
We estimate the value of injury (VOI) based on our OLS model, for the subsamples which have positive risk coefficients. Our VOI formula is presented below and shows us that both unemployment and the interaction term of unemployment and risk have an essential role in influencing the value of the injury. Therefore, instead of a simple formulation such as VOI = 100*(dlnw/dRisk)*average wage*2000, we use the following equation for our calculations:
 $${\rm{VOI}} = 100*\left[ {\left( {{\rm{dlnw/dRisk}}} \right)-{{\rm{\beta }}_{\rm{3}}}*{\rm{UR}}} \right){\rm{]}}*{\rm{average}}\ {\rm{wage}}*2000*{\rm{average}}\ {\rm{injury)}}$$
where w = the wage rate, Risk = risk rate, and the other variables have been defined after equation (1).
The unemployment and the interaction term, shown in the results in Tables 1 and 2, indicate how much the estimated VOI falls for a one percentage point increase in the unemployment rate (Bender & Mridha, Reference Bender and Mridha2011, p. 304).
Table 1. Compensating wage differentials for nonfatal injury risk by gender (OLS)

The dependent variable is the log of real average wages. Other controls include (when appropriate) gender, marital status, veteran status, race, education, region of residence, age, age squared, year, and metropolitan and occupation fixed effects. Regressions are weighted using sample weights. Numbers in parentheses are t statistics. *, **, and ***indicate significance at the 10%, 5%, and 1% levels, respectively.
Table 2. Compensating wage differentials for nonfatal injury risk by race (OLS model)
The dependent variable is the log of real average wages. Other controls include (when appropriate) gender, marital status, veteran status, race, education, region of residence, age, age squared, year, and metropolitan and occupation fixed effects. Regressions are weighted using sample weights. Numbers in parentheses are t statistics. *, **, and ***indicate significance at the 10%, 5%, and 1% levels, respectively.
Descriptive statistics
BLS data show us that the occupational distributions of female and male full-time workers differ considerably, with relatively few women working in construction, production, or transportation occupations, and being far more concentrated in office and administrative support jobs. In 2015, 30 per cent of women worked in professional and related occupations, compared to 19 per cent of men; however, a much smaller proportion of women are employed in higher paying jobs within this occupation. Women in professional and related occupations were more likely to work in education and healthcare occupations, which generally pay less than computer and engineering, and have a far lower representation of women.
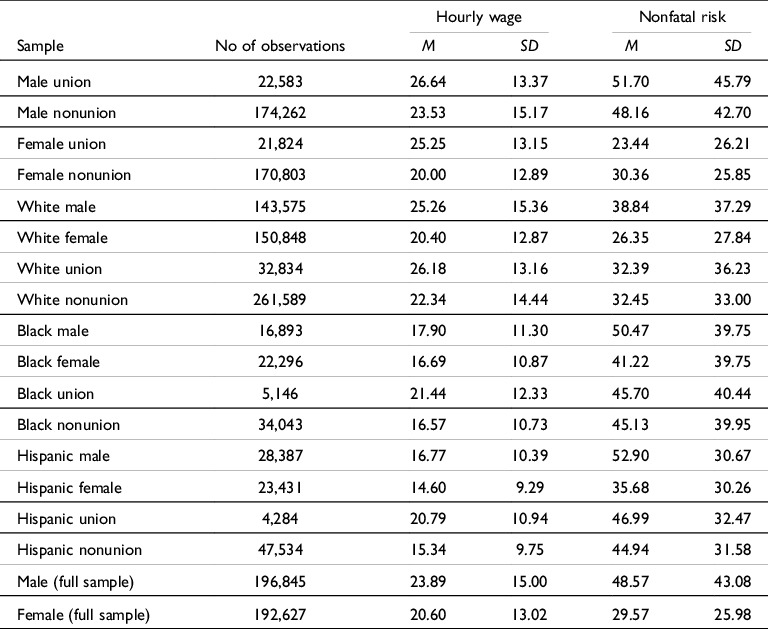
As shown in Table 3, our sample statistics point to features of the labour market in the United States that are corroborated in the literature. There are several salient points that emerge from the statistics.Footnote 16
Table 3. Summary of sample statistics
Source: Data on wages are from the 2012–2015 March CPS. Averages are weighted using CPS sample weights. Injury data are from the BLS.
Male workers constitute about 50.5% of the sample, showing the significant and sustained entry of women into the labour force and the decline of males in labour force participation during this period (Krueger, Reference Krueger2017). The majority of White workers are female at 51%, Black females dominate and are 57% of Black workers, but Hispanic females are 45% of all Hispanic workers in our sample. This corresponds to the gains in labour force participation and employment by Whites and Black women and confirms that Hispanic females have yet to make such gains, some of which has been attributed to education, less work experience, and younger age (Mora & Dávila, Reference Mora and Dávila2018).
Unionised workers are only 11.4% of total workers, and 51% of unionised workers are male. This illustrates the entry of women into unions by the 2012–2015 period, despite the gradual decline of unionisation in the United States. Black workers are 10.1% of all workers and are marginally overrepresented in unions in that 11.5% of union workers are Black. The opposite is true for Hispanic workers who constitute 13.3% of all workers but are only 9.6% of all union workers. These statistics correspond to national data (Dunn & Walker, Reference Dunn and Walker2016).
Union average wages are higher than nonunion wages, and the risk rate is higher in union jobs; curiously, the risk rate is higher for females in nonunion jobs than they are for union jobs. This may point to the difficulties of organising by female workers even when they do risky work. Female workers report more illnesses and have a longer duration of lost work time (Fontaneda et al., Reference Fontaneda, López, Alcántara and Ritzel2019). It is likely that they also take more days off for work–life reasons, especially when unionised.
Female wages (at USD 20.60 per hour) are 86% of male wages in the full sample. The gender wage gap falls to 94.7% when workers are unionised. We also find a race wage gap for Blacks and Hispanics as compared to White workers. Hispanic workers, even when unionised, receive average wages of USD 20.79 per hour, which is 96% of that received by Black union workers (USD 21.44). Hispanic unionised workers receive 79.4% of White union workers wages, the latter earning USD 26.18 per hour, which is the highest wage rate in our subsamples by race. White nonunionised workers receive USD 22.34 per hour and their Black counterparts earn 74.2% of that (USD 21.44), while Hispanic non-unionised workers receive only 68.6% of White nonunion wages at USD 15.34 per hour. These numbers demonstrate that unionisation lowers both the gender and racial wage gaps (Gould & McNicholas, Reference Gould and McNicholas2017; Kerrissey & Meyers, Reference Kerrissey and Meyers2022). We find Hispanic female workers to have the lowest average wage at USD 14.6 per hour, while White males command the highest wage at USD 25.26. This is regardless of whether they are unionised or not.
BLS (Dunn & Walker, Reference Dunn and Walker2016) gives us additional information consistent with our sample data in that 61% of women were paid hourly rates and had median hourly earnings of USD 12.56, or 86% of that of men, while women who were full-time wage and salaried workers, had median weekly earnings that were 81 % of males earnings.Footnote 17
The average risk numbers differ significantly across gender and unionisation. Males always show a higher rate of nonfatal risk compared to females. This is consistent with earlier findings from Leeth and Ruser (Reference Leeth and Ruser2003). Union workers also have a higher risk rate for males and across all races but are lower for female unionised workers. Males of different races have similar risk rates, with more variation across females, the highest rates found among Black females, followed by Hispanic females, and then White females.
Donado (Reference Donado2015) tells us that union members are 34% more likely to show more injuries because they are enabled to report more of these injuries; in addition, unions tend to be organised in workplaces that are potentially more injurious, specifically with respect to nonfatal injuries. Finally, he suggests the possibility of ‘distribution shifting’, which occurs when union-sponsored safety measures reduce fatal risk and converts them to nonfatal risk. His data cover several years between 1988 and 2000 and find that for females, unionisation does not make much of a difference in terms of nonfatal injuries. In our sample, which uses more recent data, unionisation lowers the risk rate for female workers, cutting them to less than half of that for male workers. White union workers also have a lower risk rate than White nonunion workers, attesting to the entry of more women into unions.
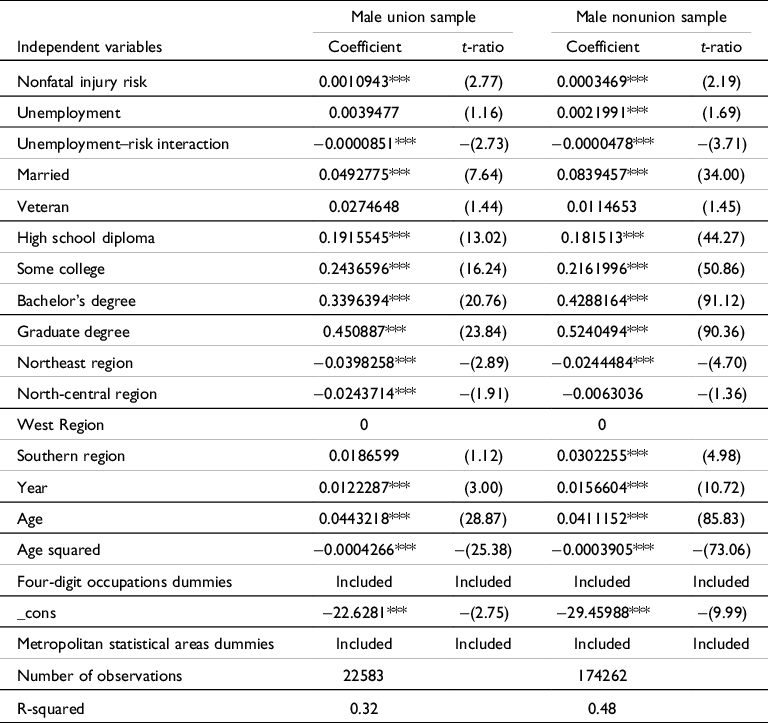
Table 1 presents the effect of our standard control variables for our male sample. Most of these variables are significant yield expected signs. For example, married males are likely to have higher wages for both unionised and nonunionised workers. Education variables such as a Bachelor’s degree or graduate degree have a sizeable effect on wages.
Results
Regressions were run on several subsamples to look for gender or race variations in the estimates.
We begin with gender differentiation and move on to consider races and the intersection of race and gender. We look at the effect on wages of nonfatal risk, unemployment, and the interaction of risk and unemployment.
Table 1 reports results from our male and female subsamples which are further disaggregated into union and nonunion workers. It shows that male workers, whether unionised or not earn a positive CWD and, while the coefficients are small in magnitude, they are significant. Several studies such as Leeth and Ruser (Reference Leeth and Ruser2003) or Black and Knieser (Reference Black and Kniesner2003) support these results. When they are unionised, the CWD rises. For females, the CWDs are negative and not significant in either subsample, union or nonunion.Footnote 18
Unemployment lowers wages and is significant in both cases. The interaction term is negative, as in male, but not significant. This finding of negative and insignificant CWDs is common in the literature (Bender & Mridha, Reference Bender and Mridha2011; DeLeire & Levy, Reference DeLeire and Levy2001; Leeth & Ruser, Reference Leeth and Ruser2003; Viscusi, Reference Viscusi2004). The entry of women into higher risk occupations and their willingness to take jobs at lower pay than would compensate for such risk may be responsible for our numbers. As nonfatal risk has fallen over time, the perception of risk may have fallen faster. The effect of unemployment on wages is positive and significant for nonunionised male workers and negative but significant for all female workers. The risk premium is reduced in the presence of unemployment for both groups, shown by the negative coefficient on the unemployment risk interaction term in the table.
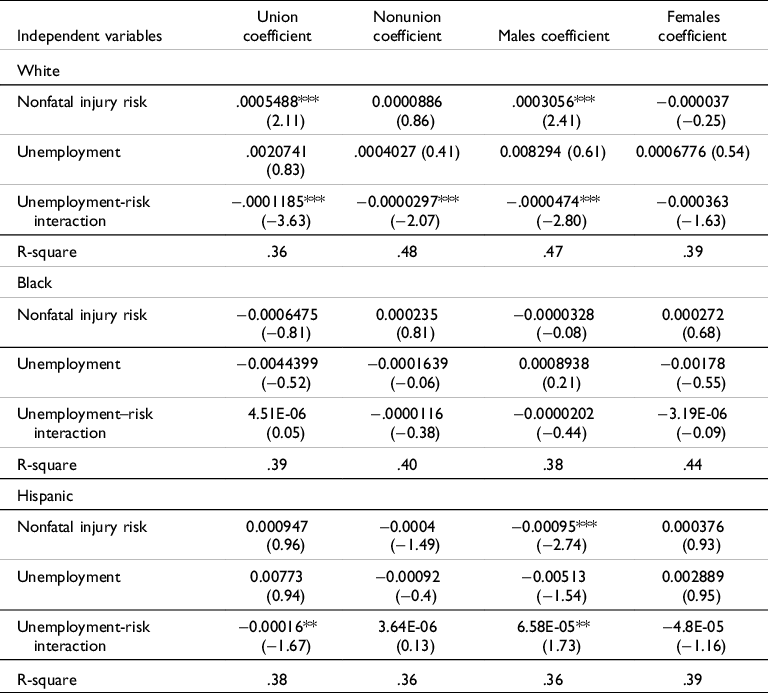
Table 4 reports the OLS results for the various races (White, Black, and Hispanic) by their union status and by gender. We will go over these by race.
Table 4. Estimates of CWDs for male sample (union and nonunion) with control variables
The dependent variable is the log of real average wages. Other controls include (when appropriate) gender, marital status, veteran status, race, education, region of residence, age, age squared, year, and metropolitan and occupation fixed effects. Regressions are weighted using sample weights. Numbers in parentheses are t statistics. *, **, and ***indicate significance at the 10%, 5%, and 1% levels, respectively.
For the White sample, we find that both White union and nonunion workers earn positive CWD (significant for union only), and this risk premium is higher for the union sample. There is a possible spillover effect of nonunion workers receiving the benefits of higher wages. Whether right-to-work laws are present or not, we find unions not only encourage membership and participation for all workers but also extend their support beyond their members. One example is when unions organise hiring halls to recruit new workers for employers with which they have collective bargaining agreements. This, and other types of assistance and advice, affects all workers, including nonmembers, by leveraging the power of collective bargaining to negotiate workforce-wide employment contracts that improve compensation and conditions for everyone.
Unemployment is positive for both cases (but not significant), and the risk-unemployment coefficient is negative for both groups (significant for both).
When we look at our White sample by gender, we find that males have a positive and significant CWD but the risk coefficients for White females are both negative and insignificant. This is consistent with previous findings by Bender and Mridha (Reference Bender and Mridha2011), DeLeire and Levy (Reference DeLeire and Levy2001), and Viscusi (Reference Viscusi2004). The effect of unemployment is positive but not significant for both genders, and the risk-unemployment coefficient term is negative for both and significant for White males.
In our Black sample, nonunion workers receive a positive risk premium, but the unionised workers do not. The coefficients are not significant. Leeth and Ruser (Reference Leeth and Ruser2003) have also found that the nonfatal injury risk premium for nonunion blue-collar male workers is higher than their unionised counterparts. They also find that ‘among blue-collar workers both male and female nonunion workers earn significantly higher pay for nonfatal injury risk but neither male nor female union workers earn significantly higher pay’ (Leeth & Ruser, Reference Leeth and Ruser2003: 275). Bucknor (Reference Bucknor2016) says that Black union workers of today differ from those in the past and are likely to be female, older, have more years of formal education, be immigrants, and work in the public sector. Of these union workers, 71.4% have employer-provided health insurance, whereas only 47.7% of nonunion Black workers have such benefits; in addition, 61.6% of Black union members have employer-sponsored retirement plans, compared to 38.2% of their nonunion counterparts. In other words, any job risks for unionised workers are being compensated for indirectly, and not being attached directly to the risk rate at a particular job, while nonunionised workers are directly compensated for risk. When we look at the Black sample by gender, while the coefficients are not significant, we find that females have a positive CWD but males do not. Leeth and Ruser (Reference Leeth and Ruser2003) find that when fatal risk is also included in their sample, CWDs are strongly significant but the exclusion of fatal risk data lowers the magnitude of the estimates of nonfatal injury risk coefficients. In addition, the smaller sample sizes for Black men and women may play a role in our findings.
Finally, we turn to our Hispanic sample to find that Hispanic union workers garner a positive CWD, but nonunion workers do not, both results not being significant. The interaction term is negative and significant for union workers, showing that the risk premium falls for them when unemployment rises. Looking at this sample by gender, we see that the risk premium for Hispanic women exceeds that of males. Hispanic females have a positive risk premium but, as is common for women, it is not significant. Male Hispanic workers have a negative but significant CWD, consistent with Leeth and Ruser (Reference Leeth and Ruser2003) who find no evidence of significant nonfatal injury risk compensation for either Black or Hispanic males, but some evidence for White and other minority males. The unemployment rate is negative for males and positive for females but not significant in either case. The interaction term is significantly positive for Hispanic males, suggesting that the risk premium rises for them even when unemployment rises.
Comparing across races, our estimates show that, among unionised workers, the risk premium gained by White employees exceeds that of Hispanic ones, while Black employees receive negative wage premia. Weller and Madland (Reference Weller and Madland2022) show that union membership has won greater wages for White households than for Hispanic households, and our results are in keeping with this finding.
We believe that unionisation can allow workers to negotiate a wage that includes the price of risk by giving them more market power and shifting compensations based on job risk to the buyer. Hamermesh and Wolfe (Reference Hamermesh and Wolfe1990: S196) explain that unions bargain for higher wages to compensate the median member for risk of injury and, in the case of losses due to injuries, unions raise the compensation for all workers when the chances of injury are higher in a job. Also, as mentioned earlier, unions shift injuries from being fatal to nonfatal through their influence on the adoption of worker safety measures (Donado, Reference Donado2015). Unions have benefitted women in that they are prone to participate in pension plans if they are unionised and likely to receive health insurance benefits through their jobs. The increase in insurance coverage was marked for Hispanic women, when compared to other groups (IWPR, 2015)
Correcting for endogeneity
The subjective valuation of risk by an individual may also determine his or her choice of a job, rendering risk an endogenous variable, thereby requiring endogeneity corrections when estimating the CWD (Garen, Reference Garen1988). Workers may have varying risk preferences when making choices regarding wages and occupations, these preferences being related to unobserved variables, thus generating biased OLS estimates. Garen (Reference Garen1988) indicates that risk preferences may be related to family and life characteristics of workers. Hersch demonstrates that preferences with respect to job risks can vary by gender, requiring separate wage equations by gender (Viscusi, Reference Viscusi2004).
The ideal way to deal with endogeneity concerns is through instrumental variables (IVs) techniques, and the use of Two-Stage Least Squares (TSLS). In using IVs, the first step is to determine if these are relevant and strongly correlated with the risk variable. We used two variables, the number of children under 6 years and the number of children under 18 years, as IVs reflecting worker individual characteristics that are likely to affect their risk preferences. Upon performing Sargan and Durbin-Wu-Hausman tests on our IVs in each of our subsamples in Table 3, we found the IVs to be valid but not strong for every sample. Without the possibility of a better IV in our dataset, we used the more efficient OLS estimates following suggestions from Semadeni, Wihers, and Certo (2014), who recommend that instruments that are weak and endogenous will lead to results that are inferior to those reported using OLS.Footnote 19
Estimates of the value of injury
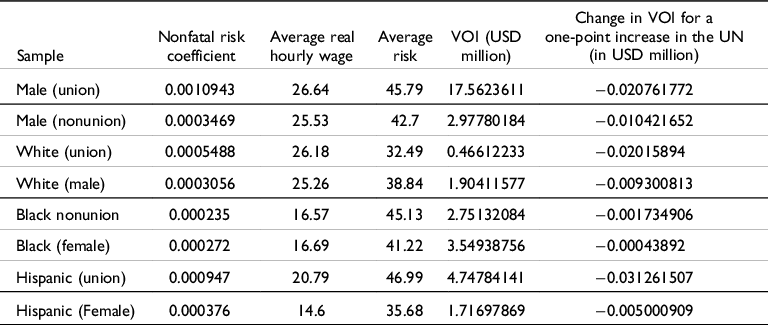
Table 5 shows the positive VOI estimates that we derived based on our positive estimated CWD coefficients.Footnote 20 The derived VOI estimates range from USD 466, 122.33 for all White unionised workers to USD 17.56 million for all male unionised workers. Male workers who are in unions command a much higher VOI than the rest of the samples, followed by Hispanic unionised workers, confirming for us that unionisation can increase compensation for workers who take higher risks. From the two female estimates, we see that Black females who have higher risk rates than other female workers have a VOI of USD 3.55 million as compared to Hispanic females who have a VOI of USD 1.72 million.
Table 5. Estimates of the value of injury, VOI (USD thousand), for OLS model
Leeth and Ruser (Reference Leeth and Ruser2003) tell us researchers usually find a value of life somewhere between USD 4.1 million and USD 9.6 million in 2002 dollars. Kniesner et al. (Reference Kniesner, Viscusi, Woock and Ziliak2012) report a wider range for the VSL, from USD 0.5 million to USD 21 million, citing previous studies that used the Panel Study of Income Dynamics to yield high VSL estimates. Their own research, correcting for various econometric problems, ranged from USD 5.5 million to USD 7.5 million. Viscusi and Aldy (Reference Viscusi and Aldy2003) survey 15 selected hedonic wage studies that use the Census of Fatal Occupational Injuries (CFOI) database to estimate VSL. Several of these studies focus on how the VSL varies by gender, age, race, immigrants versus natives, smokers versus nonsmokers, and different fatality risks; the econometric specifications or the focus on a narrowly defined occupational group appears to bias the results, and it is not often apparent which is the most accurate estimate when there are multiple model specifications. Guardado and Ziebarth (Reference Guardado and Ziebarth2019) calculate a VSL of USD 6.3 million and a VOI of USD 45,4000.
Other reasons for why VSL and VOI estimates differ so widely across studies include the role of unobserved variables and sorting into occupations (Black & Kniesner, Reference Black and Kniesner2003; Guardado & Ziebarth, Reference Guardado and Ziebarth2019; Hamermesh & Wolfe, Reference Hamermesh and Wolfe1990; Kniesner et al., Reference Kniesner, Viscusi, Woock and Ziliak2012; Leeth & Ruser, Reference Leeth and Ruser2003). In addition, Shogren and Stamland (Reference Shogren and Stamland2002) argue that VSL estimates are likely to be biased upward if we do not account for worker heterogeneity regarding risk preferences and worker skill at reducing risk.Footnote 21 Finally, Lavetti and Schmutte (Reference Lavetti and Schmutte2018) present a correction for bias in CWD estimates that result from endogenous job mobility when there is unobserved firm heterogeneity. Kniesner et al. (Reference Kniesner, Viscusi, Woock and Ziliak2012) illustrate that controlling for unobserved worker heterogeneity makes a difference in VSL estimates. These findings also imply that occupational sorting by risk can have a bearing on the gender wage gap. For example, DeLeire and Levy (Reference DeLeire and Levy2001) show that variations in occupation-specific fatality risk explain a quarter of gender sorting into occupations.
Conclusions
In this paper, we empirically re-evaluate a monetary measure of workplace injury risk. Like other investigators, we find that nonfatal risk is heterogenous, and its compensation is difficult to estimate using a standard wage equation. This problem remains even with some smaller subsamples from our dataset that are gender- or race-specific. As explained by Hersch (Reference Hersch1998), such measurement error is not within our control, leading to many negative coefficients. However, there are several meaningful results when disaggregating our findings by subgroups. We find male workers to command a positive risk premium, and this is higher when they are unionised. We also find a positive risk premium for White unionised workers and a slightly lower risk premium for White males. Although this shows in the positive effect that unions can have in some of our subsamples, for the reasons given above, we are unable to estimate this effect across the board for all demographics. Further work is needed to fully reveal the influence of union membership by race and gender.
Following previous research, we take into consideration worker risk preferences. However, in correcting for endogeneity, we are not able to use an appropriate IV from our dataset and therefore rely on our OLS estimates.
Our estimates of the VOI show us that male workers who are unionised have the highest VOI, followed by Hispanic union workers and Black females. This last finding follows from Black females working in jobs that have the highest risk rates compared to White and Hispanic females.
Limitations of our study that are worth mentioning are that we did not look at age or immigrant status. Younger workers between ages 15 and 24 years who represent 13% of the workforce also sustain a high rate of injury. From 2012 to 2018, injury rates here 1.2 to 2.3 times higher for this age group (Guerin et al., Reference Guerin, Reichard, Derk, Hendricks, Menger-Ogle and Okun2020).
Immigrants, particularly those with less fluent English-speaking skills, can be more vulnerable in the workplace, and their lack of negotiating power can lower compensations for workplace risk (Dorman & Boden, Reference Dorman and Boden2021). In addition, in most of the United States, employers are required by workers’ compensation programmes to provide medical benefits and cash compensation to injured workers. Over time, these have increased, while workplace injuries and illnesses have fallen. Based on our findings, policy-makers and regulators may need to review how employers systematically assign and compensate people of different races and gender-specific jobs or job tasks according to their risk.
Acknowledgments
We are grateful to John Leeth and Keith Bender for their helpful comments and suggestion regarding clustering the standard errors at the occupational level and including the fixed effect of the MSA and/or occupational level in the hedonic wage equation.
Author contributions
The authors have contributed equally to this article.
Funding statement
The authors received no financial support for the research, authorship, and/or publication of this article.
Conflicts of interest
None.
Ethical standards
Any ethical standards have been maintained as data used was published secondary data and the authors have no affiliation that could generate any ethic conflict.


 Open access