

Introduction
Recent satellite observations and techniques, such as satellite laser altimetry, time-variable gravity and the mass-budget method, have shown that the West Antarctic ice sheet (WAIS) has been losing ice at a considerable rate over recent decades (Reference RignotRignot and others, 2008, Reference Rignot, Velicogna, Van den Broeke, Monaghan and Lenaerts20112011; Reference Chen, Wilson, Blankenship and TapleyChen and others, 2009; Reference Pritchard, Ligtenberg, Fricker, Vaughan, Van den Broeke and PadmanPritchard and others, 2012). The primary trigger of this recent loss appears to be increased sub-ice-shelf melt. A likely shift in wind patterns has resulted in the delivery of substantial volumes of Circumpolar Deep Water underneath the floating ice shelves of the Amundsen Sea Embayment (ASE) (Reference Thoma, Jenkins, Holland and JacobsThoma and others, 2008; Reference Pritchard, Ligtenberg, Fricker, Vaughan, Van den Broeke and PadmanPritchard and others, 2012). The subsequent high basal melt rates lead to a thinning of the ice shelves, which reduces their restraint (the so-called ‘buttressing effect’) on inland glaciers (Reference Dupont and AlleyDupont and Alley, 2005). Loss of buttressing has increased the flow rate of inland outlet glaciers and thus grounded ice-sheet loss, contributing to sea-level rise (Reference Rignot, Velicogna, Van den Broeke, Monaghan and LenaertsRignot and others, 2011).
The WAIS has a bed that is grounded well below sea level and generally sloping upward toward the ocean (known as a ‘retrograde’ bed slope; Reference Gudmundsson, Krug, Durand, Favier and GagliardiniGudmundsson and others, 2012). In such a situation, the grounding line, defined as the boundary between the grounded ice sheet and the floating ice shelf, is unstable if the ice shelf is freely floating, at least in flowline models with no transverse variations (Reference WeertmanWeertman, 1974; Reference SchoofSchoof, 2007). Attention has been paid to the WAIS due to this possible marine ice-sheet instability and to the observational evidence that glaciers have been retreating inland. Reference Gudmundsson, Krug, Durand, Favier and GagliardiniGudmundsson and others, (2012) have found stable steady-state grounding-line positions on retrograde bedrock slopes using a three-dimensional (3-D) ice-sheet model, due to the presence of ice-shelf buttressing, but the bedrock configuration of these experiments is very specific and would not necessarily lead to ice-sheet stability if slightly modified.
Located in the ASE, Thwaites Glacier (TG) is one of the largest, fastest-flowing and fastest-thinning glaciers of the WAIS. Together with Pine Island Glacier (PIG), it drains
~20% of the WAIS and significantly contributes to current Antarctic ice-sheet loss and thus sea-level rise (Reference RignotRignot and others, 2008). Thwaites Glacier has two distinct floating ice masses: the TG tongue, downstream of the central area of fastest flow and providing limited buttressing to the inland ice (Reference RignotRignot, 2008; Reference ParizekParizek and others, 2013), and the eastern ice shelf, where the velocities are much lower than in the tongue, due to the presence of a pinning point (Reference Tinto and BellTinto and Bell, 2011). In 2010, a major part of the TG tongue calved, although there is still an ice melange linking the new iceberg (>2000 km2) and the smaller remaining ice tongue (Reference MacGregor, Catania, Markowski and AndrewsMacGregor and others, 2012). If the eastern ice shelf was to calve, as the TG tongue did in 2010, the buttressing provided by the pinning point would be lost.
Motivated by the relatively small number of modeling studies on TG (described below), combined with its potential contribution to future sea-level rise, we performed sensitivity experiments using a variety of datasets (geometry, ice velocity, basal shear stress, ice temperature, sub-ice-shelf melt rate, accumulation rate) that we incorporated into a finite-difference flowline ice-stream/ice-shelf shallow-shelf approximation (SSA) model. The data, the model and the different sensitivity experiments are described below. We also present the results of our modeling study as well as a discussion.
Previous Modeling Studies
Several modeling efforts have been carried out on PIG, but there has been less attention paid to TG to date. The 3-D SSA model of Joughin and others (2010a) indicated that the grounding-line retreat rate of PIG should diminish soon, but the glacier would continue to lose mass at rates comparable with the present. In another study of PIG, Reference GladstoneGladstone and others, (2012) coupled their flowline SSA model to an ice-shelf cavity circulation model (Reference Olbers and HellmerOlbers and Hellmer, 2010), predicting a monotonic retreat of the grounding line over the next 200 years, with large uncertainty in the retreat rate. They used parameterized mass balance and basal friction coefficients, and constant Glen’s flow law parameter and channel width. Reference CornfordCornford and others, (2013) applied their 3-D depth-integrated hybrid finite-volume model with adaptive mesh refinement to PIG and showed a rapid deglaciation caused by sub-ice-shelf melting.
Concerning TG, a recent modeling study by Reference ParizekParizek and others, (2013) focused on the impact of spatial resolution of existing datasets, grounding-zone processes and till rheology on the glacier dynamics. They used an ice-stream/ice-shelf finite-element model with 1.5- and 2.5-D treatments of mass continuity and momentum balance, respectively, coupled to an ocean-plume model. They applied the model in flowline mode to the center line of TG. They showed that a bedrock rise, currently located upstream of the grounding line, produces a stable grounding-line position for centuries or longer. This stabilization disappears and TG retreats if the basal friction is reduced and warm water penetrates into the grounding zone, unless the bed is effectively plastic.
The approach taken here differs from that of Reference ParizekParizek and others, (2013) in three ways. First, the domain extends upstream all the way to the ice divide, while Reference ParizekParizek and others, (2013) started the domain at the confluence of TG tributaries, where incoming ice flux is specified as a boundary condition. Second, we use the recent bathymetry of Reference Tinto and BellTinto and Bell, (2011) and also test the new bed data from Bedmap2 (Fretwell and others, 2013). Third, we focus on variable-width and buttressing parameterizations.
Methodology
Data
We used the following elevation, ice thickness and bathymetry datasets as input into our model: (1) ice surface elevation of Bamber and others’ (2009) 1 km digital elevation model; (2) grounded ice thickness interpolated from the work of Reference HoltHolt and others, (2006) and Reference Le Brocq, Payne and VieliLe Brocq and others, (2010); (3) floating ice thickness derived from Reference Bamber, Gomez-Dans and GriggsBamber and others, (2009), using a hydrostatic assumption (Reference Griggs and BamberGriggs and Bamber, 2009); and (4) bathymetry from Reference Nitsche, Jacobs, Larter and GohlNitsche and others, (2007) and Reference Le Brocq, Payne and VieliLe Brocq and others, (2010), with the addition of the Reference Tinto and BellTinto and Bell, (2011) bathymetric model.
We used surface velocity, u, and basal shear stress, τ b,
from Reference JoughinJoughin and others, (2009) to calculate the basal friction coefficient, C, using a Weertman-type sliding law:
where m is the basal friction exponent. No consensus has emerged on the most realistic value of m (Reference GudmundssonGudmundsson, 2011). In our study, m is set to 1/3, based on prior model experiments with m values in the range 1/8 to 1, seeking the best match with observed modern velocities.
Ice temperature and sub-ice-shelf melt rate are prescribed from the modern output of another 3-D ice-sheet/ice-shelf model (Reference Pollard and De ContoPollard and DeConto, 2012). We derived Glen’s flow parameter, A, from ice temperature using Eqn (16) of Reference Pollard and De ContoPollard and DeConto, (2012) and sub-ice-shelf melt rate from Pollard and DeConto’s, (2012) Eqn (17). We used estimates of accumulation rate from Reference Van de Berg, Van den Broeke, Reijmer and Van MeijgaardVan de Berg and others, (2006).
All of the input data (elevation, ice thickness, velocity, basal shear stress, Glen’s flow parameter, sub-ice-shelf melt rate and accumulation rate) were interpolated onto our model grid.
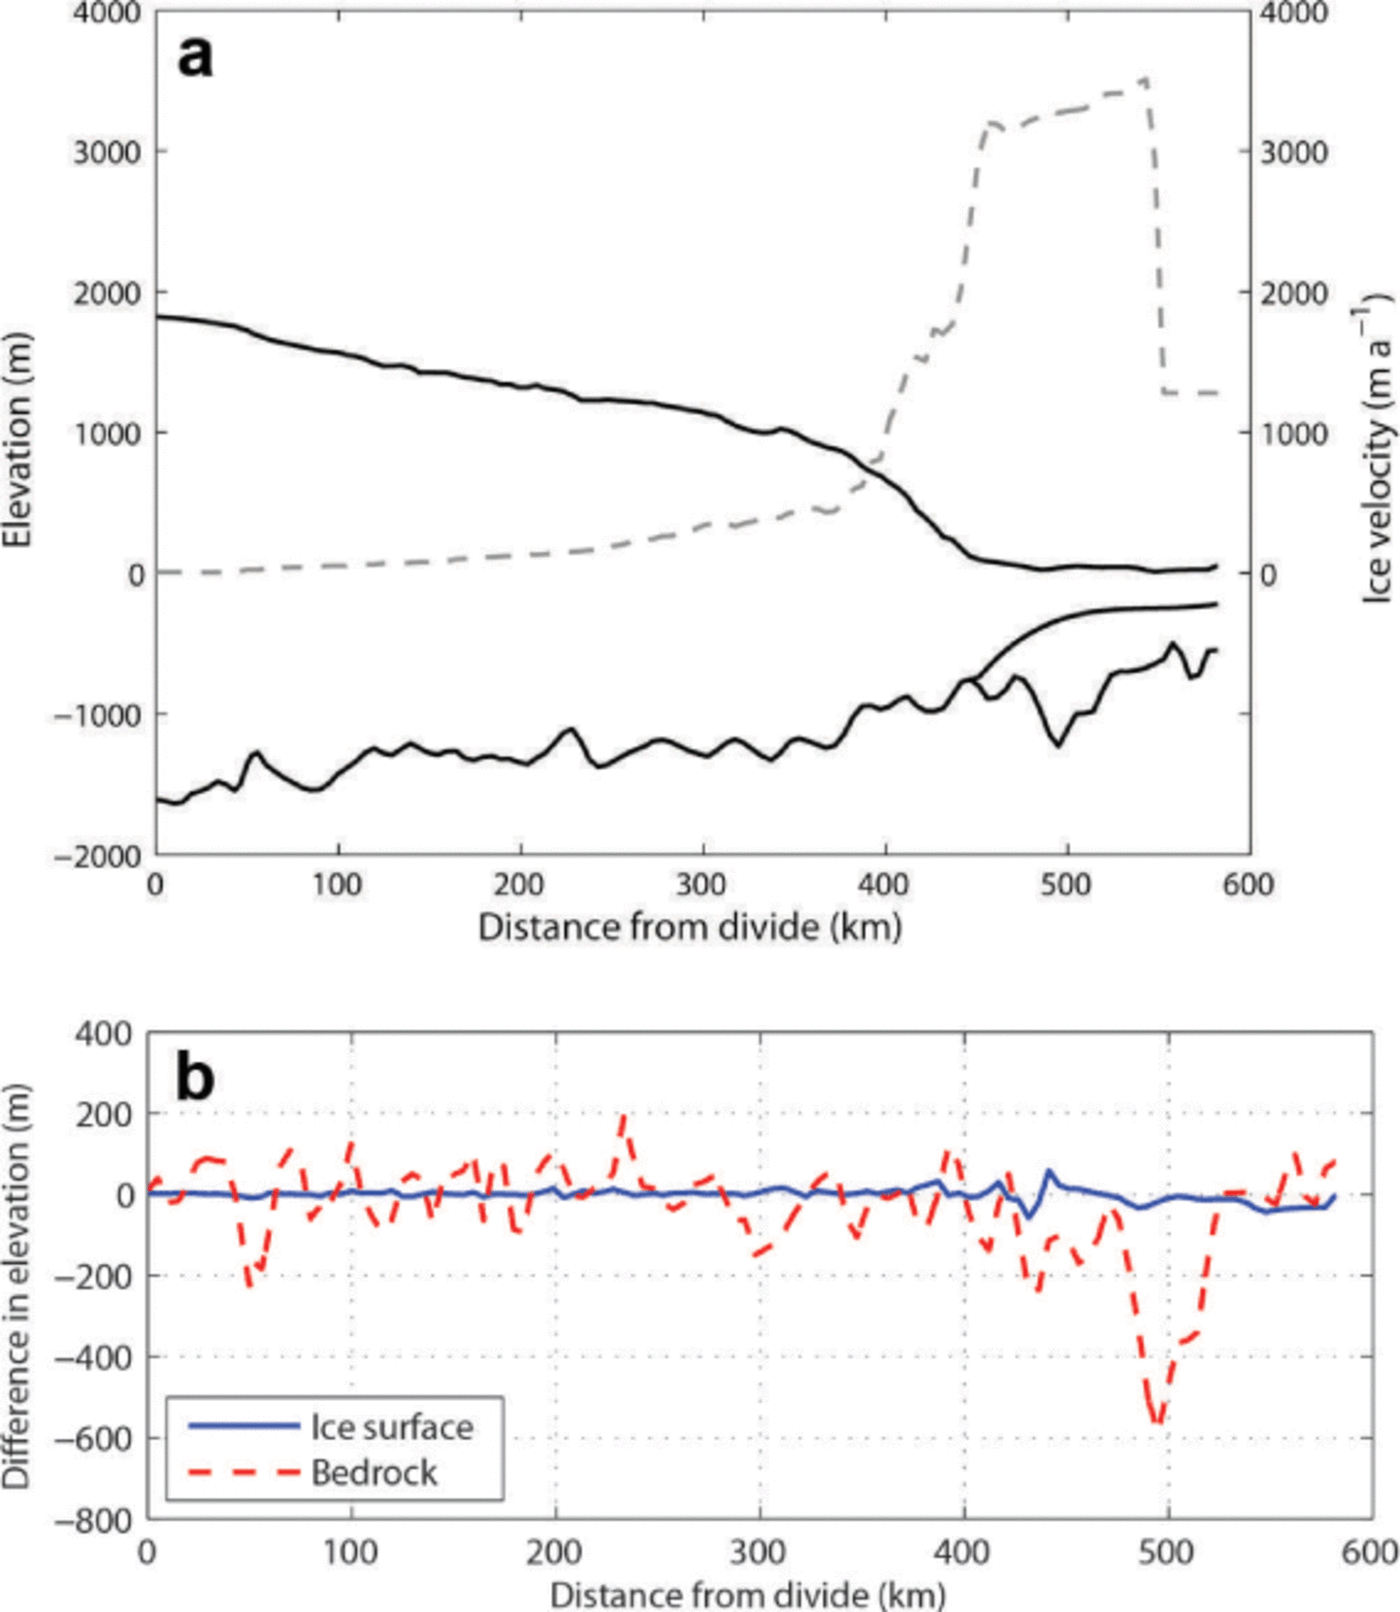
We use the same flowline coordinates as Reference ParizekParizek and others, (2013), which represent the line of fastest flow. Figure 1 shows the flowline used in this study, superimposed on the ice velocity map of the ASE (Reference JoughinJoughin and others, 2009). The flowline domain length from the ice divide to the calving front is ˜580 km. The geometry and velocity profiles derived from the data are shown in Figure 2a, where we can clearly identify the different bedrock highs and lows, as well as the overall upward-sloping bedrock. In contrast to Bedmap2 (Fretwell and others, 2013), our bathymetry identifies a trough in bed elevation under the ice shelf 500 km from the ice divide (Fig. 2b), which can also be seen in Reference Tinto and BellTinto and Bell’s, (2011) Figure 3b. Other differences in bed elevation (up to 200 m) between both datasets are visible upstream of the grounding line. Since Bedmap2 does not incorporate the recent bathymetric model of Reference Tinto and BellTinto and Bell, (2011) and its different features, we use the dataset from Reference Tinto and BellTinto and Bell, (2011). The grounding line of TG is located on a small sill ˜450 km from the ice divide; with Bedmap2 topography, the grounding line would be 5 km downstream of this sill on a downward-sloping bed (Fig. 2). Therefore, simulations using Bedmap2 data would have a slower retreat due to the more stable initial grounding-line position (Reference SchoofSchoof, 2007).
Observed ice velocity (m a–1) of the ASE (Reference JoughinJoughin and others, 2009), with the flowline of Thwaites Glacier used in this study represented as a dashed white curve and the Mosaic of Antarctica (MOA) grounding line shown in solid black (Reference Scambos, Haran, Fahnestock, Painter and BohlanderScambos and others, 2007). The inset shows the location of the ASE in Antarctica.

(a) Observed geometry (solid black curves) and ice velocity (dashed gray curve) profiles of Thwaites Glacier from the ice divide to the calving front with our dataset. (b) Difference in ice surface and bedrock elevations between our dataset and Bedmap2.
Lateral boundaries of (a) Exps. CW and VW1–VW3 and (b) Exps. VW3 and CSW1–CSW3 represented in different colors. Lateral boundaries of Exps. CSW1–CSW3 correspond to the grounding-line position, xg2. The two white vertical lines in (b) are the initial grounding-line position (xg1) and the grounding-line position after ˜100 years (xg2). The colored map shows the observed ice velocity (m a–1) of the ASE (Reference JoughinJoughin and others, 2009) with the flowline of Thwaites Glacier used in this study (dashed white curve) and the MOA grounding line (solid black curve) (Reference Scambos, Haran, Fahnestock, Painter and BohlanderScambos and others, 2007).

Model description
We use a finite-difference flowline ice-stream/ice-shelf model (vertically integrated) that computes the SSA on a fixed staggered grid, with x and z being the distance along the flow from the ice divide to the calving front and the elevation above sea level, respectively. The model is the SSA–FG model, which stands for ‘shallow-shelf approximation – fixed grid’, as used by Reference DrouetDrouet and others, (2013). This model has successfully participated in the Marine Ice Sheet Model Intercomparison Project (MISMIP; Reference PattynPattyn and others, 2012) under the name ‘FPA5’. The grid size needs to be small enough to enable an accurate calculation of the motion of the grounding line (Reference Vieli and PayneVieli and Payne, 2005; Reference Durand, Gagliardini, Zwinger, Le Meur and HindmarshDurand and others, 2009; Reference Docquier, Perichon and PattynDocquier and others, 2011; Reference PattynPattyn and others, 2012, 2013). In this study, we use a grid size of 50 m.
The use of such a flowline model, instead of a 3-D model, is justified by the fact that some 3-D effects can be parameterized (such as the buttressing effect and the flow convergence) and the computation time is much shorter than with a 3-D full-Stokes model.
We assume that the SSA can be used to simulate the behavior of fast-flowing glaciers, such as TG. In the most upstream regions of the drainage basin, vertical shear stress may play a more important role, but we did not take it into account, due to the lack of corresponding studies.
The horizontal velocity, u, is obtained by solving the following SSA equations (Eqns (2) and (3)) (Reference MacAyealMacAyeal, 1989). In the grounded ice sheet (0 ≤ x ≤ x g), basal friction is taken into account:
And in the floating ice shelf (xg < x ≤ xf):
where x g is the grounding-line position, x f is the calving front position, h is the ice thickness, τxx = 2η ∂u/∂x is the longitudinal deviatoric stress, ρ i is the ice density, g is the gravitational acceleration and z s is the ice surface elevation. A comparison between lateral drag (calculated as by Reference Van der Veen and WhillansVan der Veen and Whillans, 1996) and basal drag showed that the former is much less important than the latter for the flowline used here. Furthermore, Reference ParizekParizek and others, (2013), who use the same flowline as in our experiments (except that it starts from the flow convergence), mention that basal drag is dominant over lateral drag in their study area. Therefore, lateral drag was not parameterized in the model. The effective viscosity, η, is computed as

where A and n = 3 are the Glen’s flow law parameter and exponent, respectively; γ is defined as

Where ρ w is the water density. The boundary condition at the ice divide is u(x = 0) = 0, and the boundary condition at the ice bottom in the ice sheet is already included in Eqn (2). The horizontal force acting on the calving front is balanced by the hydrostatic water pressure (Reference PatersonPaterson, 1994):
where h f is the ice thickness at the calving front and C F is the buttressing factor (Reference DrouetDrouet and others, 2013). A value of C F = 1 means that the ice extension is opposed solely by water pressure, i.e. there is no ice-shelf buttressing. For C F > 1, this induces a lower longitudinal stress at the calving front, so that the inward force at the calving front is modified by a factor C F, simulating the buttressing effect. We model the whole ice shelf since a calving criterion is not implemented.
The ice bottom elevation, z b, is determined from the no-penetration condition and the floating condition. For x ≤ x g:
And for x > xg:
where b is the bedrock elevation and l w is the sea-level height.
The ice surface elevation, z s = z b + h, is deduced from the vertically integrated mass-conservation equation,giving h as
Where ω is the glacier width,ȧ is the ice accumulation rate and m b is the sub-ice-shelf melt rate (melting is allowed from the grounding line to the calving front). The flow convergence and divergence are therefore taken into account through the parameter ω, which varies along the flowline.
The grounding-line position is determined through the flotation criterion.
Sensitivity experiments
We performed 16 sensitivity experiments for TG (Table 1). The aim of the experiments is to investigate the behavior of TG under varying width and buttressing parameterizations, all mimicking, to some extent, possible scenarios of present-day and future states. The model is initialized using the modern observed data described above, and is then run to equilibrium with modern climate forcing. After sufficient years of integration, this yields an approximate match between observed and modeled geometry profiles on the one hand, and observed and modeled velocity profiles on the other. The time-span of most experiments is 200 years, as used in ‘ice2sea’ projections (Reference GladstoneGladstone and others, 2012; Reference Hellmer, Kauker, Timmermann, Determann and RaeHellmer and others, 2012; Reference DrouetDrouet and others, 2013). Unless otherwise mentioned, the buttressing factor C F = 1 (i.e. no ice-shelf buttressing).
Summary of the 16 sensitivity experiments performed at TG in this study
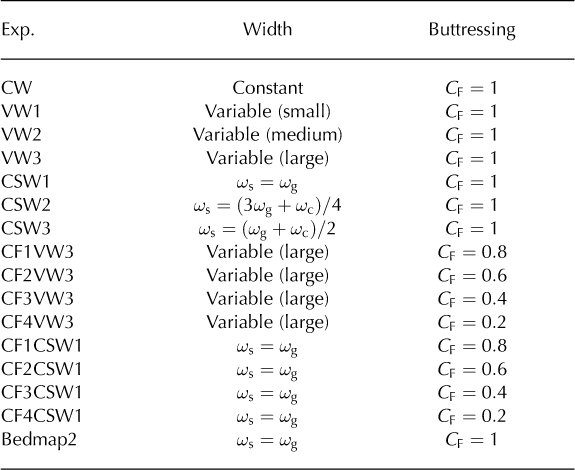
In Exp. CW (Exp. and CW stand for ‘experiment’ and ‘constant width’, respectively), the glacier width is kept constant over the whole domain (which is equivalent to ω = 1 in Eqn (9)), so there is no flow convergence. However, in reality, the drainage basin of TG is quite wide at the ice divide, and narrows as it approaches the ice shelf. Therefore, a spatially variable glacier width should be used in the continuity equation (Eqn (9)). This allows us to take into account the flow coming from the glacier tributaries that feed the main trunk of the glacier. Given the complex flow pattern in the interior of the TG drainage basin, several parameterizations for convergence and divergence of ice flow have been tested, which may all be plausible. Exp. VW1 (VW stands for ‘variable width’) has the smallest mean glacier width with diverging flow upstream of the zone of convergence noted above. Exps. VW2 and VW3 only have a convergent flow regime, with VW3 having the largest mean glacier width profile. The lateral boundaries of CW, VW1, VW2 and VW3 are shown in Figure 3a.
In the variable-width experiments (VW1–VW3), the width at the grounding line increases as the grounding line retreats inland, resulting in flow convergence within the first few kilometers of the ice shelf. This tends to generate a thicker ice shelf than is the case with constant width in the shelf. This effect may not be real, because the boundaries of shelf flow could shift laterally in different ways as the grounding line retreats. Therefore, we carry out three further experiments based on the VW3 width profile, but keeping the width in the ice shelf constant at each time-step. In these experiments, named CSW1, CSW2 and CSW3 (CSW stands for ‘constant shelf width’), the ice-shelf width, ω s, is equal to ω g,(3ωg + ωc)/ 4 and (ωg + ωc)/ 2, respectively, where ωg and ωc are the widths at the current grounding line and calving front, respectively (Fig. 3b). Since the lateral boundaries of those experiments vary through time in order to keep a constant ice-shelf width, we show lateral boundaries corresponding to the middle of the simulation (after ˜100 years) in Figure 3b.
Thwaites Glacier tongue is known to exert limited buttressing on the inland grounded ice (Reference RignotRignot, 2008; Reference ParizekParizek and others, 2013), but the eastern ice shelf is in contact with a pinning point (Reference Tinto and BellTinto and Bell, 2011), reducing the flow of inland ice. To simulate the buttressing effect arising from the eastern ice shelf, we reduce longitudinal stress at the calving front in Eqn (6), in a similar manner to Reference DrouetDrouet and others, (2013), i.e. by lowering the buttressing factor, C F. Exps. CF1VW3, CF2VW3, CF3VW3 and CF4VW3 are based on the VW3 width profile and use values of C F = 0: 8, 0.6, 0.4 and 0.2, respectively, from the beginning of the simulation to the end. The same values of C F are used in Exps. CF1CSW1, CF2CSW1, CF3CSW1 and CF4CSW1, which are based on the CSW1 width profile. For example, a value of C F = 0: 2 means that the longitudinal stress at the calving front is five times lower than if C F = 1. This simulates an increase in buttressing, caused by lower sub-ice-shelf melt, for instance, and leads to deceleration of inland grounded ice.
We performed a final experiment with the new Bedmap2 bedrock data based on the CSW1 width profile to test how the new bedrock profile affects results, in comparison with the bedrock data used in the other experiments.
Results and Discussion
Initialized using modern data, most of the experiments lead to an approximate match between observed and modeled geometry profiles on one hand, and observed and modeled velocity profiles on the other, after 10 model years (Figs 4 and 5).
Modeled geometry profiles of Thwaites Glacier after 10, 50, 100, 150 and 200 years (from right to left) and observed geometry profile for (a) Exp. CW (constant width), (b) Exp. VW3 (variable width), (c) Exp. CSW1 (constant shelf width) and (d) Exp. CF2CSW1 (C F = 0: 6).

Modeled velocity profiles of Thwaites Glacier after 10, 50, 100, 150 and 200 years for (a) Exp. CW (labeled) and (b) Exp. VW3 (from left to right). The velocity profile of (a) is truncated at 5000 m a–1 to allow comparison with (b).
In Exp. CW, the grounding line quickly retreats inland (Fig. 4a) and the ice-shelf velocities after 50 years reach >10 000 m a–1 (Fig. 5a is truncated at 5000 m a–1 to allow comparison with Fig. 5b), comparable with the maximum observed velocities of Jakobshavn Isbræ, Greenland (Reference Joughin, Abdalati and FahnestockJoughin and others, 2004, 2010b). The grounding line is located on an overall retrograde bed slope, accelerating the glacier retreat, and reaches a position 153 km from the ice divide after 200 years. This corresponds to a mean retreat rate of ˜1.5 km a–1, higher than that observed (1 km a–1; Reference Tinto and BellTinto and Bell, 2011). We let the model run longer for this experiment and found that the glacier shrinks after 370 years. A contact between the ice shelf and a bedrock rise 550 km from the divide is established after 60 years, which slows the retreat for 100 years (Fig. 6). Once the grounding line passes the bedrock rise at x = 220 km (160 years), the retreat accelerates. This experiment should be considered as an end-member case, since buttressing and width variations are not included. An increase in back-stress provided by the ice shelf would slow down the grounding-line retreat (Reference DrouetDrouet and others, 2013). A change in the width gradient from the ice divide to the calving front would also provide a slower retreat. Mathematically, the latter corresponds to a reduction of all the width terms in the discrete form of the continuity equation (Eqn (9)), reducing the ice flux at the grounding line.
(a) Thwaites grounding-line position as a function of time for the width experiments. (b) Bedrock depth and VW3 width.
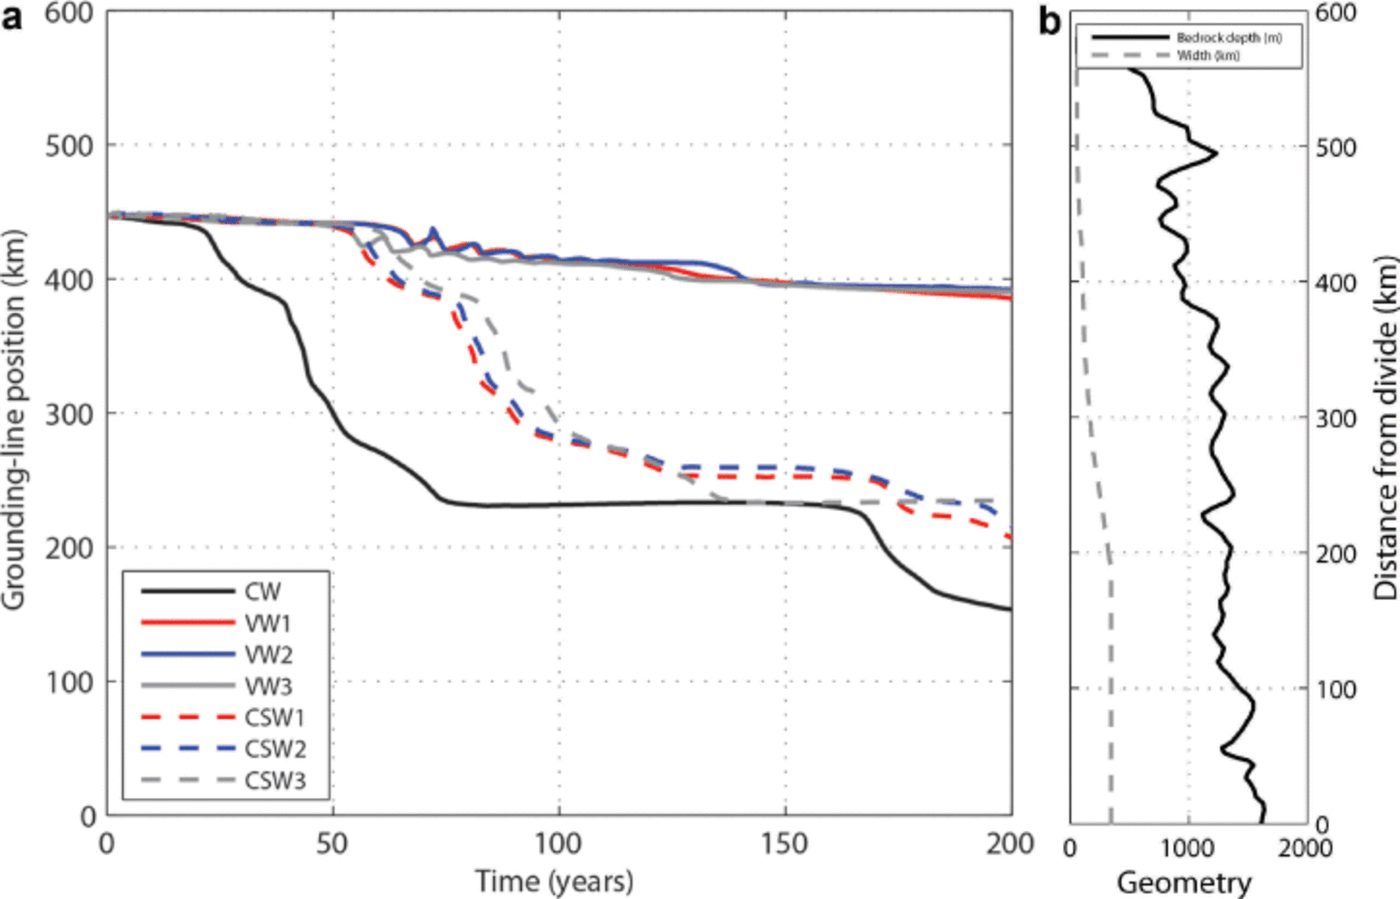
Using a spatially variable glacier width in the continuity equation (Exps. VW1–VW3) slows the retreat and stabilizes the glacier at a grounding-line position of x g ≈ 390 km from the ice divide after 200 years, as can be seen for Exp. VW3 in Figures 4b and 5b. The mean width rises from Exp. VW1 to VW3 (Fig. 3a), but no noticeable difference in grounding-line migration is perceived between the three experiments, due to the contact created between the ice shelf and the bedrock rise at x = 450 km after 70 years (Fig. 6). The variable glacier width of these experiments takes into account the flow coming from TG tributaries (flow convergence and divergence). While the grounding line retreats, the ice-shelf width close to the grounding line increases, thereby increasing the width spatial gradient, ∂ ω/∂x. Therefore, the ice shelf gets thicker and makes contact with a pinning point, which slows the retreat and stabilizes the grounding line. Reference JamiesonJamieson and others, (2012) found that the grounding-line retreat of Marguerite Bay Ice Stream (MBIS) since the Last Glacial Maximum was interrupted by stabilizations in narrow ice-stream regions caused by both enhanced lateral drag and the mass-conservation principle explained above (ice-sheet thickening), even if the bedrock slope was favorable for unstable behavior. However, MBIS has an average width of ˜30 km (with narrow regions of 20 km), while we use a width of 50 km at the calving front increasing up to ˜300 km close to the divide in Exp. VW3. Therefore, lateral drag is more important in the work of Reference JamiesonJamieson and others, (2012) than in our study.
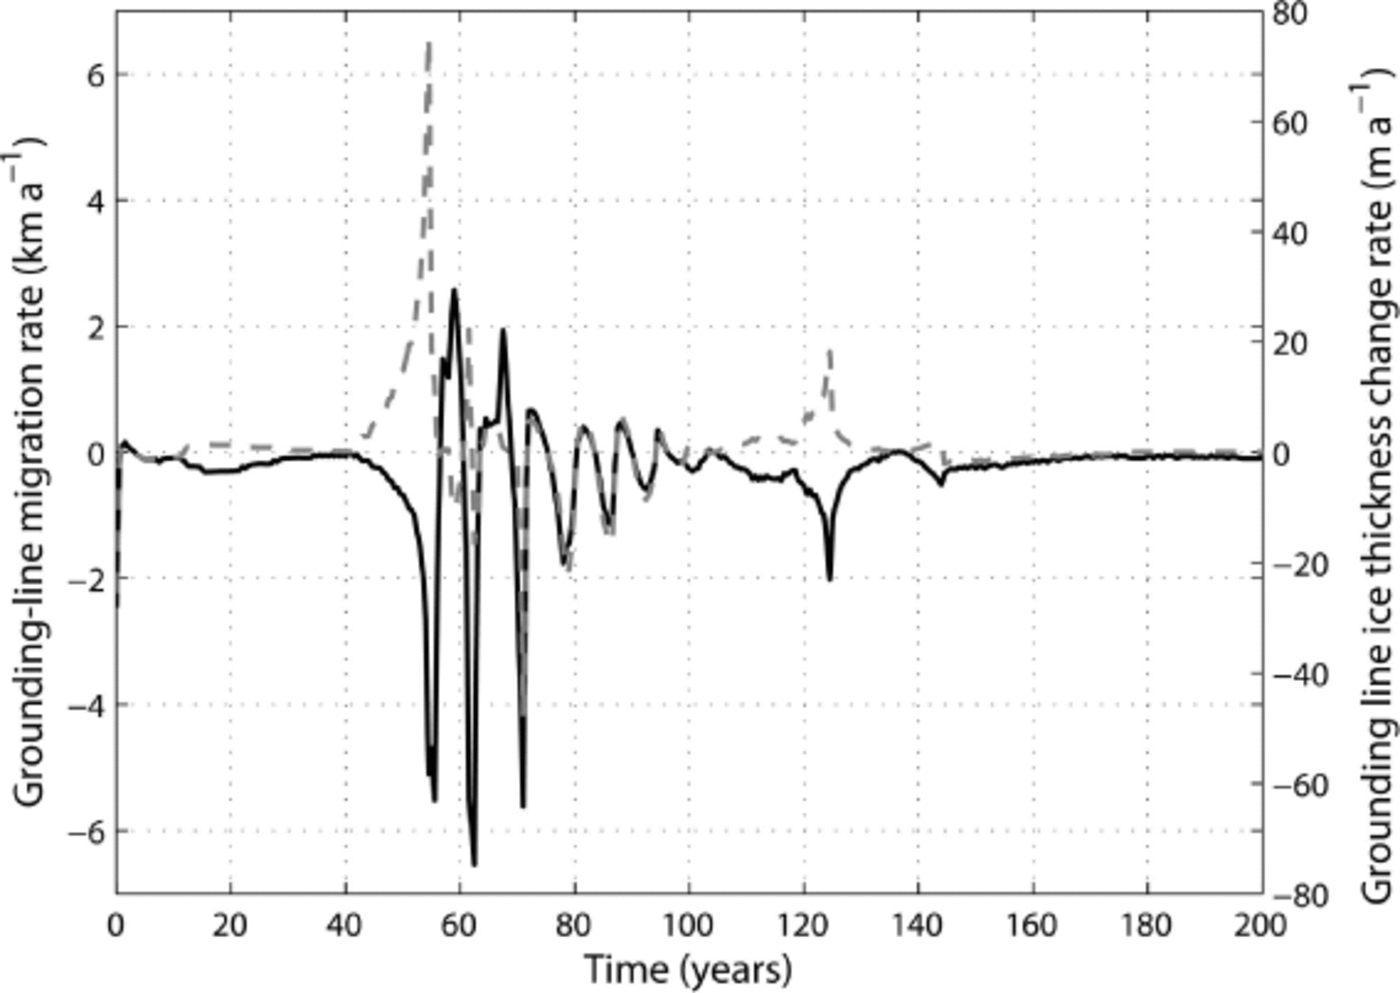
In those same experiments (Exps. VW1–VW3), the mean grounding-line retreat rate (0.3 km a–1) is lower than the observed 1 km a–1 (Reference Tinto and BellTinto and Bell, 2011) and the grounding-line thinning rate is comparable with the observations (Reference Shepherd, Wingham, Wallis, Giles, Laxon and SundalShepherd and others, 2010; Reference Pritchard, Ligtenberg, Fricker, Vaughan, Van den Broeke and PadmanPritchard and others, 2012) in the very first years of the simulation, i.e. during the relaxation phase (Fig. 7). Those rates substantially increase and vary in time afterwards, due to the position of the grounding line on a retrograde bed slope. Moreover, the grounding line can slightly readvance (positive migration rates) during the overall retreat process because of the contact between the ice shelf and a pinning point (e.g. between 55 and 60 years) (Fig. 7).
Grounding-line migration rate (solid black curve) and ice-thickness change rate (dashed gray curve) corresponding to Exp. VW3
In the experiments where the ice-shelf width is kept constant (Exps. CSW1–CSW3), the grounding line retreats much faster than in the experiments with spatially variable width (Exps. VW1–VW3) and reaches a position of x g ≈ 220 km in 200 years, but this retreat is slower than the constant-width experiment (Exp. CW), as shown in Figures 4c and 6. Some stages of slowing down are identified in those three experiments (˜60–80 and 100–200 years) and are linked to the grounding line positioned on a bedrock high (Fig. 6), confirming a finding of Reference ParizekParizek and others, (2013) for TG. A wider ice shelf (ωCSW1 > ω CSW2 > ω CSW3) gives a slightly more retreated grounding-line position (Fig. 6). Increasing the width in the ice shelf means that the width spatial gradient between the ice sheet and the ice shelf decreases, providing higher flux and less stabilization. The mean grounding-line retreat rate of those experiments is 1.1–1.2 km a–1, closer to the observations than Exps. CW and VW1–VW3. However, this parallel-sided case is not necessarily more realistic than Exps. VW1–VW3; as the grounding line retreats, there are prominent highs on either side of the domain that act as pinning points for the new ice shelf, and this is not captured by the model. Therefore, causing the grounding line to retreat with a parallel-sided ice shelf overestimates the vulnerability of TG.
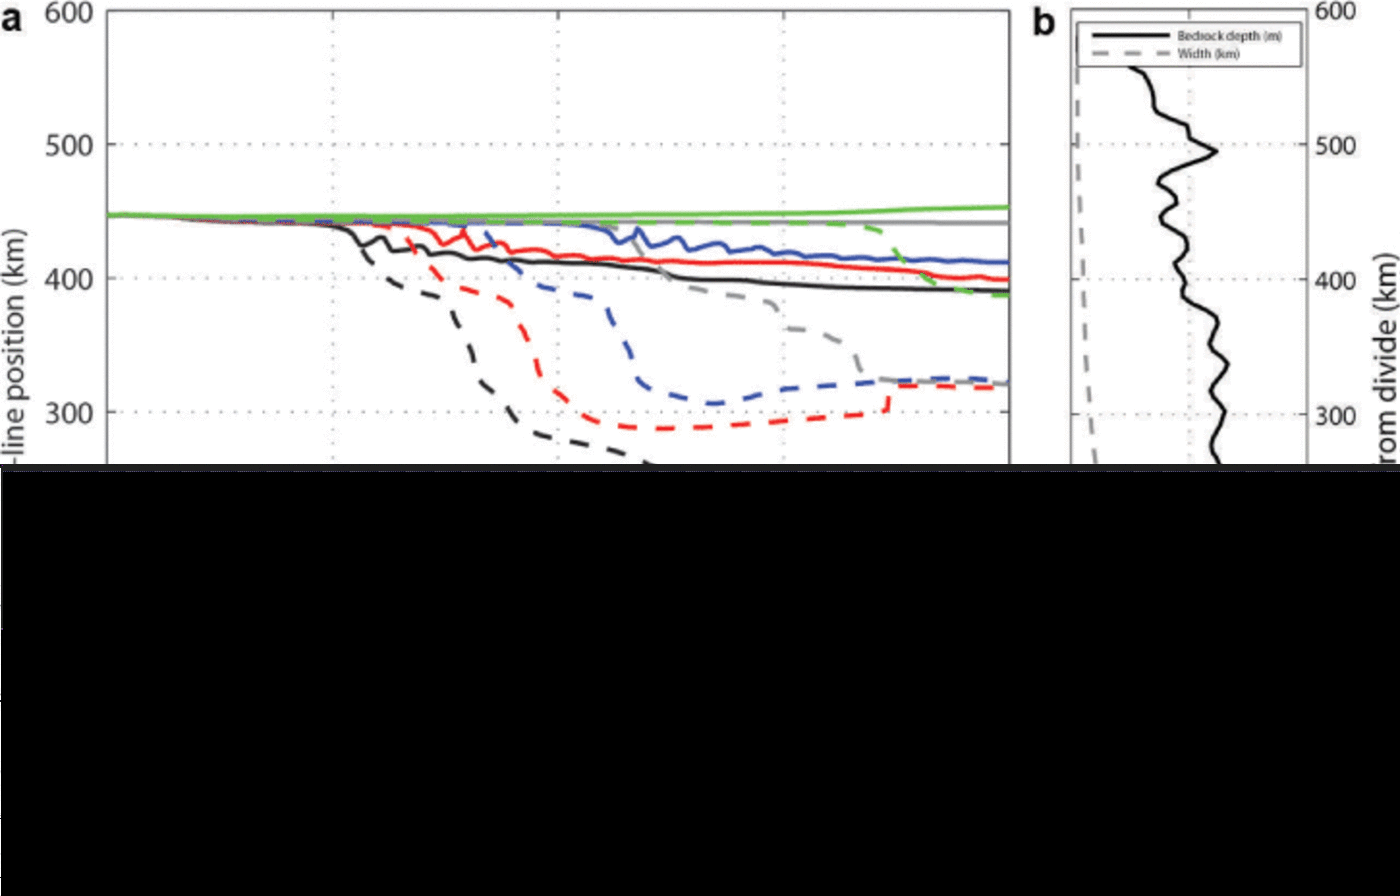
Applying buttressing (experiments starting with ‘CF’) also reduces the grounding-line retreat compared to Exp. CW (Figs 4d and 8). This can be compared with the results previously obtained by Reference DrouetDrouet and others, (2013). As a matter of fact, an increase of buttressing effect (through a decrease in C F) lowers ice flux at the grounding line and therefore provides a slightly more advanced grounding-line position. Furthermore, combining the buttressing increases with VW3 parameterization (variable width) leads to less grounding-line retreat than with CSW1 parameterization (constant shelf width; Fig. 8). An extreme case (CF4VW3;i.e. C F = 0: 2) shows a final grounding-line position some kilometers downstream from the observed one. As for the CSW1–CSW3 experiments, bedrock highs tend to stabilize the grounding-line position for some years (Fig. 8).
(a) Thwaites grounding-line position as a function of time for the buttressing experiments. (b) Bedrock depth and VW3 width.
Using Bedmap2 for the bed (with CSW1 width profile and C F = 1) provides a final grounding-line position of x g ≈ 440 km (after 200 years), i.e. on a bedrock high very close to the initial position. This behavior is completely different from Exp. CSW1, which uses the same parameters but not the same bedrock elevation, and is in agreement with the results of Reference ParizekParizek and others, (2013). Neither Bedmap2 nor Reference ParizekParizek and others, (2013) include the Reference Tinto and BellTinto and Bell, (2011) bathymetric model, wich may explain why the grounding line does not retreat as much. Indeed, the slightly different bedrock geometry in the vicinity of the grounding line between both datasets plays a non-negligible role in the behavior of TG. The initial grounding line is located on a small sill in our dataset, but 5 km downstream of this sill in Bedmap2 (Fig. 2).
The final grounding-line positions obtained for all the 16 experiments performed in this study are shown in Figure 9. Four experiments (CW and CSW1–CSW3) lead to a grounding-line retreat of >200 km in 200 years (i.e. mean retreat rate of ≥ 1 km a–1). All simulations show a retreat of the grounding line, except those with high ice-shelf buttressing combined with a non-constant shelf width (CF3VW3 and CF4VW3) and the one including Bedmap2 data. Almost all simulations lead to a contact between the ice shelf and a pinning point. The location of these pinning points is indicated through the color code in Figure 9.
Observed ice-sheet/ice-shelf geometry of Thwaites Glacier along with a frequency histogram of model simulations binned by final grounding-line position (within a range of 20 km). Blue bars show frequency of ‘non-pinned shelf’ simulations, while other colors show frequency of ‘pinned shelf’ simulations, i.e. simulations with an ice shelf in contact with a pinning point (PP) at the end of the simulation (as Reference GladstoneGladstone and others, 2012). The different colors indicate where the ice shelf makes first contact with a PP (cyan: PP location ˜380 km from the divide; yellow: PP location ˜450 km; dark red: PP location ˜555 km).

Conclusions and Outlook
We computed the short timescale response of TG (200 years) with an SSA flowline ice-stream/ice-shelf model and all the available input data (geometry, ice velocity, basal shear stress, ice temperature, sub-ice-shelf melt rate, accumulation rate). All simulations show a retreat of the grounding line with some stages of slowing down, except two simulations where high ice-shelf buttressing combined with a variable ice-shelf width and the simulation using Bedmap2 data. We identify that the retreat is greatly slowed when the effect of flow convergence is included, i.e. using a variable glacier width in the continuity equation. Therefore, the unstable nature of the bedrock in this region (TG has an overall upward-sloping bedrock) is reduced when taking into account the flow coming from the glacier tributaries. An appropriate flowline modeling study should include glacier width, in order to provide reasonable evolution of glacier geometry and grounding-line retreat.
The way the width is parameterized produces different results in terms of grounding-line migration and ice velocity. A convergence in the ice shelf decreases the ice flux and tends to stabilize the grounding line, while a constant ice-shelf width leads to speed up and grounding-line retreat. Moreover, the parameterization of buttressing also affects the grounding-line position. Our experiments show that if we do not take buttressing into account, this can lead to a drastic grounding-line retreat (300 km in 200 years in the constant-width experiment).
These experiments were performed using a flowline model, which considerably reduces the computation time compared with a 3-D model. However, buttressing and width parameterizations used here should be compared with a 3-D model that includes these effects. In this study, we also assume that an SSA model works well for TG as it is a fast-flowing glacier. However, there may be a contribution from vertical shear that could slow down the ice flow. SSA models only include membrane stresses and are faster in their response than models including both membrane stresses and vertical shearing (Reference PattynPattyn and others, 2013).
Acknowledgements
This work was supported by both the IceCube-Dyn project (Actions de recherche concertées) funded by the French Community of Belgium and the ice2sea project funded by the European Commission’s 7th Framework Programme through grant 226375 (ice2sea manuscript No. 159). We thank B.R. Parizek, A.M. Le Brocq, K.J. Tinto and I. Joughin for constructive comments and for the provision of data. We also acknowledge helpful clarifications and comments from two anonymous reviewers, and the Scientific Editor H.A. Fricker.


