


Introduction
The amount of patients with cognitive decline and thus, the risk to develop dementia continues to rise as the population ages [Reference Satizabal, Beiser and Seshadri1]. Neuropsychiatric symptoms (NPS) can be defined as behavioral noncognitive disturbances such as depression or agitation and are extremely common in dementia appearing in up to 98% of patients at one point during the disease [Reference Phan, Osae, Morgan, Inyang and Fagan2]. It has been argued that NPS can appear relatively early even prior to dementia diagnosis, representing eventually an opportunity window for timely detection and treatment [Reference Gallagher, Fischer and Iaboni3]. Since pathological changes seem to occur in the brain often before the onset of clinical dementia, the damages due to neurodegeneration may alter in a subtle manner emotion regulation and behavior as cognition starts to decline [Reference Iaboni and Rapoport4]. This suggests that underlying neurobiological mechanisms might underpin the appearance of these symptoms [Reference Livingston, Sommerlad, Orgeta, Costafreda, Huntley and Ames5] contributing to an increased vulnerability and risk for conversion [Reference Liew6].
NPS can cause a great burden for patients and caregivers affecting severely disease course and quality of life [Reference Radue, Walaszek and Asthana7]. Interestingly, even in cognitively normal subjects it has been reported that certain types of NPS may represent promising prognostic factors for predicting cognitive deterioration, especially the affective ones such as depression, apathy, and anxiety [Reference Hu, Shu, Wu, Chen, Hu and Zhang8–Reference Jang, Ho, Blanken, Dutt and Nation10]. Anxiety seems to be an important predictor of amyloid pathology. The presence of apathy may increase the risk of conversion from mild cognitive impairment (MCI) to dementia [Reference Padala, Padala, Lensing, Jackson, Hunter and Parkes11] and a similar association is found with depression [Reference Goukasian, Hwang, Romero, Grotts, Do, Groh, Bateman and Apostolova12]. Differential utilities of NPS for even predicting dementia subtypes are currently intensively investigated [Reference Liew6] since it could lead to earlier tailored treatment.
Despite the immense clinical impact of NPS, these clinical dimensions remain insufficiently identified and therefore untreated. Evaluation and management of NPS remains challenging since its detection is not made systematically in current clinical practice in patients with cognitive decline [Reference Gitlin, Marx, Stanley, Hansen and Van Haitsma9], and these are often assessed only when family members bring their observation to the attention of health care professionals. However, there is evidence that if early treatment is provided, namely in the form of nonpharmacological intervention, it can be effective to reduce the severity of NPS [Reference Radue, Walaszek and Asthana7], and even to slow down cognitive decline [Reference Padala, Padala, Lensing, Jackson, Hunter and Parkes11].
Current assessment methods rely mostly on clinical scales such as the neuropsychiatric inventory (NPI) [Reference Goukasian, Hwang, Romero, Grotts, Do, Groh, Bateman and Apostolova13], which in turn depends heavily on the informants’ objective reporting ability [Reference Cummings, Mega, Gray, Rosenberg-Thompson, Carusi and Gornbein14]. The clinician rating may be influenced as well by caregivers’ personal experiences, and by limited access to reliable information. This is why clinicians and researchers are looking for ways to complement classical assessment scales with more objective indexes, which are able to detect subtle variations in the presentation of NPS as well as its different subtypes [Reference Stella15, Reference König, Aalten, Verhey, Bensadoun, Petit and Robert16].
Mobile technologies may be a promising solution for detecting and monitoring objectively fine-grained changes in behavior and thus, the appearance of NPS in a continuous manner [Reference Gros, Bensamoun, Manera, Fabre, Zacconi-Cauvin and Thummler17]. The use of digital biomarkers which are measures of behavioral data collected by means of digital devices are increasingly studied in patients with cognitive decline as a potential alternative assessment approach [Reference Kourtis, Regele, Wright and Jones18]. One promising avenue lies in recent advances in computational linguistics and language processing that have led to the use of automatic speech analysis in the assessment of various clinical manifestations [Reference Piau, Wild, Mattek and Kaye19, Reference Albuquerque, Valente, Teixeira, Figueiredo, Sa-Couto and Oliveira20] making it potentially useful for assessing different NPS.
Until now, it has been clearly demonstrated that changes in speech and language patterns can be indicative for cognitive decline due to neuropathological processes. Different affective states including depression, anxiety, and apathy alter as well mechanisms involved in speech production, namely variations in muscle tension and tonality which can affect prosody and the quality of speech. Reduced or increased muscle tension will influence vocal tract dynamics as well as articulation behavior [Reference Robin, Harrison, Kaufman, Rudzicz, Simpson and Yancheva21] which may be today with recent advances in speech analysis technologies be easily detectable.
In depression, which is characterized by persistent sadness and anhedonia, accompanied by disturbed sleep/appetite, fatigue, and even suicidal ideation, it is notable by ear that patients show a reduced speech rate and prosody spectrum and sound rather monotonous which could serve as markers, if objective measurements can quantify these observations [Reference Cummins, Scherer, Krajewski, Schnieder, Epps and Quatieri22]. Until now, several groups investigated the use of automatic analysis of speech as an additional assessment tool with an extensive review published by Cummins et al. [Reference Robin, Harrison, Kaufman, Rudzicz, Simpson and Yancheva21] outlining the interest of using speech as a key objective marker for disease progression.
Prosodic, articulatory, and acoustic features of speech seem affected by depression severity and thus can easily be identified and used for continuously monitoring patients. With a considerable overlap of symptoms between depression and apathy, namely the lack of interest and goal-oriented behavior, we anticipate similar results when applying speech technology methods to apathy with a slightly different pattern in regards to emotionally triggered speech.
In anxiety, which is characterized by excessive fear or worrying, many studies found a significant increase in mean fundamental frequency (f0) [Reference Lanctot, Amatniek, Ancoli-Israel, Arnold, Ballard and Cohen-Mansfield23]. Jitter and shimmer were also significantly higher in anxious patients [Reference Low, Bentley and Ghosh24, Reference Özseven, Düğenci, Doruk and Kahraman25]. In a previous study, we showed that certain speech characteristics extracted over the phone correlated with stress levels in both genders; mainly, spectral (i.e., formant) features, such as the mel-frequency cepstral coefficient (MFCC), and prosodic characteristics, such as the fundamental frequency, appeared to be sensitive to stress [Reference Silber-Varod, Kreiner, Lovett, Levi-Belz and Amir26].
In apathy, which is characterized by lack of motivation, decreased initiative, and emotional indifference, we demonstrated that certain paralinguistic features, namely temporal aspects of speech as well as prosodic characteristics correlate significantly with levels of symptom severity [Reference König, Riviere, Linz, Lindsay, Elbaum and Fabre27].
Hence, given the increasingly important role of NPS in early dementia diagnosis [Reference König, Linz, Zeghari, Klinge, Tröger and Alexandersson28], it seems worthwhile investigating the additional value of this method further for differential diagnosis of these most frequently found NPI symptoms. Therefore, the purpose of this study is to determine whether automatic speech analysis and the automatic extraction of speech features can be useful for the early detection of specific NPS—namely depression, apathy, and anxiety—in patients with mild neurocognitive disorders.
Materials and Methods
Participants
All participants were recruited through the Memory Clinic located at the Institut Claude Pompidou in the Nice University Hospital. A total of 141 patients aged 65 or older with mild neurocognitive disorder according to the Diagnostic Statistical Manual 5 (DSM-5) [Reference Cummings, Ritter and Rothenberg29] were included in this study. For this, the presence of cognitive decline in memory and/or executive function with or without interference with performance in activity of daily living was required based on previously performed evaluations. Patients coming to the Memory clinic underwent a clinical assessment including, among others, the Mini-Mental State Examination (MMSE) [30] and the NPI interview [Reference Goukasian, Hwang, Romero, Grotts, Do, Groh, Bateman and Apostolova13].
Study procedure
Speech features vary naturally between males and females. These differences have been leveraged in gender classification through speech analysis based on pitch and formant frequencies [Reference Folstein, Folstein and McHugh31], Harmonic to Noise ratio [Reference Childers and Wu32], and linear predictive components and MFCC [Reference Heffernan33]. Previous work found differences in speech depending on gender in the effects of apathy [Reference Wu and Childers34], as well as depression and the effectiveness of classifiers for its detection [Reference Linz, Klinge, Troger, Alexandersson, Zeghari and Robert35]. This is why this study considers males and females separately resulting in two experimental groups consisting of 92 females and 49 males.
Participants were all native speakers of French and excluded if they had any major auditory or language problems, history of head trauma, loss of consciousness, psychotic or aberrant motor behavior, or history of drug abuse. Written informed consent was obtained from all subjects prior to the experiments. The study was approved by the Nice Ethics Committee (ELEMENT ID RCB 2017-A01896-45, MoTap ID RCB 2017-A01366–47) and was conducted according to the Declaration of Helsinki.
Speech task (positive and negative story)
Free and natural speech tasks are capable of eliciting emotional reactions (or a lack thereof) by asking to describe events that triggered recent affective arousal. Affective arousal is expected to impact speech in NPS since simple vocal exercises or reading tasks do not allow to capture the acoustic effects of alterations in affective states [Reference Robin, Harrison, Kaufman, Rudzicz, Simpson and Yancheva21]. Using emotional induced free speech tasks allows for a greater range of emotional effects such as describing events that have aroused significant emotions [Reference Low, Maddage, Lech, Sheeber and Allen36]. Therefore, the participants were asked to: (a) talk about a positive event in their life and (b) to talk about a negative event in their life. Instructions for the speech tasks (“Can you tell me in one minute about a positive/negative event in your life?”) were prerecorded by one of the psychologists and played from a tablet computer ensuring standardized instruction over both experiments. The answers were recorded with the tablet’s internal microphone.
Processing of speech data
Audio features were extracted directly and automatically from the speech signal. This form of speech analysis does not consider the semantic content of what a participant said, thus increasing the applicability of results in a clinical scenario, as no prior processing, such as transcription of what has been said, is required. For each speech task (positive and negative story), features were extracted separately from different main areas: temporal features including measures of speech proportion (e.g., length of pauses and length of speaking segments), the connectivity of speech segments and general speaking rate; prosodic, relating to long-time variations in perceived stress and rhythm in speech. Prosodic features also measure alterations in personal speaking style (e.g., perceived pitch and intonation of speech); formant features represent the dominant components of the speech spectrum and carry information about the acoustic resonance of the vocal tract and its use. These markers are often indicative of problems with articulatory coordination in speech motor control disorders (ref Sapir); source features relate to the source of voice production, the airflow through the glottal speech production system. Spectral features characterize the speech spectrum; the frequency distribution of the speech signal at a specific time instance information in some high dimensional representation. These features operationalize irregularities in vocal fold movement (e.g., measures of voice quality). An overview and explanation of the extracted speech features can be found in Table 1.
Overview and explanation of extracted speech features.
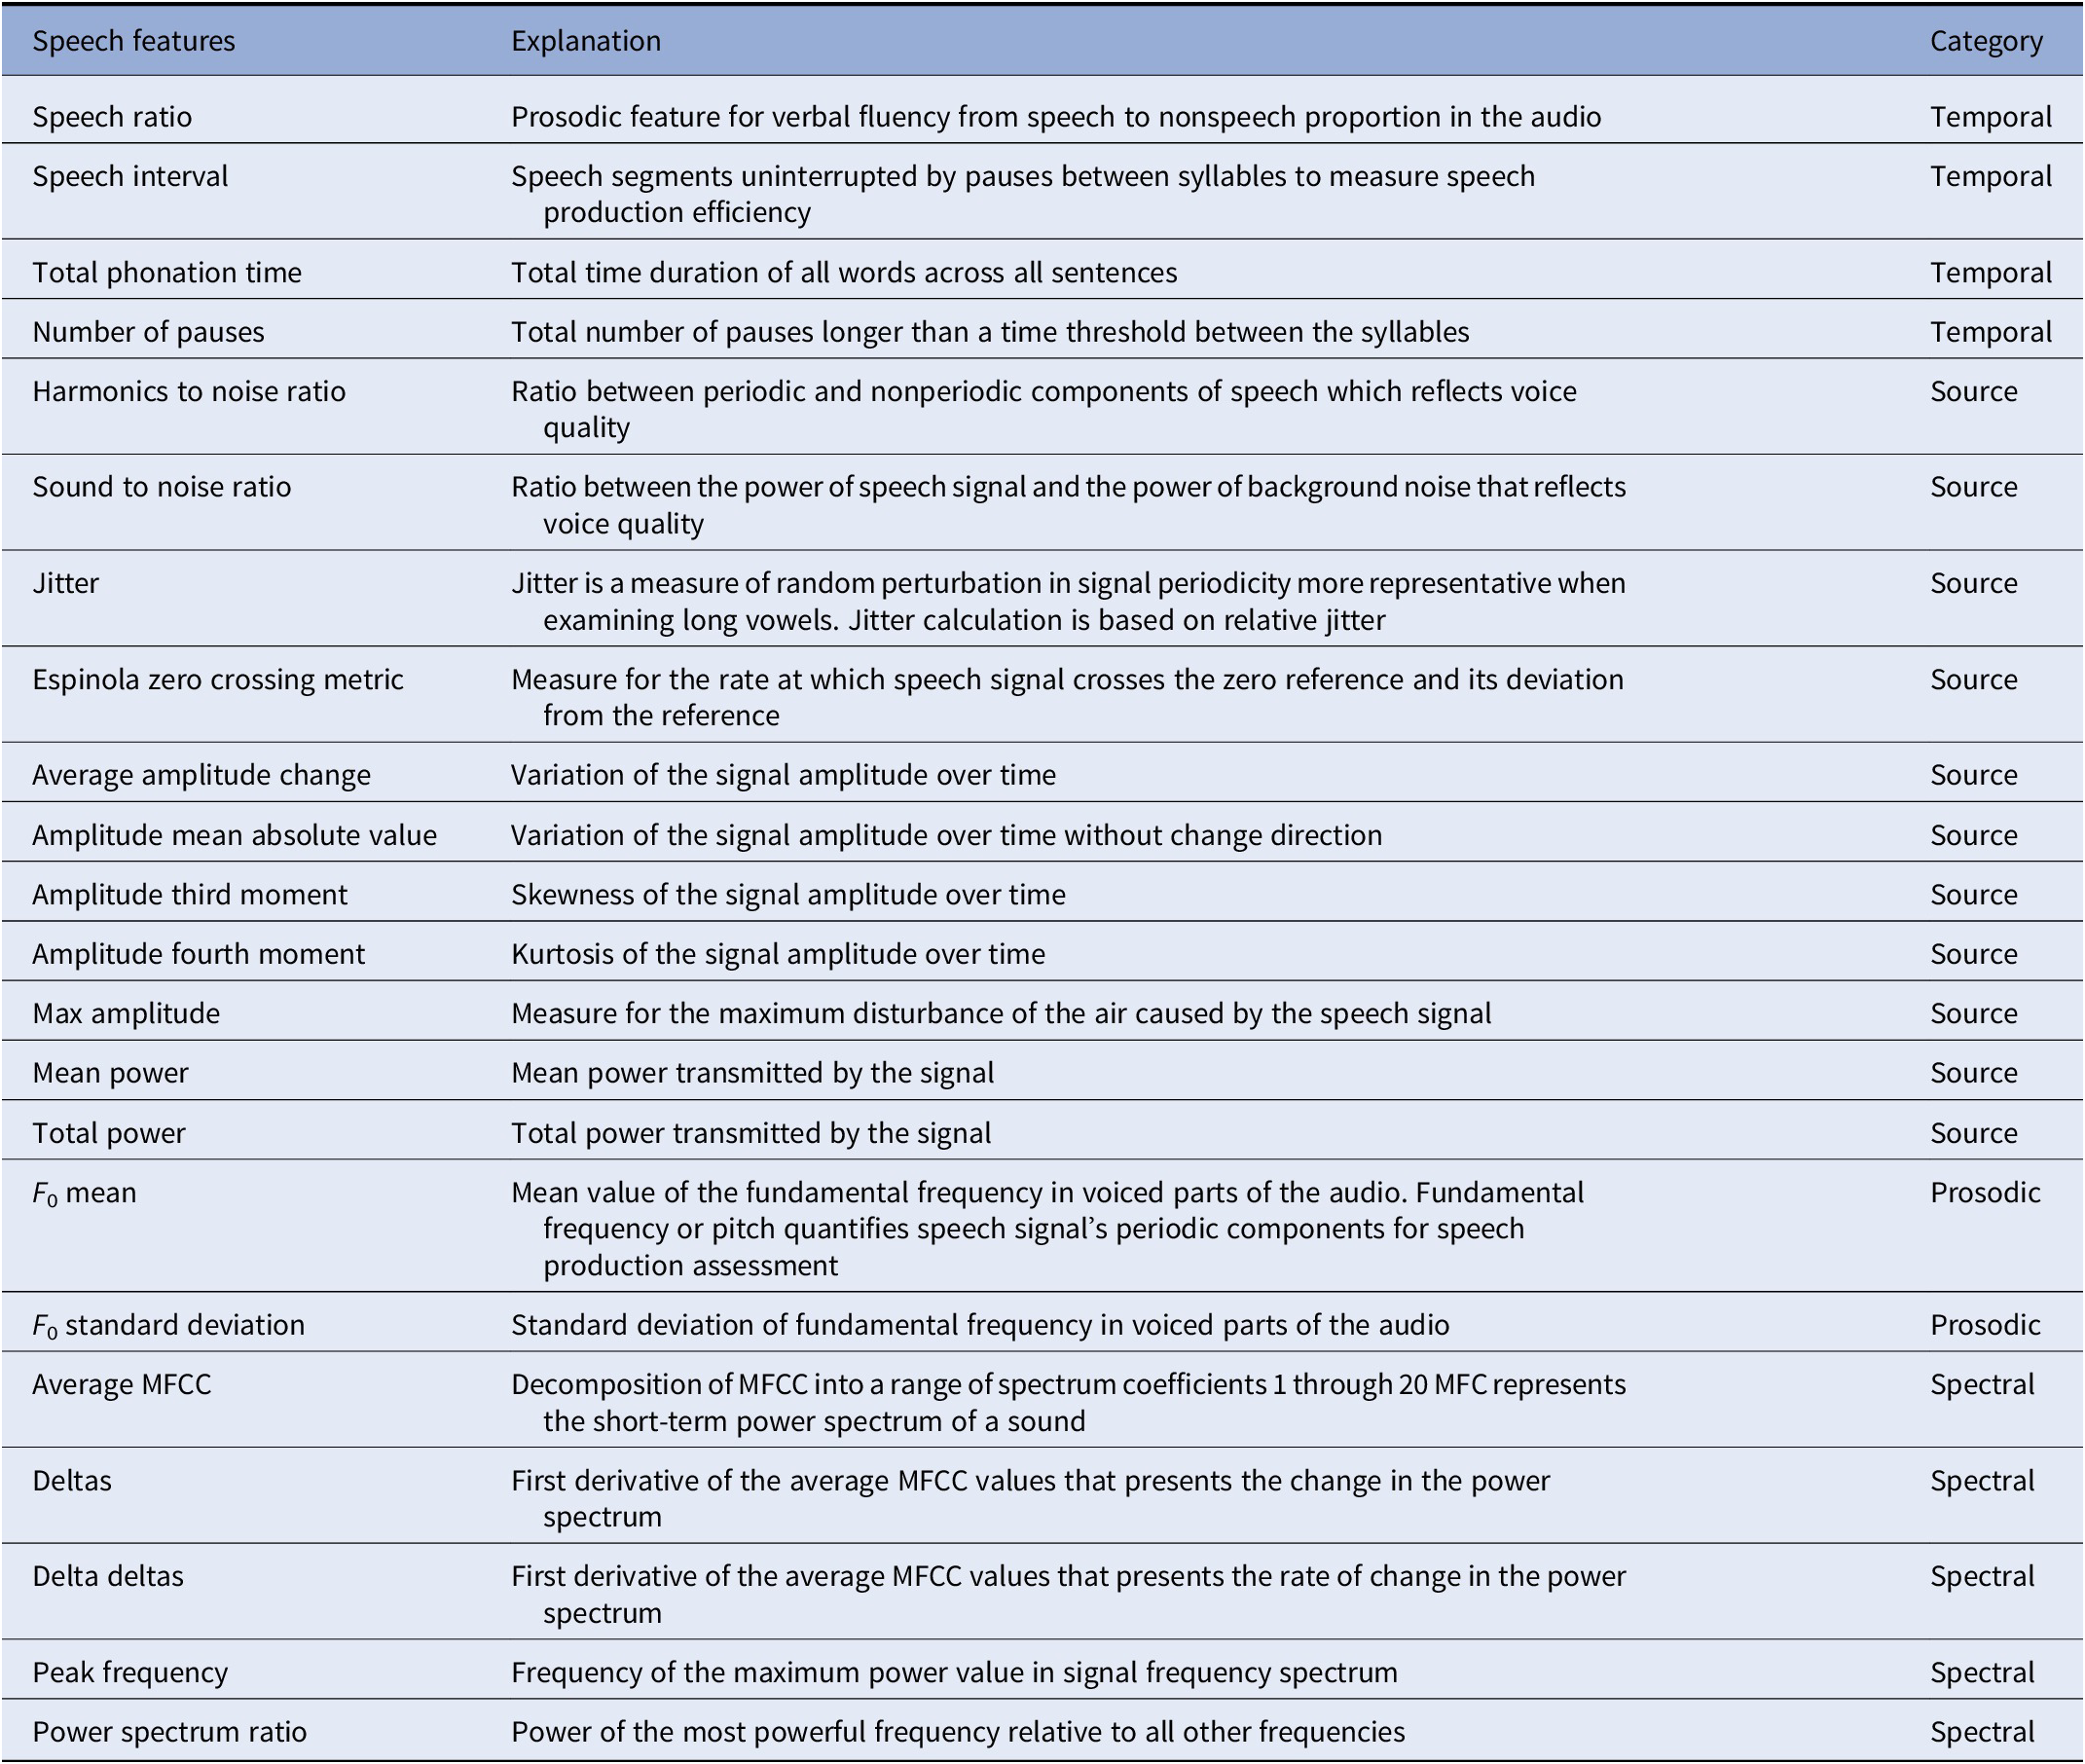
Abbreviation: MFCC, mel-frequency cepstral coefficient.
Statistical analysis
Statistical analysis was run using R software (software version 3.4.02). QQ-plots as well as Shapiro–Wilk tests indicated a violation of the normal distribution for the depression scores. Therefore, we used Spearman rank correlations to test whether speech as well as transcript data was correlated with NPI scores (only for the items apathy, depression, and anxiety). We applied the Benjamini–Hochberg procedure for each of the feature categories when correcting for multiple comparisons. Three variable groups were excluded from this analysis. MFCCs, Delta, and Delta Delta values were not considered in group comparisons, as they do not have directly human understandable explanations and would therefore provide little insight. These variables were included in the machine learning experiments, as explainability is not required.
To predict NPI scores, we train different regression models and evaluate their performance using MAE. Regression models are trained including support vector regression (SVR) and Lasso (Linear Regression with L1 regularization). Implementations were provided by the scikit-learn python framework. Features were normalized by subtraction of their mean and division through their standard deviation. Because of the small data set size a separate validation/test set could not be used. Instead, Leave-One-Out-Cross-Validation was employed. This is a method where N different models are evaluated: train a model on N − 1 observations and test it on one observation. The model is evaluated for every held-out observation. The final result is then calculated by taking the mean of all the individual evaluations.
Results
A total of 141 participants, of which 92 were female and 49 were male, have been included in the analysis. Demographic and clinical information split by gender is available in Table 2. Both groups had an average age around 75 and showed on average some signs of MCI, with a mean MMSE of around 24. The male group scored significantly higher on the apathy domain of the NPI. Correlations between the NPI subscales and the MMSE showed significant correlations for both groups (see Table 3). MMSE was significantly correlated with the NPI apathy subscale for both groups, while only females also showed significant correlations between the anxiety subscale and the MMSE. Both normal and partial correlations, corrected for MMSE, of speech variables and NPI subscales by gender group and speech task are displayed in Figure 1 (a detailed listing of correlations is provided in Supplementary Tables S1 and S2).
Demographic data for included participants, split by gender.
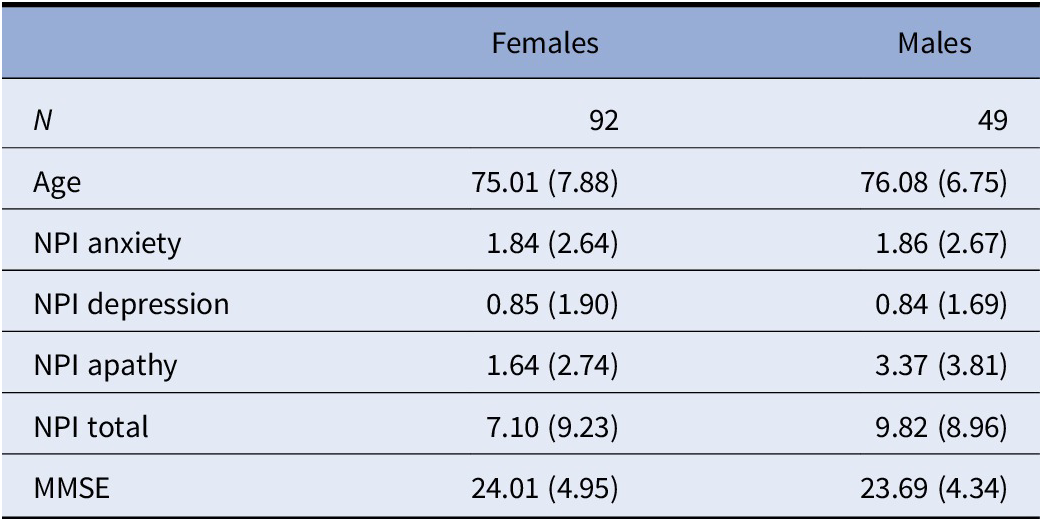
Note: Mean and standard deviation are reported.
Abbreviations: MMSE, Mini-Mental State Examination; NPI, neuropsychiatric inventory.
Spearman rank correlations between MMSE and NPI subscales for females and males.
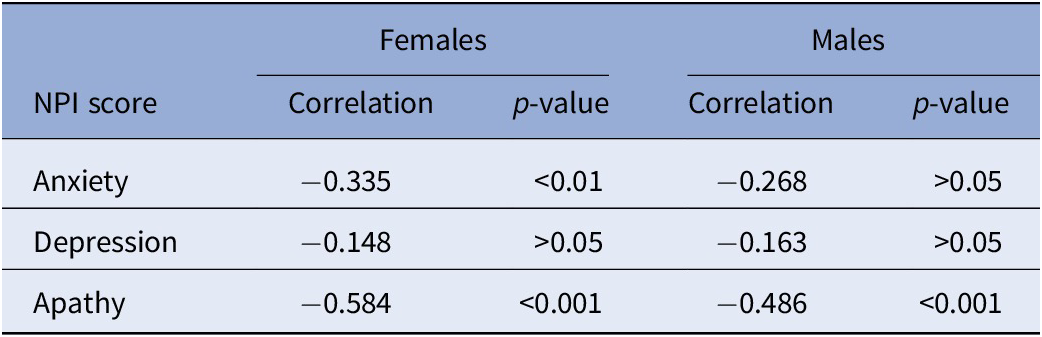
Abbreviations: MMSE, Mini-Mental State Examination; NPI, neuropsychiatric inventory.
Plot between (left) Spearman rank correlations and (right) spearman rank partial correlations corrected for Mini-Mental State Examination (MMSE), between audio features and neuropsychiatric inventory (NPI) subscales, separated by gender and voice task. Only significant correlations are reported. Absolute value of correlation is reflected in the size and color (positive correlations in blue; negative correlations in red) of the dot.
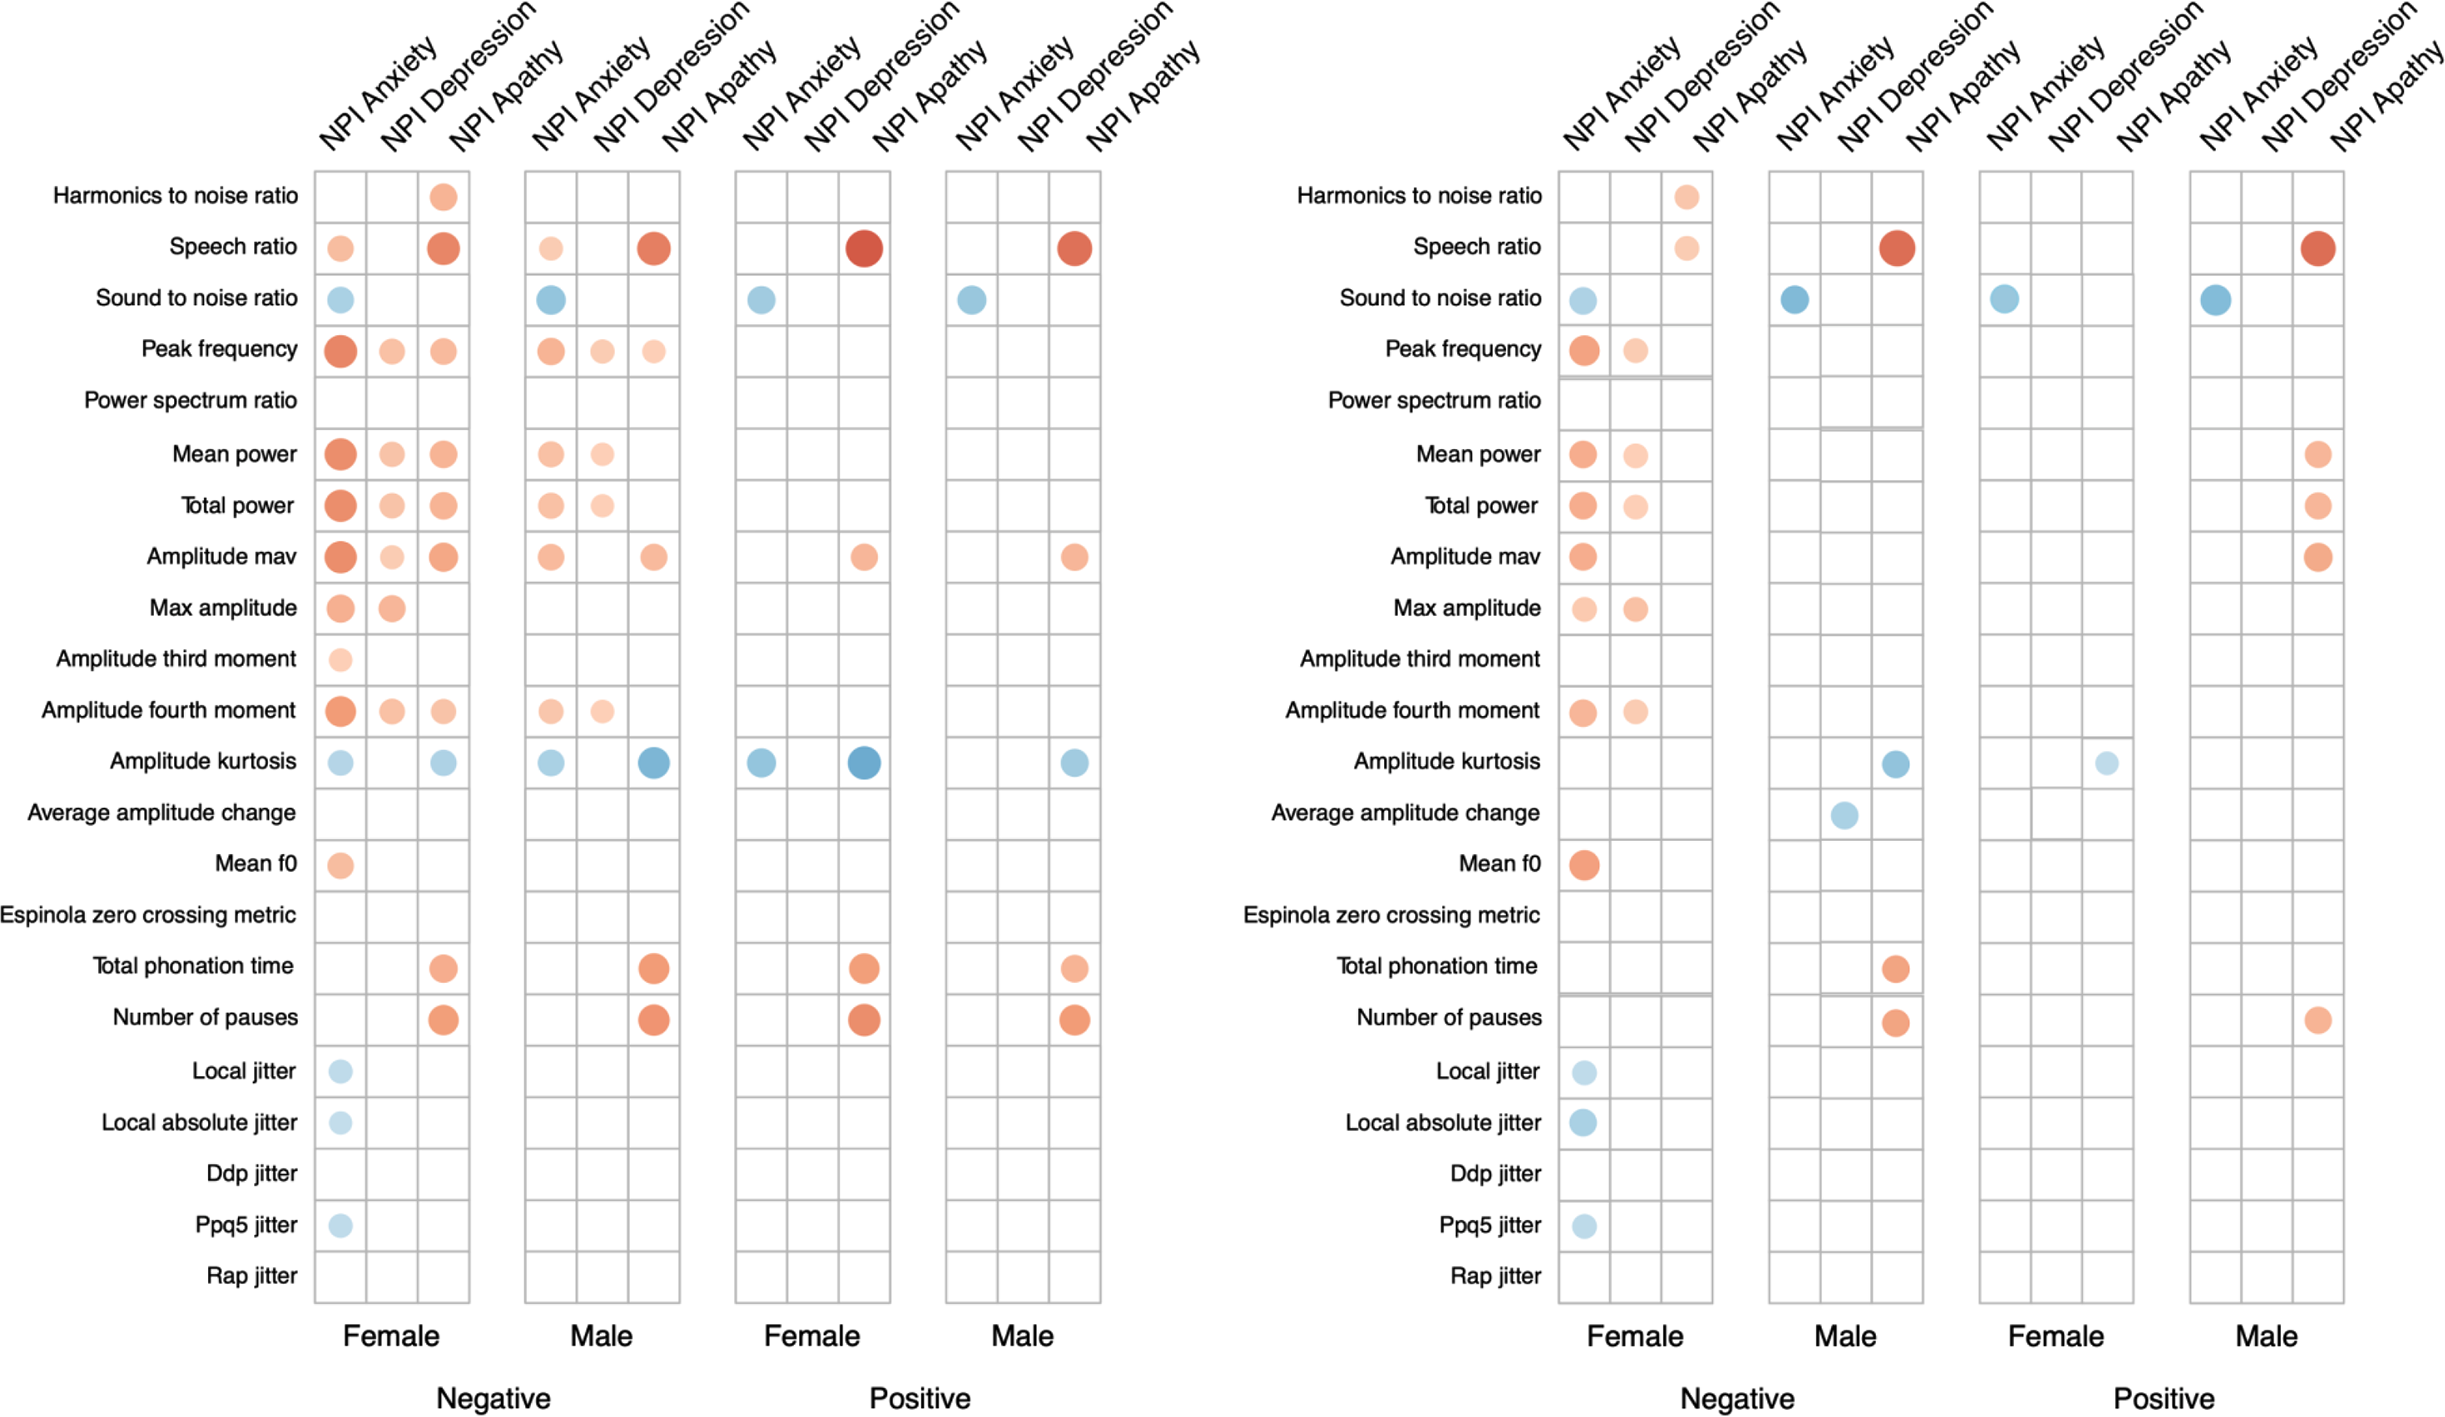
The Sound to noise ratio shows significant correlations with the NPI anxiety subscale for both genders and tasks, suggesting that the higher the sound to noise ratio, the stronger symptoms of anxiety are present. This effect is stable after correcting for the influence of MMSE. Before and after correcting for MMSE, the Speech Ratio shows significant correlations with the NPI apathy subscale for both genders and across both tasks, indicating that less speaking during the recording is associated with higher levels of apathy. The same is visible for the Total Phonation Time and Number of Pauses, but effects are not sustained after correcting for MMSE using partial correlations. The Amplitude Kurtosis shows significant correlations with the anxiety and apathy NPI subscales, which are not retained in the partial correlation.
Correlations between all NPI scales and measures of power (Mean power and Total power) are visible for females in the negative story. When correcting for the influence of MMSE, only weaker correlations with the anxiety and depression subscales remain. Performance of trained machine learning models is listed in Table 4 as the MAE of predictions. The baseline for each subscale and gender is reported. For each subscale and gender, a model could be trained that outperforms this baseline by at least 0.3 points on the NPI scale. Features selected by the machine learning models are available in Supplementary Table S3.
Mean absolute error of regression methods (linear regression L1 penalization and SVM) and of the baseline, for males and females separately.
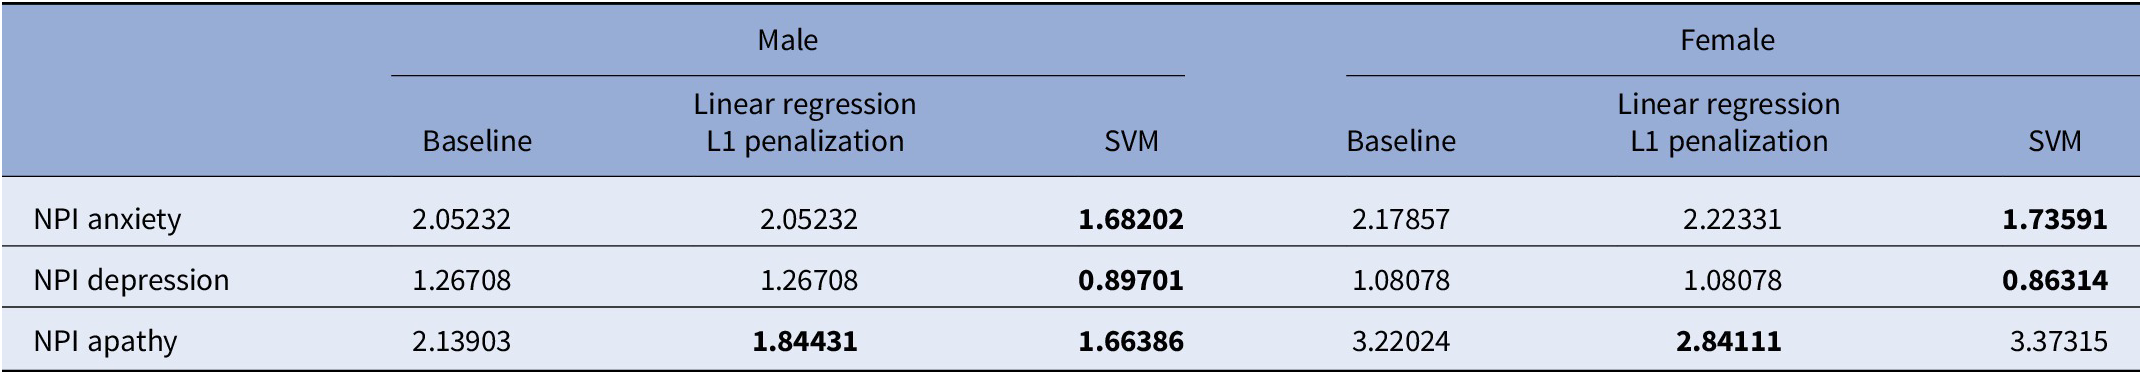
Note: Results better than baseline are marked in bold.
Abbreviation: NPI, neuropsychiatric inventory.
Discussion
Identifying early signs of different NPS by the means of objective measurement tools could ultimately lead to better management and treatment. This is particularly important in patients with mild neurocognitive disorders. Indeed, the assessment of NPS is not systematically performed in clinical practice, despite the fact that they represent risk factors for dementia conversion, and thus are increasingly becoming targets of clinical trials [Reference Gupta, Malandrakis, Xiao, Guha, Van Segbroeck and Black37, Reference Roberto, Portella, Marquié, Alegret, Hernández and Mauleón38]. As in the early stages of neurocognitive disorders NPS do not interfere substantially with activities of daily living, patients, and caregivers may not report them unless prompted, which suggests the need for noninvasive, objective, and reliable measures that can help detect subtle changes in NPS.
The results of the present study show that certain changes in spontaneous speech characteristics seem associated with specific NPS. Namely, apathy correlates with temporal aspects of speech such as speech ratio, which means that patients with more severe apathy, speak slower and less. This is consistent with the diagnostic criteria for apathy [Reference Robert, Lanctôt, Agüera-Ortiz, Aalten, Bremond and Defrancesco39], which identified reduction of self-initiated verbal production as one of the core apathy dimensions. Similarly, we found previously strong correlations between this type of features (sound duration, syllable count, etc.) and subdomains of the apathy inventory [Reference König, Riviere, Linz, Lindsay, Elbaum and Fabre27].
In turn, anxiety correlates with voice quality features such as Sound to noise ratio. These results are even mostly consistent between male and females. Importantly, these correlations between apathy and anxiety and the distinct speech variables were still significant after correcting for cognitive impairment, meaning that these specific speech features may be relevant for assessing NPS in patients with different degrees of cognitive deterioration, and do not capture simply cognitive decline. As the presence of NPS increases with cognitive decline progression [Reference König, Linz, Zeghari, Klinge, Tröger and Alexandersson28], it is important to control for the degree of cognitive decline to verify if speech features are relevant specifically to detect NPS. The fact that we did not find any strong correlation between speech features and depression might be due to the small variance on the depression NPI subscale in our sample.
Our findings are consistent with other research in which a significant increase in mean f0 (prosodic related feature) was detected in anxiety disorders [Reference Weeks, Lee, Reilly, Howell, France and Kowalsky40–Reference Weeks, Srivastav, Howell and Menatti42]; however, we found this effect only in females during the negative storytelling. In another study, in which emotional responses were induced by watching videos, females showed higher emotional expressivity for negative stimuli, whereas males showed overall more intense emotional experiences, meaning that the differences in gender seem to depend on the specific emotion type [Reference Weeks, Srivastav, Howell and Menatti43].
Moreover, greater F0 has been reported mostly in males with social anxiety disorder compared to controls and only in females during in vivo social exposure [Reference Galili, Amir and Gilboa-Schechtman42]. This could explain why we found a difference only in the negative task since it may elicit a more emotionally loaded reaction. Jitter and shimmer were also significantly higher in patients with an elevated score on the NPI anxiety subdomain, which is in line with previous studies [Reference Low, Bentley and Ghosh24, Reference Özseven, Düğenci, Doruk and Kahraman25].
Machine learning regressors were able to extract information from speech features and perform above baseline in predicting anxiety, apathy, and depression scores, despite NPS were globally of quite low intensity in our sample. When adding MMSE as a feature, only the model predicting apathy heavily relied on it, which may be partially due to the fact that apathy becomes more common with increased cognitive decline [Reference Deng, Chang, Yang, Huo and Zhou44]. These results may have important clinical implications since for each subscale and gender, a model could be trained that outperforms this baseline by at least 0.3 points on the NPI scale.
The positive and negative storytelling were chosen as semistandardized free speech tasks, that still allow for production of natural speech, while limiting the scope/time and induce an emotional reaction in participants. This in contrast to related work measuring cognitive function from similar populations, that relied on more standardized tasks, such as describing an image or completing a verbal cognitive task.
Similar studies have shown as well that computed acoustic features can eventually be used to track changes in mental health states [Reference Manera, Fabre, Stella, Loureiro, Agüera-Ortiz and López-Álvarez45]. Indeed, speech analytics have been tested successfully in psychiatry for its use to predict treatment response in depressed patients [Reference Arevian, Bone, Malandrakis, Martinez, Wells and Miklowitz46] or changes in mood states in bipolar disorder [Reference Carrillo, Sigman, Fernández Slezak, Ashton, Fitzgerald and Stroud47]. As certain feature types seem to be associated with NPS, the outcome of this study may encourage a potential broader use of automatic speech analysis in other neurocognitive disorders for NPS detection. This could particularly improve the objectivity of first front-line assessment procedures and help overcome barriers that prevent timely access diagnosis and treatment.
In parallel to classical methods, such technologies can be used to establish objective, personalized baseline reference standards to design innovative clinical trials that assess the effectiveness of new treatments [Reference Gideon, Provost and McInnis48]. For instance, the use of wearable devices for additional measurements such as heart rate variability or locomotor activity are increasingly investigated for detecting behavioral abnormalities [Reference Teipel, König, Hoey, Kaye, Krüger and Robillard49]. Combined with speech all these data could help reduce evaluation biases and provide richer understanding of variations in NPS on a day-to-day basis even before severity reaches a level of requiring intervention [Reference Reinertsen and Clifford50, Reference Karow, Pajonk, Reimer, Hirdes, Osterwald and Naber51]. In regards to the new rise of decentralized clinical trials, digital technologies will play a major role to complement traditional data acquisition enabling the redesign and adaptation of trials while still ongoing [Reference Copeland, Zeber, Salloum, Pincus, Fine and Kilbourne52].
One limitation of our study is that patients in the sample showed a lot of variability in the MMSE score even if they all met the diagnosis criteria for mild cognitive disorder, which could have affected the results. In addition, patients had no severe NPS—rarely they scored above four, which is the original cut-off. However, taking into account the predictive value of behavioral symptoms [Reference Chow53], it is therefore important to investigate if the technology is able to detect subtle signs of symptoms since this may be even more of interest for early prevention strategies.
Another limitation is that we employed only the NPI scale for the assessment of NPS. Despite the fact that it is widely used and considered as a gold standard for neuropsychiatric assessment, the NPI is probably not the ideal scale for early screening, and to quantify fine changes. Recently, the Mild behavioral Inventory[Reference Taragano, Allegri, Heisecke, Martelli, Feldman and Sánchez54] has been proposed, that could better capture early signs of NPS, and thus may show stronger correlations with speech features in patients with mild NPS symptoms, as it is often the case for people with mild neurocognitive disorders. In addition, a larger study including more patients and more severe NPS symptoms should be replicated in order to validate the found speech markers.
Supplementary Materials
To view supplementary material for this article, please visit http://dx.doi.org/10.1192/j.eurpsy.2021.2236.
Data Availability Statement
The data that support the findings of this study are available from the corresponding author upon reasonable request.
Acknowledgments
The authors would like to thank all participants of this study. This research is part of the MNC3 program of the University Cote d’Azur IDEX Jedi.
Funding Statement
It was partially funded by the MEPHESTO project (Grant DRI-0120105/291), the EIT Digital Well-being Activity (Grant 17074), ELEMENT, the University Côte d’Azur, and the IA Association, and supported by the Edmond & Lily Safra Foundation and Institute Claude Pompidou.
Conflicts of Interest
E.M., J.T., and N.L. are employees and shareholders of ki elements UG.
Authorship Contributions
Conceptualization: J.T., P.R.; Formal analysis: A.K., E.M.; Funding acquisition: P.R.; Investigation: P.R.; Methodology: A.K., N.L.; Validation: A.K.; Visualization: N.L.; Writing—original draft: A.K., V.M.; Writing—review and editing: R.Z.


 Open access
Comments
No Comments have been published for this article.