


The rate of infarct core progression after arterial occlusion in acute ischemic stroke (AIS) is a variable and dynamic process. Reference Rocha and Jovin1,Reference Rocha, Desai, Jadhav and Jovin2 It is difficult to determine whether a patient with AIS will progress quickly to their final volume of infarct or will do so gradually. Reference Rocha, Desai, Jadhav and Jovin2 Various methods and thresholds have been described to designate patients as fast or slow progressors. Reference Rocha, Desai, Jadhav and Jovin2–Reference Seo, Liebeskind and Yoo4
The conventional and commonly used core and time thresholds to define progression are core >70 mL within 6 hours of stroke onset for fast and <30 mL between 6–24 hours for slow progressors. Reference Rocha and Jovin1,Reference Rocha, Desai, Jadhav and Jovin2 Alternatively, using core-to-time ratio also called as early infarct growth rate (EIGR), slow progressors are defined as those with EIGR of <1 and fast as >20 (mL/hour) or alternatively ∼1 as slow and ∼10 (mL/hour) as fast progressors. Reference Sarraj, Hassan and Grotta3,Reference Seo, Liebeskind and Yoo4
The core and time threshold-based definitions exclude a substantial proportion of stroke patients due to inherent nature of description. A relatively recent method to estimate infarct growth is by measuring hypoperfusion index (HI), which is a combination of degree of hypoperfusion marked on an 11-point scale (0–1, 0.1 each), and is correlated with collaterals, patient eligibility for thrombectomy, and functional outcomes in large vessel occlusion (LVO). It is automated and convenient. Reference Guenego, Mlynash and Christensen5–Reference Guenego, Fahed and Albers8 We evaluated 106 stroke patients with any-type occlusion (proximal or distal) in internal carotid artery (ICA)/middle cerebral artery territory to compare different ways to define fast and slow progressors and assessed performance of HI to differentiate between fast and slow rate of core progression in AIS.
The medical records and imaging of 106 prospectively recruited patients with anterior circulation acute ischemic stroke were analyzed after approved by the Health Ethics Committee of the University of Alberta. Patients were successively selected from a pool of patients with ischemic deficits on CT Perfusion (CTP), which was acquired within 24 hours of symptom onset on post-processed FDA-approved RAPID (Rapid processing of perfusion and diffusion; iSchemaView, California, USA) software for estimation of core and mismatch. The perfusion deficit was defined using Tmax > 6 seconds. Core was identified by relative cerebral blood flow (CBF) <30% compared to that in normal tissue. Mismatch was defined as hypoperfused tissue within Tmax > 6 seconds that was out of the core (CBF > 30%). Reference Straka, Albers and Bammer9 Mismatch ratio was calculated by dividing total perfusion deficit by core volume. Hypoperfusion index was calculated automatically on dividing Tmax > 10 seconds by Tmax > 6 seconds on RAPID. Reference Olivot, Mlynash and Inoue6
Using core and time thresholds, we defined fast progressors as patients with ischemic core >70 mL in early tier after stroke onset (0–6 hours) using cutoff extrapolated from stroke trials of CTP in patients with LVO. Reference Rocha and Jovin1,Reference Rocha, Desai, Jadhav and Jovin2
For slow progressors, we evaluated following definitions based on criteria used by CTP stroke trials; DAWN (DWI or CTP Assessment with Clinical Mismatch in the Triage of Wake-Up and Late Presenting Strokes Undergoing Neurointervention with Trevo), DEFUSE 3 (Endovascular Therapy Following Imaging Evaluation for Ischemic Stroke 3), EXTEND (Extending the Time for Thrombolysis in Emergency Neurological Deficits), and TIMELESS (Thrombolysis in imaging eligible late window patients (4.5–24 hours) to evaluate the efficacy and safety of tenecteplase). Reference Rocha and Jovin1,Reference Albers, Marks and Kemp10–13
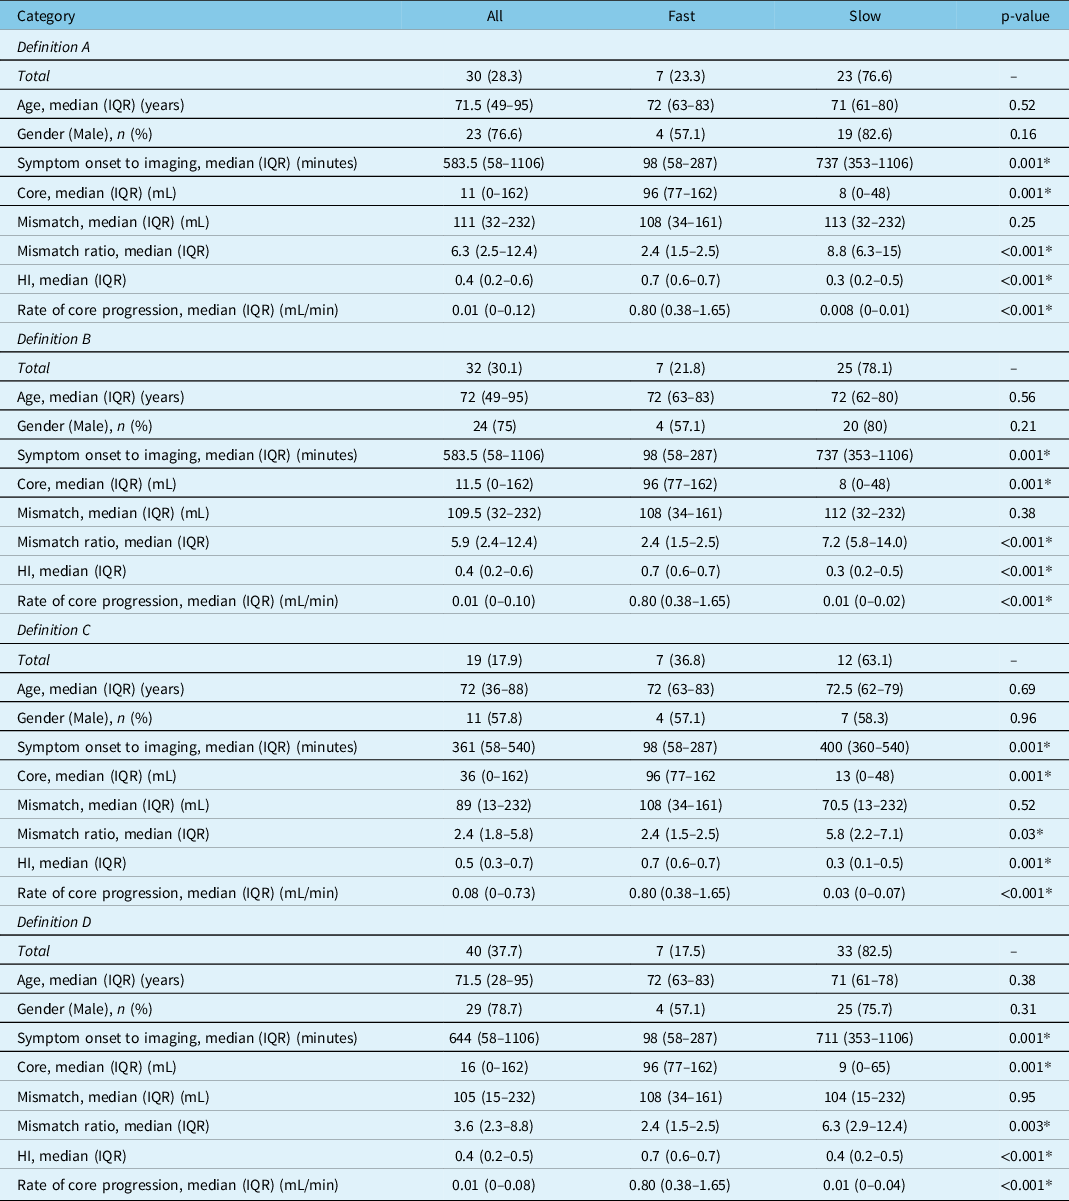
Definition “A”: In patients with LVO, slow progressors were defined as patients with ischemic core ≤30 mL in the late tier after stroke onset (6–24 hours). Reference Rocha and Jovin1
Definition “B”: In patients with LVO, slow progressors were defined as patients with ischemic core ≤50 mL in the late tier after stroke onset (6–24 hours). Reference Nogueira, Jadhav and Haussen11
Definition “C”: In patients with or without LVO (any occlusion type), slow progressors were defined as patients with ischemic core <70 mL, mismatch ratio >1.2, mismatch >10 mL, in the late tier after stroke onset (6–9 hours). Reference Ma, Campbell and Parsons12
Definition “D”: In patients with ICA, M1, M2 occlusions, slow progressors were defined as patients with ischemic core ≤70 mL, mismatch ≥15 mL, and ratio ≥1.8 in the late tier after stroke onset (6–24 hours). Reference Albers, Marks and Kemp10,Reference Nogueira, Jadhav and Haussen11,13
Group of patients at 0–6 hours was called “early tier” and 6–24 hours as “late tier.” LVOs were defined as ICA/M1 occlusions. LVOs and distal occlusions were identified by certified radiologist. Reference Albers, Marks and Kemp10,Reference Nogueira, Jadhav and Haussen11 Outcomes were analyzed on modified Rankin Scale (mRS).
Quantitative data were summarized as median (IQR-interquartile range) due to non-normality (Shapiro-Wilk). Wilcoxon rank sum and x2/Fischer’s exact test were used for comparison as appropriate. The rate of core progression was determined using core-to-time ratio, that was dichotomized by > or ≤0.1–mL/minute as fast or slow, respectively. Reference Sarraj, Hassan and Grotta3–Reference Guenego, Mlynash and Christensen5 HI was compared to rate of core progression, and the best-fitting model (cutoff) was determined using receiver operating characteristic to determine sensitivity and specificity of HI. Data analysis was conducted using STATA 16.0 (StataCorp LLC Texas, USA) and p-value <0.05 considered significant.
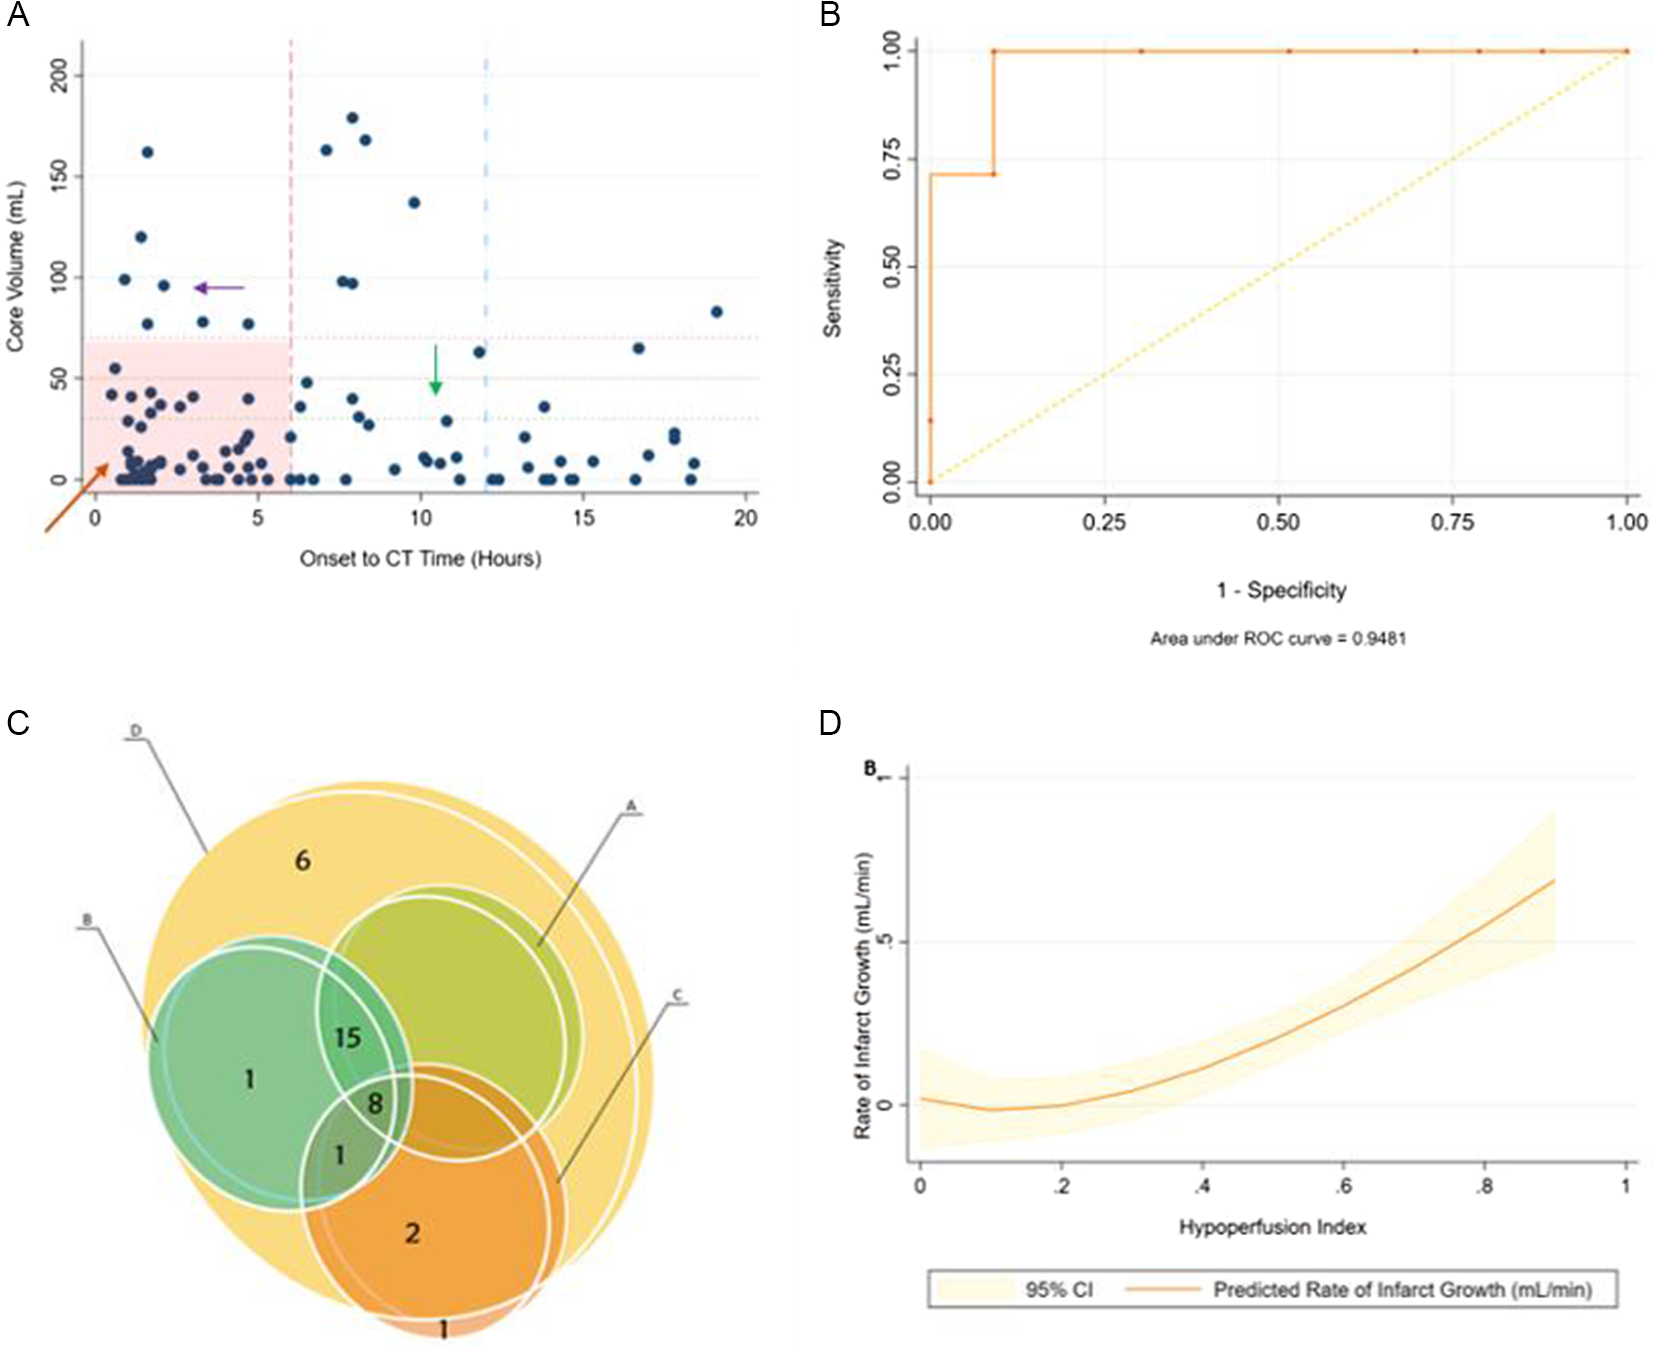
A total of 106 patients were analyzed, whose baseline characteristics are shown in Table 1. The median (IQR) core volume was 9 (0–37) mL, mismatch was 81 (40–113) mL, mismatch ratio was 3.2 (2.2–9.0), and HI was 0.4 (0.2–0.6). Ischemic core was ≤10 mL in 57 (53.7%), ≤30 mL in 76 (71.69%), ≤50 mL in 89 (83.96%), and ≤70 mL in 93 (87.73%) patients. Fifty-six (52.8%) were in early tier. Seventy-eight (73.5%) had LVO. Patient distribution across the cohort is shown in Figure 1.
(A): Distribution of patient cohort. Onset to CT time in hours (x-axis) plotted against core volume in mL on CTP (y-axis). Top left (purple arrow) are fast progressing and bottom right (green arrow) are slow progressing. Bottom left (orange arrow) represents early presenting patients who do not meet conventional core and time threshold criteria to differentiate fast and slow progressors. (B): Receiver operating characteristic for predicting fast versus slow rate of core progression (core/time) using HI cutoff 0.5. Fast = >0.5, Slow = ≤0.5. (C): Mutual inclusion and exclusion of patients as slow progressors using different definition criteria A–D for slow progressors. Each circle shows the number of patients included by each definition (A–D) and shows if a patient is mutually inclusive or exclusive. Note that Definition D includes all patients from other definitions except 1. (D): Hypoperfusion Index (y-axis) versus Infarct Growth Rate that is, core/time (mL/min) (x-axis).
Baseline characteristics
ICA = Internal Carotid Artery; NIHSS = National Institutes of Health Stroke Scale; ASPECTS = Alberta Stroke Program Early CT Score; IQR = Interquartile range; TICI = Thrombolysis In Cerebral Infarction; IV = Intravenous.
By using different criteria, the number of patients who could be classified as slow progressors by each definition was different, as shown in Figures 1 and 2. Seven (12.5%) were fast progressors in early tier and 23 (46%), 25 (50%), 12 (24%), and 33 (66%) were slow progressors in late tier according to criteria A, B, C, and D, respectively. Criteria “D” was most inclusive (31% slow by “D” versus 11–23% for others) as it incorporated nearly all patients from other definitions, covered all core thresholds, and included non-LVO (M2) occlusions as well, yet could not classify the rest (n = 44) (Figures 1 and 2).
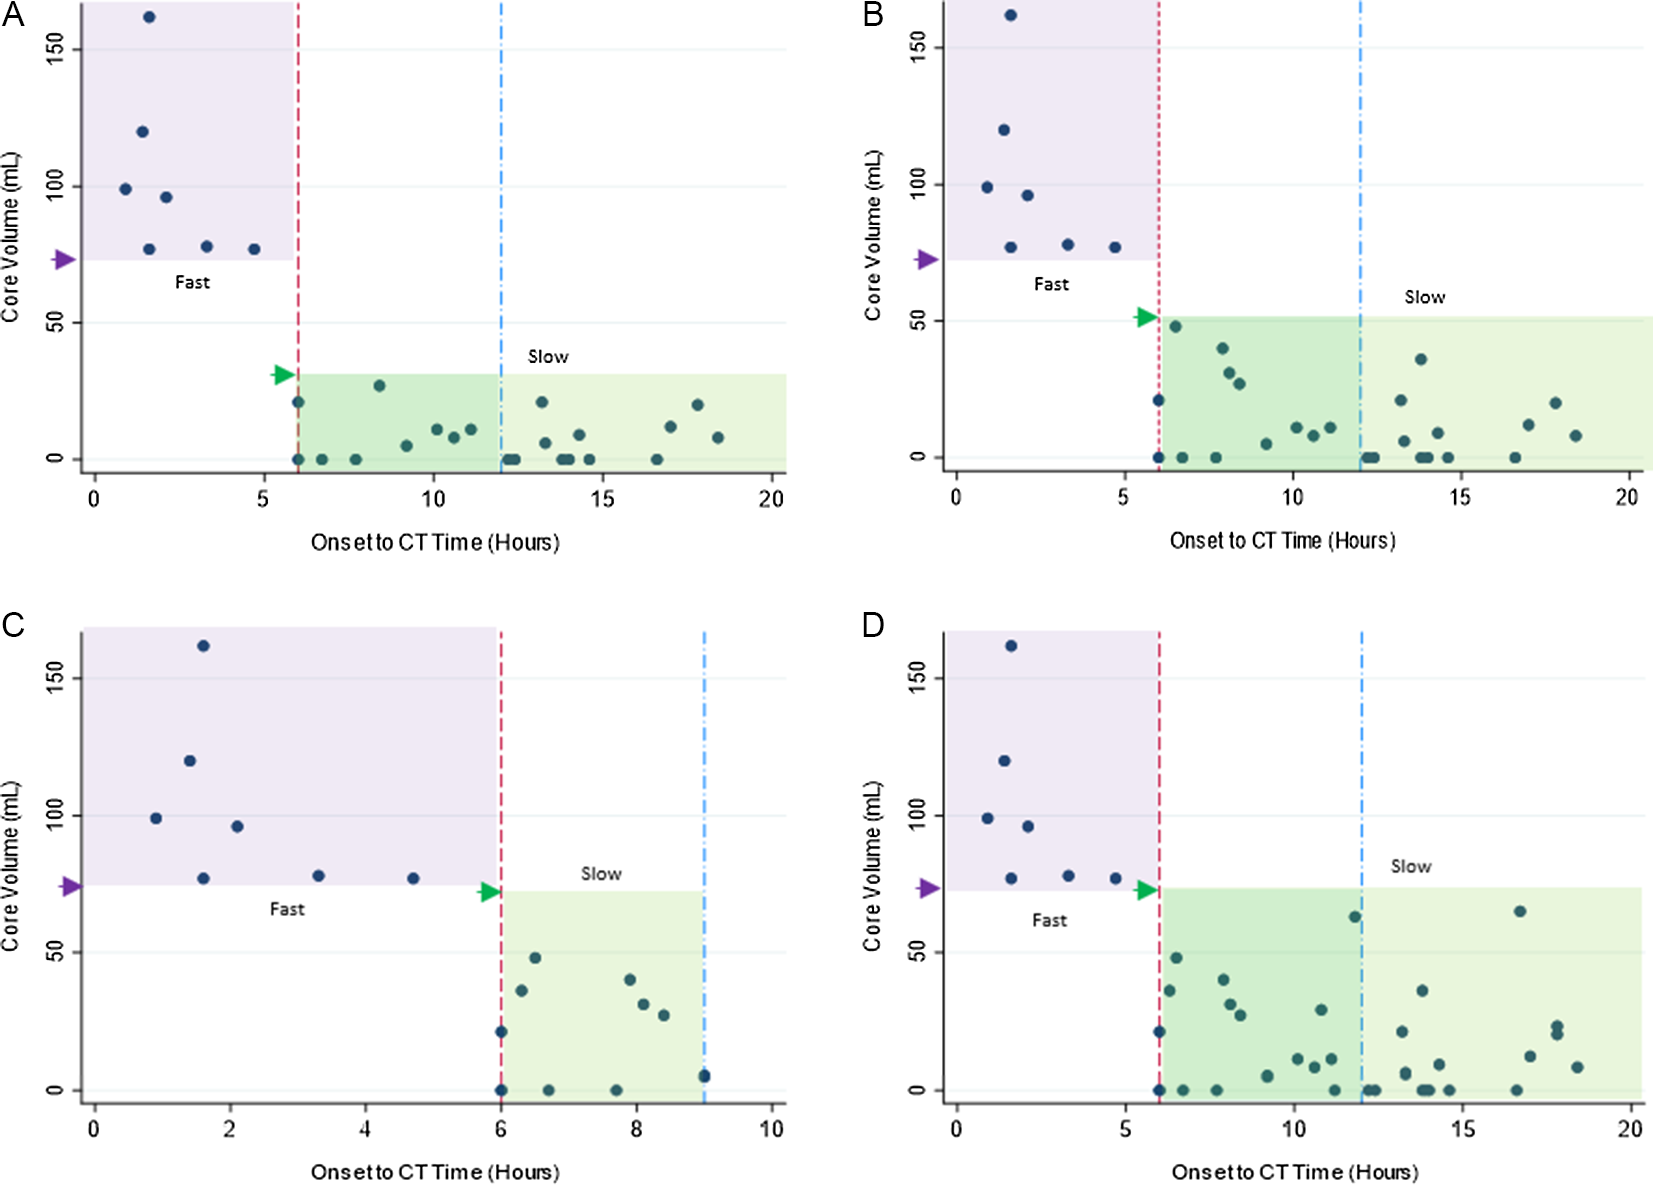
Distribution cohort using different definitions. Onset to CT Time in hours (x-axis) plotted against core volume in mL on CTP (y-axis). Small arrow heads points towards respective core volume cutoff used for each definition [lower limit for fast (dark purple arrow) and upper for slow (bright green arrow) progressor group]. Highlighted box areas represent progressor types (purple = fast, green = slow). (A): Definition “A.” (B): Definition “B.” (C): Definition “C.” (D): Definition “D.”
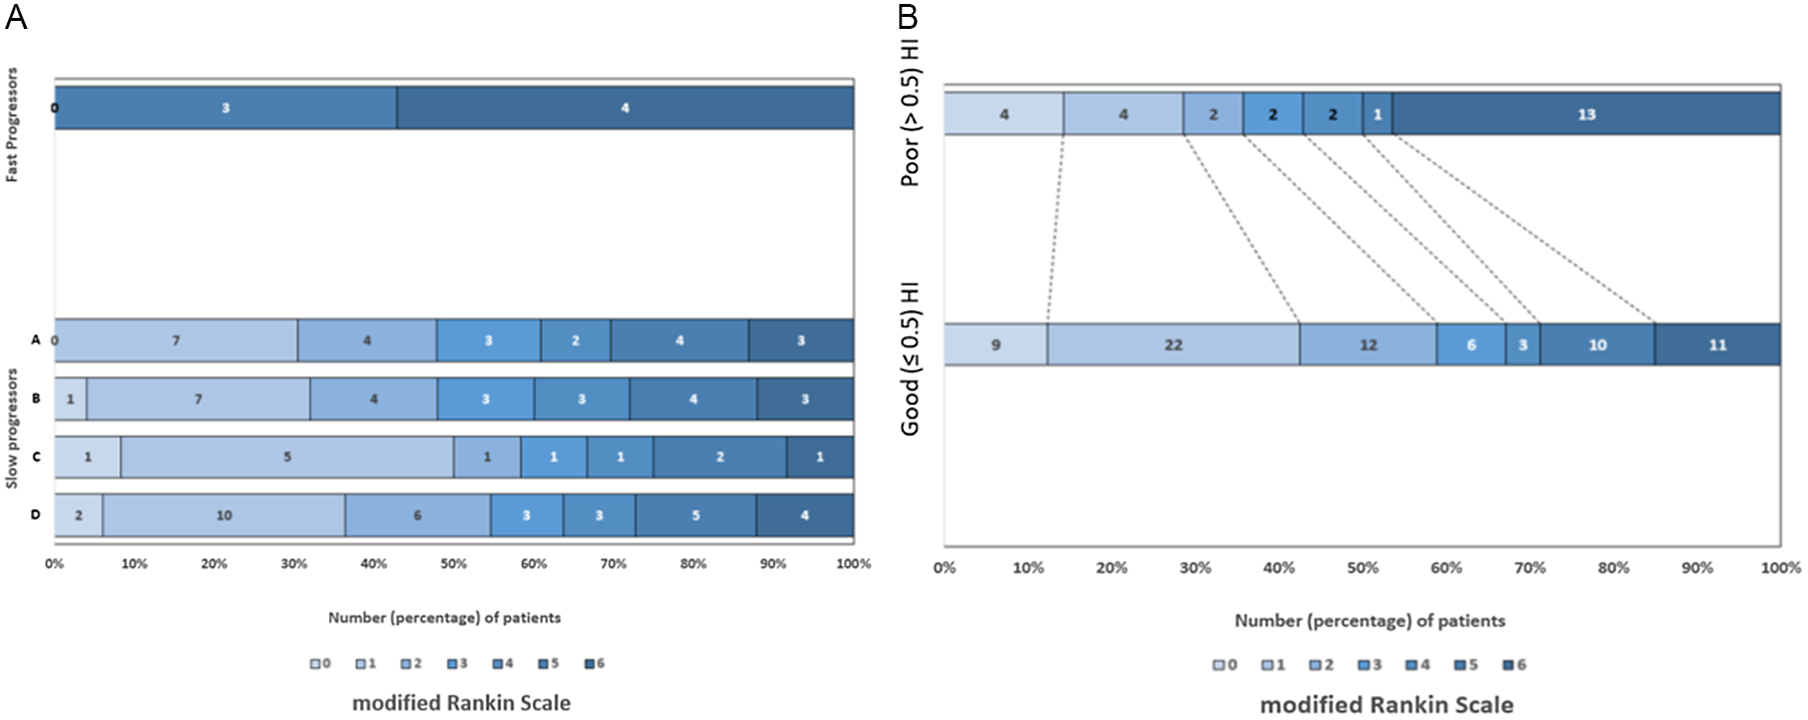
HI was significantly different between fast and slow groups across all definitions (Table 2). HI for overall cohort was ≤0.5 in 77 (72.6%). For the overall cohort, the median (IQR) rate of core progression was 0.02 (0–0.06) in ≤0.1 and 0.28 (0.04–0.66) in >0.1 mL/minute core-to-time ratio groups, (p < 0.001). HI cutoff ≤0.5 (good) and >0.5 (poor) differentiated slow from fast rate of infarct progression in all-type occlusions, having sensitivity 100%, specificity 90.9%, and AUC 0.94 (Figure 1), with comparable baseline characteristics (supplementary table). Those with HI ≤ 0.5 (good) were more likely to receive thrombolysis, and/or thrombectomy and had better outcomes as compared to HI > 0.5 (poor), having median (IQR) 90-day mRS score 2 (1–5) and 5 (3–6) respectively, (p = 0.02) (supplementary table and Figure 3).
(A): Patient outcomes (modified Rankin Scale) in slow progressors (by different definitions) and fast progressors. (B): Patient outcomes in good (≤0.5) and poor (>0.5) hypoperfusion index groups in whole cohort.
Patient characteristics between fast and slow progressor type in each definition
HI = hypoperfusion index.
* Significant.
Our study indicated that ∼13% patients in early tier were fast progressors, whereas 24–66% were slow progressors in late tier using different time and core constrained definitions. Although most inclusive, definition D could not account for distal occlusions due to the nature of description. In comparison, HI categorized 100% (n = 106) of the cohort with optimal cutoff 0.5 with good sensitivity and specificity to differentiate between slow and fast rate of core progression (core/time) in any-type occlusion. Using HI, ∼73% were classified as having slow rate of core progression (HI ≤ 0.5) with more likelihood of attempted reperfusion and better outcomes.
Slow progressors are associated with reduced level of disability than fast progressors. Reference Seo, Liebeskind and Yoo4 We have shown that by using <70 mL core criteria and including distal occlusions for slow progressors, we can identify more patients with slow progression who can potentially benefit from reperfusion than anticipated by earlier commonly used definitions. Reference Dorn, Lockau and Stetefeld14–Reference Sarraj, Sangha and Hussain16 This however needs external validation. HI-based estimation is easy and automated on standard CTP RAPID rather requiring cumbersome calculations. Reference Guenego, Mlynash and Christensen5–Reference Guenego, Fahed and Albers8 The quick description of fast and slow infarct progression in various stroke sub-populations can help guide transfer and treatment decisions by anticipating rate of core progression and time of completion to infarction. However, the results should be interpreted considering limitations of CTP and its restricted availability. Although stroke progression is a dynamic process, HI has been shown to remain stable during patient transfers. Reference Guenego, Mlynash and Christensen5,Reference Broocks, Rajput and Hanning17,Reference Vagal, Wintermark and Nael18 While our findings are likely to be applicable to clinical experience of similar high-volume comprehensive stroke centers, the observed proportions and relevance of fast and slow progressors, and transfer strategies may vary depending upon unique regional geography. Furthermore, given the small sample size, generalizability of results should be attempted with caution. Also, distal vessel occlusions accounted for 28% (n = 30) of cohort with most patients having LVOs, and therefore applicability to all type occlusions should be done judiciously and with care. However, the inclusive proportion of distal occlusions versus LVO in our study is much better than previous studies done in the setting of clinical trials and thus may represent true depiction of vessel occlusion types in clinical practice. Reference Goyal, Ospel, Menon and Hill19,Reference Nomani, Tatuene and Rempel20 Future trials of HI can help validate its utility in patients with strokes of all type occlusions.
In conclusion, HI ≤ 0.5 differentiates slow from fast rate of infarct progression in AIS with any-type occlusion and may be indicative of eligibility for reperfusion and clinical outcomes. Estimation of progressors by HI seems comprehensive but needs external validation.
Supplementary Material
To view supplementary material for this article, please visit https://doi.org/10.1017/cjn.2022.9
Acknowledgements
None.
Disclosures
A.Z. Nomani, J. L. Rempel, K. A. Khan and A. Shuaib report no disclosure. G.C. Jickling reports receiving grant funding from CIHR, HSF, CFI, NIH and UHF.
Statement of Authorship
AZN and GCJ contributed equally in the conception and design of study, and acquisition of data. AZN, JLR, KAK, AS and GCJ equally contributed in analysis and interpretation of data, drafted manuscript, reviewed manuscript, and gave final approval of version for publication.


