


Policy significance
In our study, we investigate the benefits and limits of using artificial intelligence (AI) algorithms for the automatic labeling of government expenditure programs into the sustainable development goals (SDGs). Integrating the goals into the budget system is crucial for an effective alignment of national development priorities with the objectives set in the 2030 Agenda. However, developing a national SDG taxonomy requires substantial investments in terms of time effort, human, and administrative resources. Automated SDG budget tagging could represent a cost-effective solution for these issues. We show that, while existing coding schemes can be easily scaled, governments cannot just rely on AI tools and off-the-shelf taxonomies that do not consider contextual expertise and contributions from local stakeholders. Hence, international development organizations should support national governments in undertaking the process of SDG budget alignment, given the significant investment that it entails.
1. Introduction
Since the 2015 Addis Ababa Action Agenda, issues surrounding financing development have gained momentum in international debates. During the Decade of Action (2020–2030), the United Nations (UN) is aiming at implementing globally Integrated National Financing Frameworks (INFF) that can align different financing sources to the sustainable development goals’ (SDGs) targets defined by the 2030 Agenda. Public spending is one of the key financial sources, as stressed through the “Budgeting for SDGs”–B4SDGs–paradigm (Palacios et al., Reference Palacios, Quiroga, Romero and Ruiz2022). The B4SDGs incorporate SDG targets into the different phases of the budgetary process to streamline public financing and national policies, and to accelerate the achievement of development priorities. The role of strategic SDG budgeting is further justified by its key role in the mobilization of financing sources from private actors, both at the national and international levels, which are the focus of several development targets (Ishtiaq et al., Reference Ishtiaq, Middlebrook, Gábor, Poghosyan and Beloe2022). This is especially true in developing countries, where the United Nations Conference on Trade and Development (UNCTAD) estimates an annual average financing gap in SDG-related sectors of US$2.5 trillion.Footnote 1
Integrating the SDGs into public financial management (PFM) systems is crucial for the alignment of national development priorities with the 2030 Agenda. A preliminary step in this process is given by SDG budget tagging, through which government programs are traced into the goals. However, as shown by different case studies (e.g., Palacios et al. (Reference Palacios, Quiroga, Romero and Ruiz2022)), developing an SDG taxonomy involves a significant investment in terms of time effort, and human and administrative resources. In addition, such costs could be exacerbated in developing settings often characterized by limited institutional capacity. The automated SDG classification of budgetary programs (BPs) through machine learning (ML) algorithms might represent a cost-effective solution for many governments adopting the B4SDGs paradigm. Text analysis techniques, in particular, have gained increased popularity in both academia and international organizations due to their ability to process large corpora of documents. In this paper, we use well-established text analysis and ML techniques to explore the scope and scalability of automatic labeling BPs within the B4SDGs framework.
The B4SDG framework is divided into six interconnected steps: (1) strategic budgeting, (2) budget formulation, (3) budget presentation and approval, (4) budget execution, (5) monitoring and reporting, and (6) audit and evaluations (Poghosyan et al., Reference Poghosyan, Baboyan, Strawson and Radhika2020). Within this process, the monitoring and reporting stage represents a prerequisite for any kind of budgetary diagnostics, such as impact evaluations on target populations, allocative efficiency, or equity analysis. These, in turn, can facilitate a cleaner connection between budgetary allocation and SDG indicators, and promote the participation of relevant stakeholders in the formulation of development priorities.
As there does not exist any standard methodology for tracking finances on SDGs, each country has the opportunity to develop its own system. However, to implement effective SDG budget tracking––to link public spending patterns to the performance of SDG indicators––governments must first conduct SDG budget labeling. That is, matching government expenditure programs to the 17 development goals or, at the lower level of the 169 targets defined by the 2030 Agenda. This is a necessary step to systematically estimate baseline expenditures on SDGs. In recent years, several countries have implemented different coding systems in collaboration with international development organizations, such as the UNDP and the World Bank. These methods vary according to the associated types of investment, SDG targets, and alignment with the budget cycle. For instance, in Mexico, more than 83% of 584 expenditure programs have been linked to the SDGs, although several public agencies and federal funds are not yet included in the budget. In Colombia, SDG tracking extends to Official Development Assistance (ODA) and private finance, while 89% of the public budget is matched to the SDGs. Other countries have struggled with keeping such bureaucratic procedures functioning in a sustainable way. In the case of Pakistan, the Ministry of Finance and the Ministry of Climate Change (in collaboration with the UNDP) developed a coding system to track the progress towards SDG 13 (‘Climate Action’). However, the Ministry lacks the necessary expertise to maintain the system in place and sustain the reporting activity on a regular basis. Systematic reporting was also a major issue in the case of Uzbekistan. Here, the Ministry of Finance labeled 72% of the public budget for 16 SDGs. However, the protocol did not provide a clear connection to the expenditure data and was not linked to the planning of the subsequent fiscal cycle, rendering it unsustainable (Ishtiaq et al., Reference Ishtiaq, Middlebrook, Gábor, Poghosyan and Beloe2022).
Across these experiences, the institutional capacity of national governments and their ministries play a pivotal role in the scope and effectiveness of the B4SDGs framework, even at the initial stage of SDG budget tagging. This manual coding is an onerous procedure and requires a significant amount of resources to develop the SDG taxonomy and scale it to new expenditure programs. These limitations are larger in less developed countries, which are often characterized by a constrained institutional capacity. The automation of SDG budget tagging could generate significant time savings and reduce administrative and technical expenses, especially in terms of human resources. This, in turn, would ease the alignment of national budgets to the SDGs targets, speeding up the progress towards the objectives set by the 2030 Agenda.Footnote 2
We provide a formal assessment of different text analysis algorithms for the classification of fiscal data into the SDGs, to understand if and how they can support policymakers in integrating the goals into their budgetary procedures. The paper is structured as follows. Section 2 presents the relevant literature divided into the following: (2.1) an overview of the B4SDGs framework and its related implementation challenges; (2.2) a summary on applications of text analysis tools in both public policy and sustainable development studies; and (2.3) a description of the pioneering manual SDG budget tagging performed by the Mexican government a decade ago. In Section 3, we present new and unique SDG-labeled fiscal data from three different countries. Section 4 introduces the methods employed in this study. In Section 5, we show our main results. Finally, in Section 6, we discuss the policy implications of our findings, highlight the limitations of the study, and conclude.
2. Relevant literature and real-world experiences
2.1. Budgeting for SDGs and its challenges
The budgeting for SDGs–B4SDGs–paradigm is formally defined as a framework to “link and integrate SDGs into processes, systems and decisions that are part of government’s budget cycle” (Ishtiaq et al., Reference Ishtiaq, Middlebrook, Gábor, Poghosyan and Beloe2022). This approach has been sponsored by different international bodies, such as FAO, UNICEF, UN Women, IDDRI, and the OECD.
To support both the promotion and the formulation of reforms at the country level, the UNDP has produced several B4SDGs guidebooks and technical notes (e.g., Ishtiaq et al. (Reference Ishtiaq, Middlebrook, Gábor, Poghosyan and Beloe2022)). Such effort aligns with the growing trends of countries incorporating SDGs into their national policy frameworks. As reported by Okitasari and Kandpal (Reference Okitasari and Kandpal2022), in the voluntary national reviews (VNRs) submitted in 2021,Footnote 3 35 countries reported incorporating SDGs into their national development plans, while 25 did for development strategies at the local level. Such high-level commitments must also be reflected in budgetary allocations to result in a coherent link between strategic development objectives and effective public spending. However, major implementation challenges still remain.
Despite its prominent role in achieving the transformative goals set in the 2030 Agenda, SDG budgeting is still in its infancy and there is large heterogeneity across countries in how they integrate SDGs into budgetary processes (e.g., see Hege et al. (Reference Hege, Brimont and Pagnon2019); Mulholland and Berger (Reference Mulholland and Berger2019)). In fact, such an institutional alignment requires substantial administrative capacity that could be a bottleneck in many developing countries, especially when trying to introduce innovation or change the established modus operandi (Thomas and Grindle, Reference Thomas and Grindle1990). For instance, Mirzamani et al. (Reference Mirzamani, Naderi–Beni and Mohammadian2022) explore the role of policy capacity on the implementation of performance-based budgeting in the case of Iran. The authors find that the lack of analytical, organizational, and political capacity among public officials prevented the formulation of a clear framework identifying the objectives, strategies, and resources needed to change existing budgetary procedures.
However, on the opposite side of the spectrum of SDG-budgeting adoption, we also find examples of a successful integration into national agendas, as in the case of Indonesia. Halimatussadiah (Reference Halimatussadiah2020) reports a strong commitment of the government to streamline the 2030 Agenda’s goals into long- and medium-term development plans, both at the national and subnational levels. Through formal regulations and the systematic effort of devising a budget tagging system, the central authority managed to align development priorities to budgetary allocations. While the Indonesian experience shows promising results, the current framework can still be improved. Importantly, one of the key recommendations of this publication is the optimization of the budget tagging system. This has been limited to overall efficiency and climate control, without a comprehensive approach tracking the contribution of public programs to specific SDGs. The automation of such procedures via text analysis tools represents a potential way to achieve this goal. Text analysis, in fact, has seen an increased number of applications in both public policy and sustainable development studies, as presented in the next section.
2.2. Text analysis in public policy and sustainable development
Given their ability to process large amounts of public documents, natural language processing (NLP) has become increasingly popular both in the policy domain and among scholars of Public Administration and Political Science (see Hollibaugh (Reference Hollibaugh2019) for an overview of the most common tools). Such methods can complement and support analyses that rely primarily on human coding and have found a broad range of applications. For instance, Ma (Reference Ma2021) assesses the accuracy of different ML classifiers in labeling the US nonprofit sector into The National Taxonomy of Exempt Entities (NTEE) classification system. Their best classifier, BERT (Devlin et al., Reference Devlin, Chang, Lee and Toutanova2019), outperforms human coders in several categories. Anastasopoulos et al. (Reference Anastasopoulos, Moldogaziev and Scott2020) use latent dirichlet allocation (LDA) to assess the relevance of organizational context (i.e., complexity, turbulence, and munificence) in shaping budgetary orientations of public sector organizations in California counties. Pandey et al. (Reference Pandey, Pandey and Miller2017) rely on an approach based on phrase-level dictionaries to measure organizational innovation in the public sector, focusing on a sample of school districts in New Jersey. The authors benchmark the dictionary built through NLP tools for phrase extraction against the one based on expert assessments, finding a high correlation between the two measures of innovativeness.
Computational text analysis techniques have also been applied in the context of the SDGs and the 2030 Agenda. Lee and Kim (Reference Lee and Kim2021) combine social media data with SDG keywords and similarity-matching methods to build an SDG social index. The measure captures the public’s opinion of a company’s performance in achieving the SDGs and tries to overcome the limitations of traditional methods such as surveys and interviews in evaluating consumers’ ratings. In a recent paper, Matsui et al. (Reference Matsui, Suzuki, Ando, Kitai, Haga, Masuhara and Kawakubo2022) train a classifier using the NLP model BERT to link challenges and practices contained in Japanese official documents to the SDG goals. This mapping is then exploited to conduct a multi-label classification of the indicators in the Inventory of Business Indicators from SDG compass, to visualize interconnections between SDGs and identify unexpected synergies. Finally, the model is used for matchmaking between stakeholders, linking the challenges of two Japanese municipalities to the potential solutions offered by the private sector.
This last application highlights how the impact of text analysis techniques can go beyond the academic debate, with broader implications for decision-making processes and stakeholder engagement. Such methods can also provide assistance to expert knowledge, by speeding up and optimizing burdensome tasks. For instance, Galsurkar et al. (Reference Galsurkar, Singh, Wu, Vempaty, Sushkov, Iyer, Kapto and Varshney2018) use paragraph embedding techniques to (semantically) match national development plans to SDG concepts. The aim of the study was to support policy experts in carrying out a rapid integrated assessment (RIA) of the documents, which would otherwise entail a significant amount of time and effort. Another example along these lines is provided by the work of Porciello et al. (Reference Porciello, Ivanina, Islam, Einarson and Hirsh2020), who developed Persephone, an ML framework that can assist evidence-based decision-making in the context of SDG 2 (‘Zero Hunger’). Hence, these methods can shape not just the quality, but the concept of information itself that is available to policymakers (Giest, Reference Giest2017).
The ability of a government to use big data analytics is likely to depend on institutional barriers and capacity constraints. However, bureaucracies are often characterized by low levels of technical literacy among civil servants, causing outsourcing and increased costs (Dunleavy et al., Reference Dunleavy, Margetts, Tinkler and Bastow2006). Such a problem is especially pervasive in developing countries, where governments have to deal with non-responsive administrative environments that are slow to change and struggle to introduce innovation (e.g., see Ondiek and Onyango (Reference Ondiek, Onyango and Onyango2021) for the case of e-waste management in different Sub-Saharan countries). In these institutional settings, the implementation of new procedures that alter the status quo often leads to political disagreement and is likely to face opposition, so both policymakers and public officials may need to invest a significant amount of resources (e.g., political, managerial, technical) to ensure a successful outcome (Thomas and Grindle, Reference Thomas and Grindle1990).
Our study highlights all these implications by building on a salient policy issue in the international development community. To the best of our knowledge, no study has been conducted on SDG labeling for fiscal data. This gap is understandable due to the scarce availability of open SDG-labeled data on BPs. Such data have only recently been made available by some governments, partly due to the collaboration between different international development agencies and their efforts for ensuring fiscal transparency. Note that this emerging trend is in line with the idea of using big and open-linked data as a driver of policymaking innovation (Janssen et al., Reference Janssen, Konopnicki, Snowdon and Ojo2017).
2.3. SDG budget tagging: The case of Mexico
The first country to pioneer SDG tagging in government budgets was Mexico. These efforts started in the early 2000s with the millennium development goals and the Mexican national government spearheading a transition towards budgetary-program-oriented spending. These early efforts consisted mainly of integrating the millennium development goals into the strategic planning process through the National Development Plan. Subsequently, as the SDGs became the leading international agenda, the Mexican Ministry for Finance (SHCP, for its acronym in Spanish) developed a framework to map thousands of BPs into the 169 targets of the SDGs. This methodology was published in an annex of a document specifying guidelines for the budgetary planning of the 2018 fiscal cycle by the SHCP (SHCP, 2017). This was the first method for SDG budget tagging, and it has been applied to BP data since 2012 (retroactively for the years priors to the publication of the 2030 Agenda). Members of the team that created this methodology currently work at different international organizations supporting the development of similar methodologies for other countries and regions.
The Global Initiative for Fiscal Transparency (GIFT) is one of the organizations that has been developing SDG-tagging methodologies that build from the Mexican experience. To gain insights into how costly is to engage in the manual classification of budgetary data, we interviewed one of the technical experts of GIFT who was part of the SHCP team. This expert commented that SDG tagging requires a substantial investment in all administrative levels of the public administration. The first stage of this process requires several high-level round tables with approximately 10 ministers or deputy ministers (each one with an advisory team), and 5 or 6 senior public servants from the President’s Office. The aim of this stage is to establish which budgetary tranches are the most relevant to different ministries and departments.
Once high-level issues have been covered in these discussions, the second stage takes place. Here, each ministry and department holds internal meetings to determine the policy dimensions, within each tranche, that are the most significant to their goals and functions. The third stage consists of the actual implementation of the budget-tagging procedures. In the particular case of Mexico, this was achieved by developing a dedicated computational platform in which the tasked public servants input relevant information about government programs, budgets, and the associated SDG targets.
Without considering the cost of devising the data-capturing platform (which took 2 months to develop), GIFT’s expert estimates that the first stage used 2000 man-hours of high-level public servants. By extrapolating these costs to stages 2 and 3 and lower-level servants, one could get an idea of the large investments and capacity demands of implementing a manual SDG-tagging from scratch.
3. Data
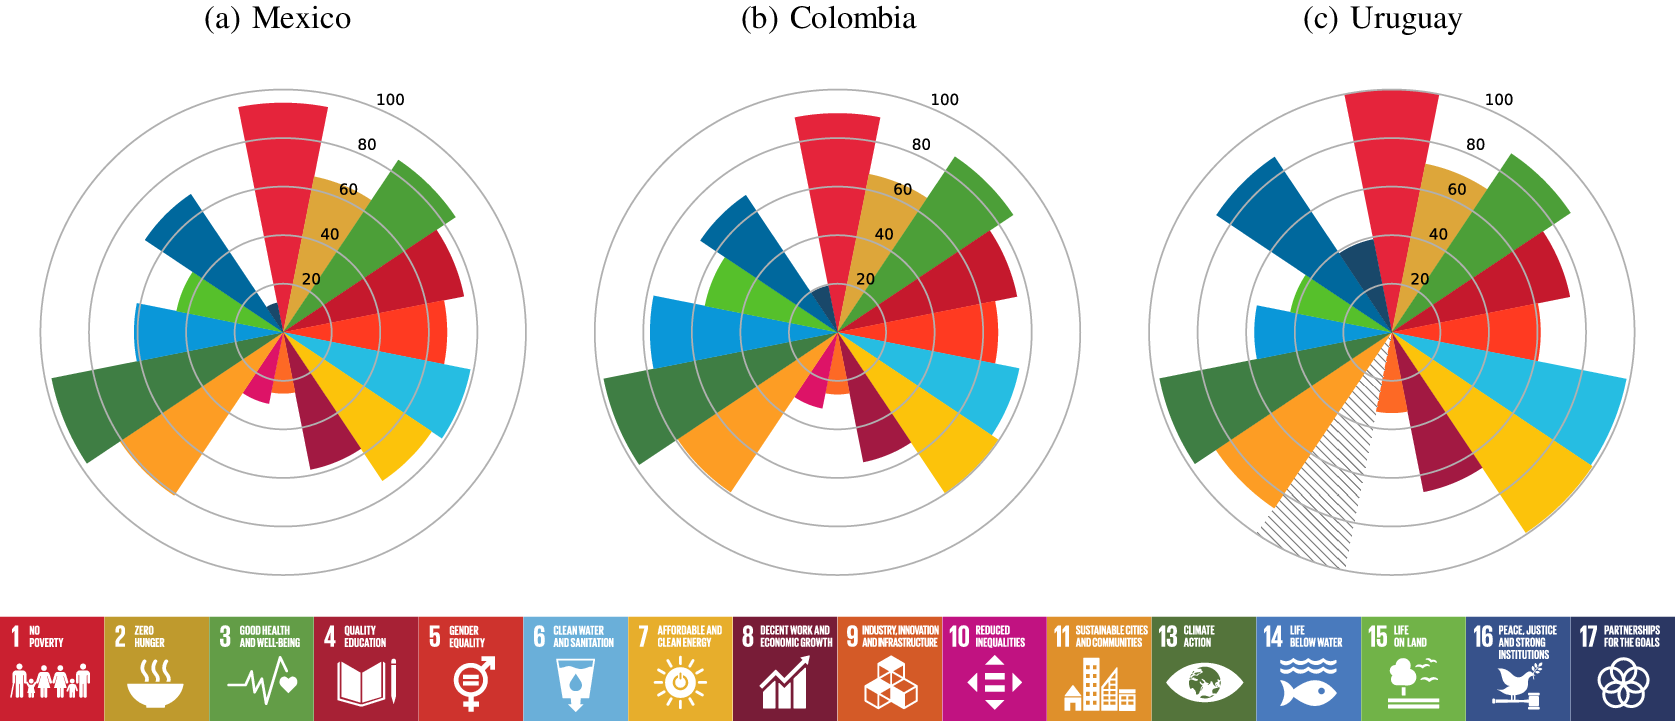
In our work, we analyze fiscal data from three countries: Colombia, Mexico, and Uruguay. As shown in Table 1 and Figure 1, these institutional settings differ both in terms of average development (measured through normalized SDG indicators) and public spending across SDGs. In Table 1, we report the percentage of SDG-labeled budget allocated to the different goals in the fiscal year 2020. First, we notice that the most prioritized goal varies across the three countries, being SDG 4 (‘Quality Education’) for Mexico, SDG 3 (‘Good Health and Well-being’) for Colombia, and SDG 10 (‘Reduced Inequalities’) for Uruguay. In all three cases, more than one-fifth of the labeled budget is allocated to the most prioritized goal. On the other hand, the percentage of Colombian and Uruguayan budgets targeted at both SDG 13 (‘Climate Action’) and 14 (‘Life Below Water’) is quite modest. For SDG 11 (‘Sustainable Cities and Communities’) in Mexico, we observe a withdrawal of public funds. In Figure 1 instead, we report the average level of SDG indicators achieved by the three countries in 2020.Footnote 4 Overall, it appears that Uruguay is the best-performing country in terms of average development across the different goals. This seems particularly true for SDG 6 (‘Clean Water and Sanitation’) and 7 (‘Affordable and Clean Energy’).
Distribution of public spending over SDGs by country (2020)

Notes: We report the percentage of SDG-labeled budget allocated to the different goals in the fiscal year 2020 across the three countries. For Mexico, there is no SDG-labeled budget allocated to SDG 13 and 14 in 2020.
Average indicator levels by SDG (in percentage).
Notes: The indicators have been normalized between zero and one, and presented in percentage. A higher indicator value denotes a better outcome. The striped areas indicate that no indicators in such SDG were available for the year considered (2020). The dataset used (the 2021 Sustainable Development Report) does not contain indicators for SDG 12 (‘Responsible Consumption and Production’).
Mexico, Colombia, and Uruguay differ in how they have integrated the SDGs into their planning, budgeting, and financing practices. However, they are among the few nations in the UN implementing systematic budget tagging and providing publicly available SDG-labeled fiscal data for individual government programs. In addition, they also represent two different approaches of how the SDG taxonomy has been created. While for Mexico and Uruguay, SDG budget tagging is mainly the result of a national effort, in Colombia, the UNDP has played a major role in developing the coding system to classify the country’s budget into the SDGs (Palacios et al., Reference Palacios, Quiroga, Romero and Ruiz2022). The Mexican data can be accessed through the government’s Budgetary Transparency Portal (http://www.transparenciapresupuestaria.gob.mx) by downloading the Expense Budget Files. In Colombia, the data can be obtained in the General Alignment Dashboard developed by UNDP (https://bit.ly/SDG_Taxonomy_CO). The Uruguayan data can be obtained from the government’s Budgetary Transparency website (https://transparenciapresupuestaria.opp.gub.uy) by downloading the SDG-programatic-area-linked data files.
For each of these countries, we consider all the budget programs (BPs) for which textual information describing their features is available.Footnote 5 Table 2 presents the total number of BPs considered for each country and their distribution across SDGs. We notice great heterogeneity in the proportion of BPs targeting the different goals. For both Colombia and Mexico, the large majority of the BPs is directed to SDG 16 (‘Peace, Justice and Strong Institutions’), whereas for Uruguay, more than one-quarter of the programs address SDG 3 (‘Good Health and Well-being’). In the three countries, only a minimal fraction of the BPs belong to either SDG 5 (‘Gender Equality’), or SDG 6 (‘Clean Water and Sanitation’). Textual features provide us with relevant details about the nature of the BPs, such as the administrative unit in charge of implementing them, the macro-category of expenditure to which they belong, or (when present) the indicators used to measure their performance. Their number varies across countries, with Uruguay being the one where programs have the largest number of textual features (i.e., 28).Footnote 6
Distribution of BPs over SDGs by country
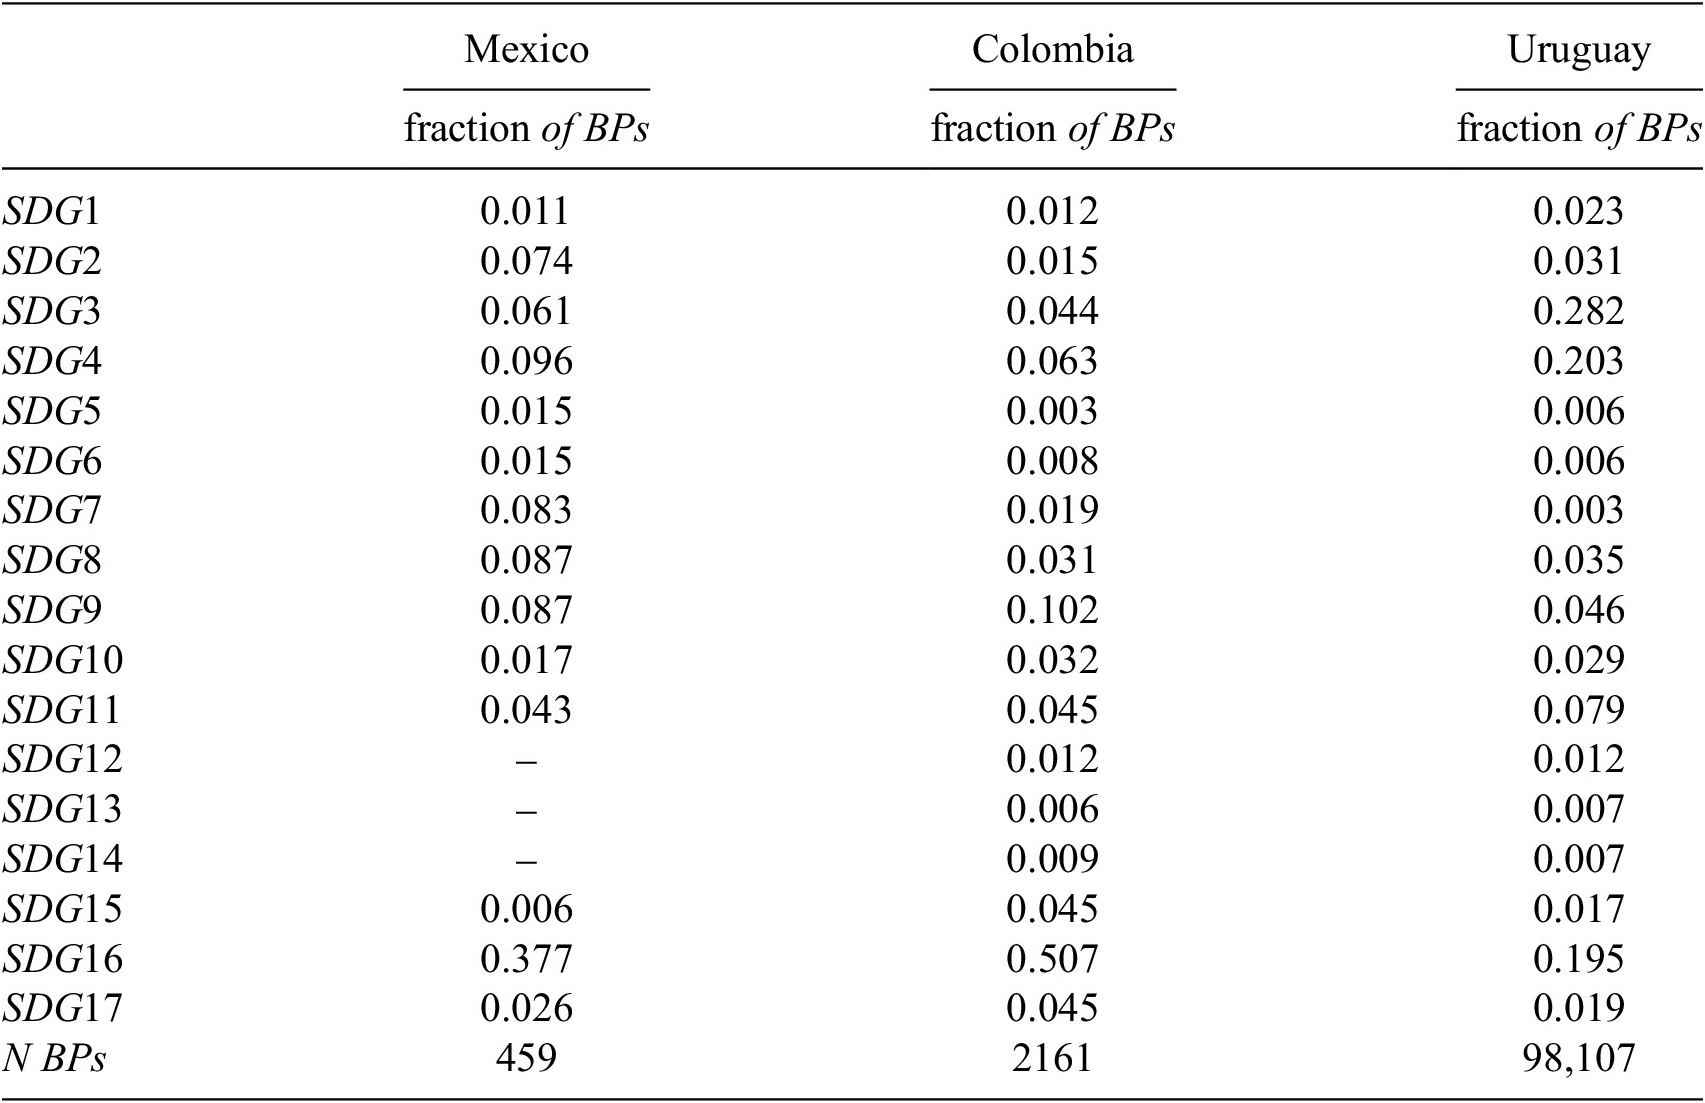
Note: For Mexico, we exclude SDG 12 and 13 from the subsequent analysis, as there is only one BP for each of them. SDG 14 instead is not represented in the BPs.
We collapse the textual features so that a single text string describes each BP. Table 3 reports the mean number of unique tokens (after pre-processing) across BPs for each country (as a raw measure of the complexity of these strings). We observe that the Uruguayan BPs have the highest average number of unique tokens. This is not surprising given the higher amount of features considered in this setting. Table 3 also shows the mean cosine similarity of the documents and their soft cosine similarity. This last metric, developed by Sidorov et al. (Reference Sidorov, Gelbukh, Gómez-Adorno and Pinto2014), allows to measure the similarity of two documents, even when there are no common terms between them, as it exploits the vector embeddings of the corresponding words (i.e., it takes into account that two words might be synonyms).
BP complexity and text similarity across SDGs
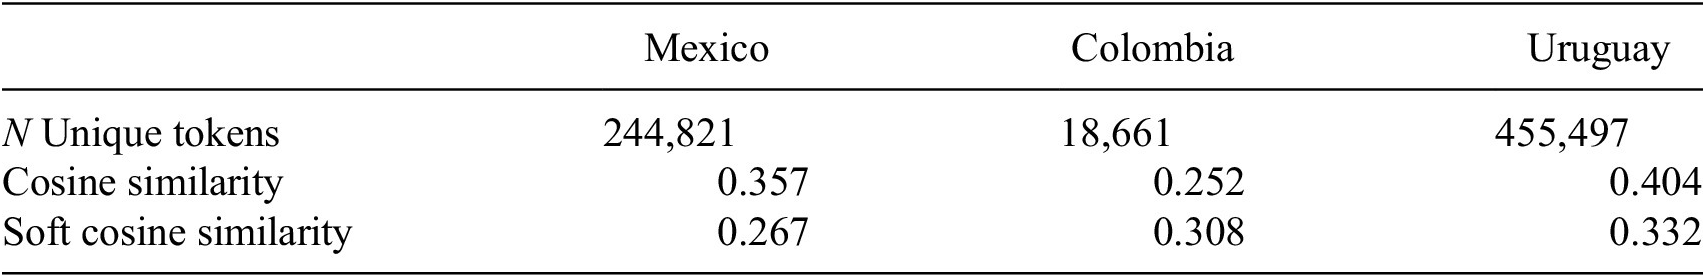
Notes: For cosine similarity and soft cosine similarity, the metrics are first computed for all BPs belonging to the same SDG with respect to the other goals, and then averaged.
The similarity measures are first computed for all BPs belonging to the same SDG with respect to the other goals, and then averaged. It is clear that a high internal consistency and exclusiveness of the information provided by the BP text within each SDG is likely to have a positive impact on the performance of any automatic classifier, as it will be easier to discriminate between programs pertaining to different goals. We notice that the BPs from Uruguay have the highest average similarity across SDG (i.e., more redundant information), both when considering cosine similarity and soft cosine similarity. To provide an overview of how the BPs’ similarity varies across SDGs, we report in Table B.1 of Appendix B the full distribution of the two scores for the three countries. In the next section, we briefly present the methods used in the main analysis, where we predict the SDG label of the BPs through ML.
4. Methods
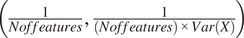
We assess the average accuracy of predicting the BP’s expected SDG label for five different classifiers:Footnote 7 a flexible form of a Support Vector Machine (SVM), one with a linear kernel (Bishop and Nasrabadi, Reference Bishop and Nasrabadi2006),Footnote 8 random forests (Breiman, Reference Breiman2001), a multinomial naive Bayes (NB) (Schütze et al., Reference Schütze, Manning and Raghavan2008), and a complement NB (Rennie et al., Reference Rennie, Shih, Teevan, Karger, Fawcett and Mishra2003). This last classifier was developed to overcome some of the most restrictive assumptions of the standard multinomial NB and it is well-suited for imbalanced data. Given the absence (to the best of our knowledge) of previous analyses on the topic, there is no clear guidance for the configuration of the hyperparameters of the ML algorithms to perform this specific prediction task (i.e., classifying BPs into the SDGs). Hence, for each of the classifiers, we optimize its relevant hyperparameters through a grid search, starting from some standard default values (e.g., the value of 1 for the regularization parameter C in the SVM) and exploring alternatives in their neighborhood, trying to balance the trade-off between assessing several configurations and computing time.Footnote 9
We begin by performing the prediction task for each country separately. The textual features are collapsed at the level of individual BPs, and the resulting text is pre-processed.Footnote 10 The data of each country is randomly split into a train (85% of the observations) and test set (15%), where the train set is also used for the optimization of the hyperparameters of the classifiers. Finally, the text data is converted into their normalized tf-idf representation and used as input for the models. In the next section, we present the results of the prediction task.
5. Analysis and results
Before moving to our findings, it is important to highlight that we focus on predicting a single SDG for each BP. Some programs may address more than one goal, but we only consider those BPs that are linked to a single SDG.Footnote 11 While the complex and interconnected nature of the SDGs is a key feature of the 2030 Agenda and its policy implementations (Zhou et al., Reference Zhou, Moinuddin, Xu, Zhou and Moinuddin2017), as documented by the growing body of research on SDG interlinkages (e.g., Pradhan et al. (Reference Pradhan, Costa, Rybski, Lucht and Kropp2017); Kroll et al. (Reference Kroll, Warchold and Pradhan2019); Lusseau and Mancini (Reference Lusseau and Mancini2019); Asadikia et al. (Reference Asadikia, Rajabifard and Kalantari2021); Warchold et al. (Reference Warchold, Pradhan and Kropp2021, Reference Warchold, Pradhan, Thapa, Putra and Kropp2022)), we adopt a single-membership approach. Hence, we predict a single SDG label for each BP.
The rationale for a single-SDG-labeling approach is that, before using sophisticated multi-labeling methods, it is essential to understand the effectiveness of ML algorithms on simple tasks, as they represent preliminary steps for a country that has just started integrating SDGs into its national development plans and budgetary procedures. This approach also reflects the fact that most countries are still scoping efficient ways to make this connection (Hege et al., Reference Hege, Brimont and Pagnon2019). Thus, an automated framework for an initial, broad categorization might represent a cost-effective solution.
In Table 4, we report the average accuracy across classes (i.e., the SDGs) for the 5 classifiers. First, we note that the linear SVM is consistently the best-performing classifier across the three countries. It achieves an accuracy of more than 90% for both the Mexican and Uruguayan data, and almost 82% for Colombia, which is quite surprising given the short length of the text associated with the BPs (and thus, the less information provided to the classifier).
Single-label classification
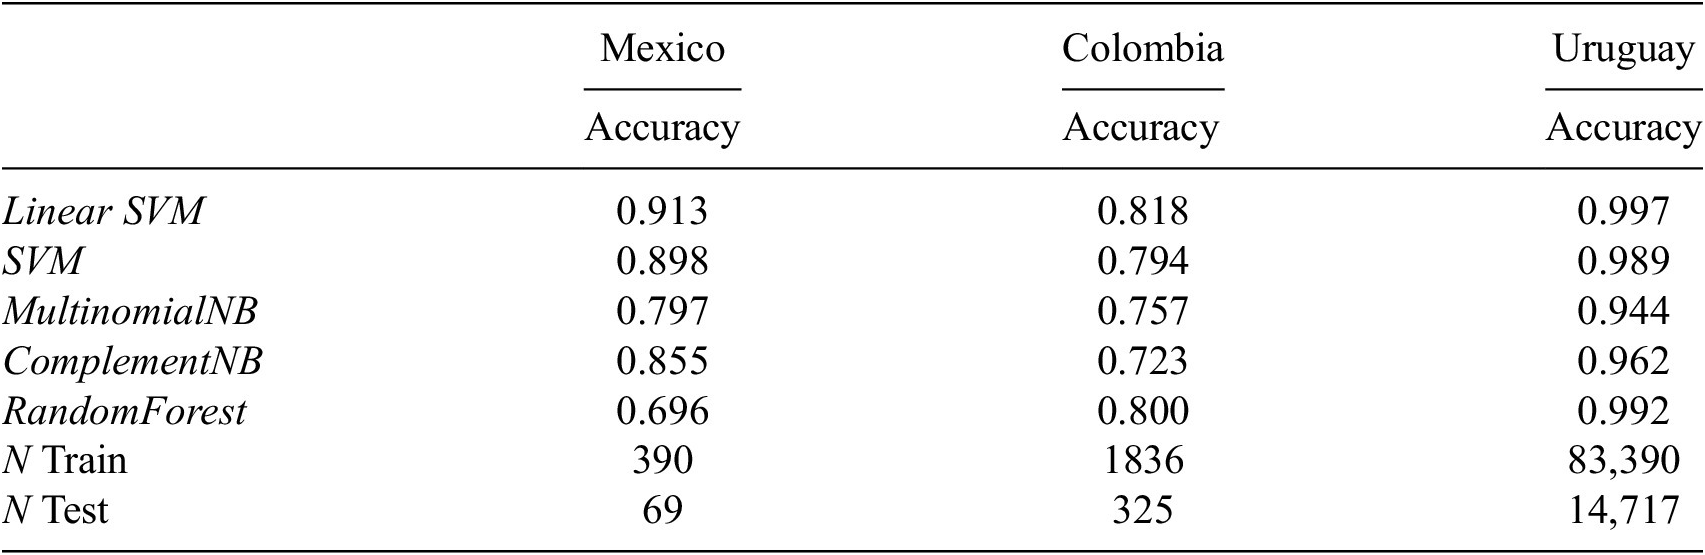
Notes: We report the average accuracy of the classifier across the different SDGs. For Mexico, we exclude SDG 12 and 13 as there is only one BP for each of them. SDG 14 instead, is not represented in the BPs.
To understand the first results, we benchmark them against the LinkedSDGs platform developed by the Statistics Division and the Division for Sustainable Development Goals of the UN Department of Economic and Social Affairs. This web application extracts key concepts and metadata from the texts uploaded and tries to link them with the relevant SDGs. To assess the predictive accuracy of LinkedSDGs, we randomly sample 50 BPs for each country, collapse the features associated with them, and then (without pre-processing the texts), upload the resulting documents to the platform. We consider as predicted label the main SDG identified by the system.
Table 5 reports the accuracy scores across the three countries. It is clear that LinkedSDGs has significantly lower predictive power compared to any of our classifiers. This is particularly true for Mexico, for which the linear SVM achieves an accuracy of more than double than that of LinkedSDGs. In Colombia, the score is more than four times higher.Footnote 12 However, these results should not come as a surprise, as our classifiers have been specifically trained on only relevant textual data describing the BPs, so they are highly domain-specific compared to a general-purpose platform as LinkedSDGs.
Single-label classification: LinkedSDGs

Notes: Samples are made up by the texts of 50 random budget programs, without pre-processing. Classification is performed through the LinkedSDGs application (http://www.linkedsdg.org).
Next, we go one step further and perform the classification task exploiting the data across countries. That is, we train the classifiers using BPs from a given institutional setting (e.g., Mexico) to predict the SDG label of the BPs belonging to a different one (e.g., Uruguay).Footnote 13 We report the results in Table 6. First, we notice that the classifier that tends to score the best across the possible combinations is the complement NB. However, its accuracy is significantly lower compared to the one of our best-performing models in Table 4. We also observe that the Mexican data seems to be the best to train on, and the Uruguayan one the easier to predict. In particular, when we combine these two (training on Mexican BPs and classifying Uruguayan ones), the complement NB achieves an accuracy of almost 80%.
Single-label classification across countries
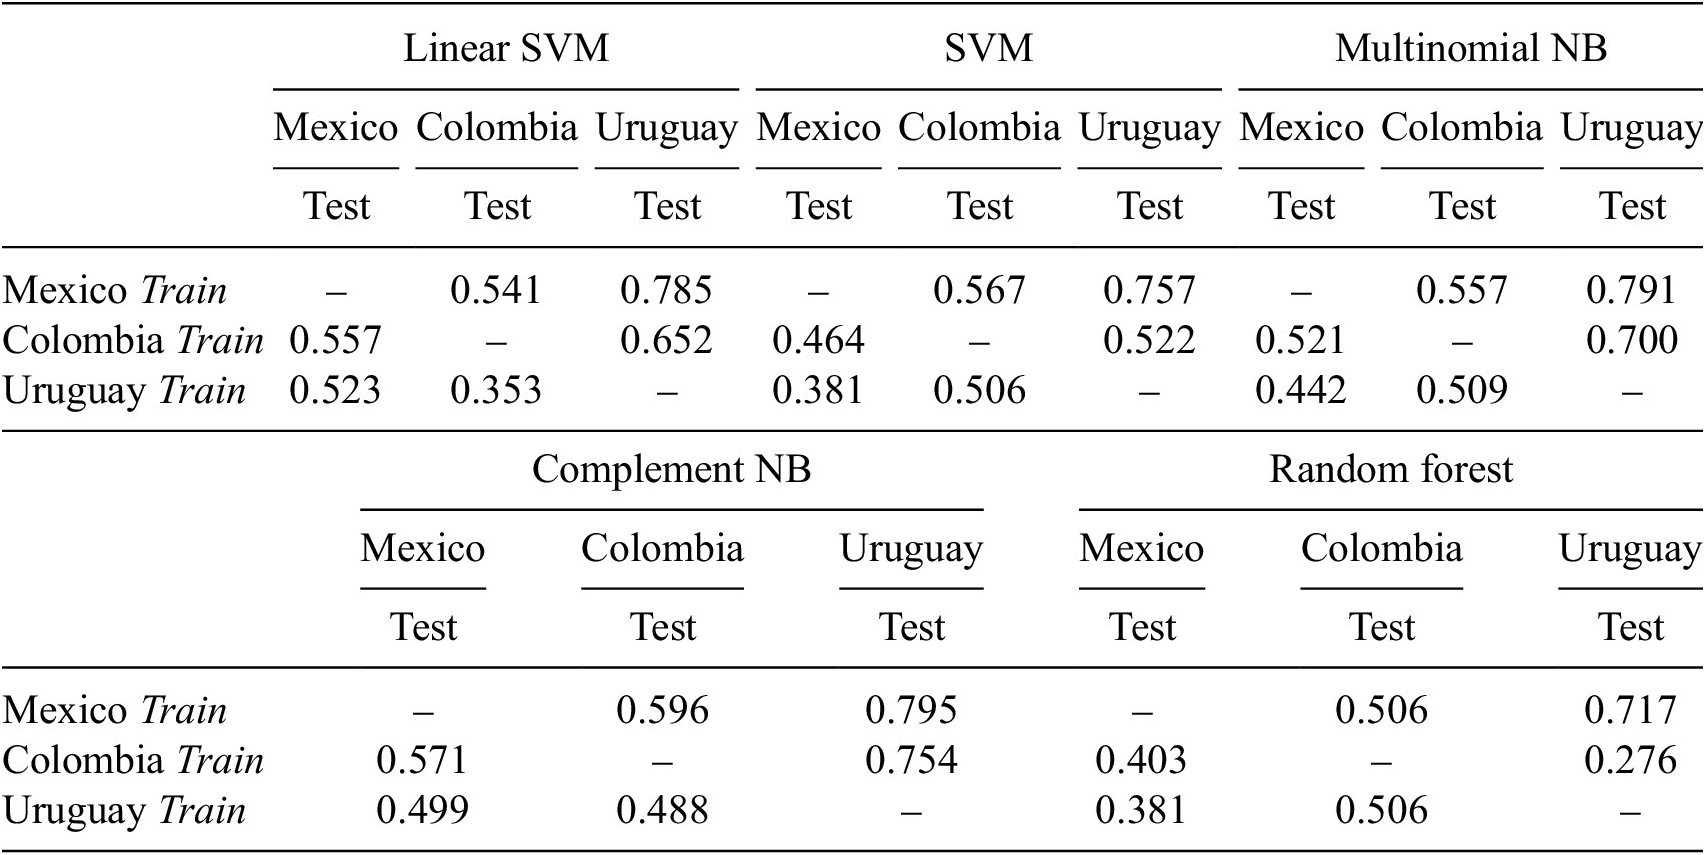
Notes: Whenever the Mexican data are used for training, we exclude SDG 12 and 13 as there is only one BP for each of them. SDG 14 instead is not represented in the BPs. Hence, these SDGs are also not considered in the testing set.
In our last application, we explore the possibility that combining information from multiple countries might enhance the performance of our classifiers when facing unseen data coming from a different source. Hence, we build training sets by randomly selecting BPs from two different countries using the third one as the test set.Footnote 14 Table 7 reports our findings on assessing all possible combinations. Overall we do not observe a generalized (and significant) increase in the accuracy of the classifiers. In fact, some of them perform even worse. For instance, when data from Mexico and Colombia are used to train the linear SVM, the accuracy score is lower when predicting the labels for the Uruguayan BPs, compared to using the Mexican data alone. The complement NB seems to be the best-performing classifier for these cross-country settings. We observe a higher accuracy, but the magnitude of the increase is quite small. In the next section, we reflect on the policy implications for both national governments and international organizations, together with proposing some further applications for SDG research.
Single-label classification merged data
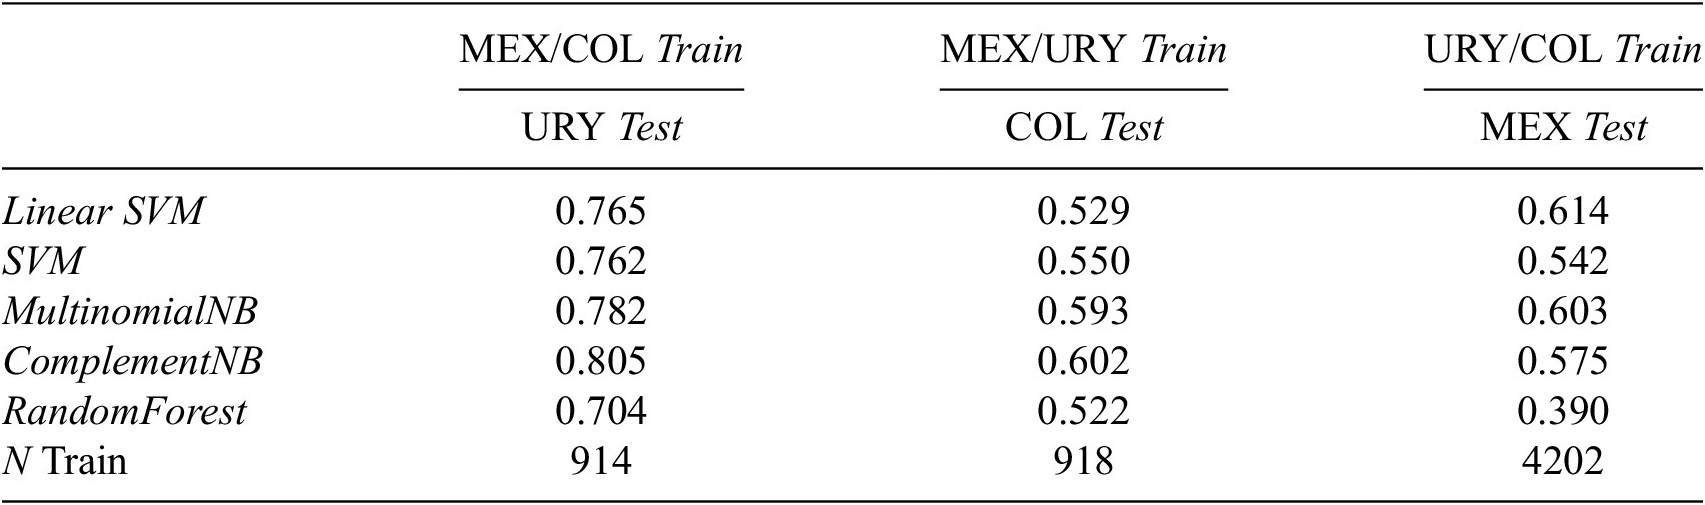
Notes: In all combinations, BPs related to SDGs 12, 13, and 14 are not considered (due to the inclusion of Mexico).
6. Discussion and conclusions
Our study contributes to SDG research by providing the first assessment of the benefits and limitations of NLP techniques to code budget programs (BPs) into the SDGs. Effective SDG-budget tagging is crucial to define baseline public expenditure across development goals, which is a precondition for efficient resource allocation and subsequent policy prioritization. Our findings have important policy implications for both governments trying to integrate SDGs in their planning and budgeting practices, and for international organizations promoting the B4SDGs agenda. From our first set of results, we observe that, by training well-established classifiers in text analysis on an original sample of already labeled BPs, we can predict––with high accuracy––the relevant SDG of new programs. This seems to be the case even when the size of the training sample is not particularly large (e.g., Mexico), and when the text describing the BPs is short (e.g., Colombia). Hence, given an initial investment in setting up an effective labeling system, the coding scheme can easily be scaled to new programs at a minimal cost. This finding praises the efforts of national governments and their ministries trying to establish SDGs-tagging practices, and the support given to them by international organizations such as GIFT and the UNDP.
Our second set of results shows that such efforts are necessary, and that there is little room for “free-riding” on the initial investment of other countries. In other words, when performing the prediction task using BPs belonging to different countries (Table 6), we assess the scenario where a government is trying to automate SDG budget tagging using off-the-shelf coding systems that have been developed in a different institutional setting. The poor performance of the classifiers is not surprising, as the texts describing the programs (i.e., the information through which our models learn” associations) incorporate substantial features of the budgetary culture, process, and institutions that are specific to the country considered. Consequentially, the predictions do not improve even when we try to enhance their quality by exploiting data from additional sources (Table 7).
These findings stress that, for effective SDG budget tagging, there is no one-size-fits-all model, as every SDG taxonomy embodies essential contextual knowledge and contributions from local stakeholders that are difficult to transfer from one institutional setting to another (e.g., see the case of Colombia in Palacios et al. (Reference Palacios, Quiroga, Romero and Ruiz2022)). Hence, our results are in line with the conclusion of Quinn et al. (Reference Quinn, Monroe, Colaresi, Crespin and Radev2010): while text analysis methods can complement and extend substantive knowledge, they should not replace it. The study has also important implications for the broader SDG research agenda. Our findings could be combined with the growing literature on SDGs interlinkages (e.g., Pradhan et al. (Reference Pradhan, Costa, Rybski, Lucht and Kropp2017); Kroll et al. (Reference Kroll, Warchold and Pradhan2019); Lusseau and Mancini (Reference Lusseau and Mancini2019); Asadikia et al. (Reference Asadikia, Rajabifard and Kalantari2021); Warchold et al. (Reference Warchold, Pradhan and Kropp2021, Reference Warchold, Pradhan, Thapa, Putra and Kropp2022)), to identify, at the national level, how a budget program designed to address a specific SDG target can have both positive and negative spillover effects, given the existing synergies and trade-off across development dimensions (Kroll et al., Reference Kroll, Warchold and Pradhan2019). A systemic understanding of potential multiplier effects is key for better decision-making, resource allocation, and policy prioritization (Asadikia et al., Reference Asadikia, Rajabifard and Kalantari2021). In fact, SDG budget tagging together with the insights provided by the literature on SDG interlinkages can support policymakers in designing effective cross-sectoral interventions that leverage and foster existing synergies (Pradhan et al., Reference Pradhan, Costa, Rybski, Lucht and Kropp2017). Furthermore, our NLP framework could be exploited by such studies to assign development indicators to the corresponding SDG targets with a less subjective approach, by leveraging their textual description. This could support the integration of multiple data sources into unified SDG databases, as data selection is still a crucial issue in SDG research (e.g., see Warchold et al. (Reference Warchold, Pradhan, Thapa, Putra and Kropp2022)).
6.1. Limitations
Despite the policy implications of our analysis, the study presents several limitations. First, when labeling BPs we only consider the broader categorization of the 17 goals and not the narrower 169 SDG targets. This choice is partly due to technical constraints. To learn stable patterns in the data and make meaningful predictions, any ML algorithm needs a minimum amount of examples (i.e., BPs in our case) per class. Framing the prediction task in terms of the 169 targets would determine a substantially sparse allocation of the programs across the classes (given that they already have a rather skewed distribution across the goals, as shown in Table 2). This is likely to cause the predictions of the algorithms to be extremely noisy. However, future studies on the subject could address this issue by exploiting a greater availability of SDG target-labeled fiscal data at a granular level.
Second, as mentioned in section 5, we frame the prediction task in terms of single membership. That is, each BP is assigned to a single SDG. While the interconnected nature of the SDGs is a leading feature of the 2030 Agenda, its integration into budgetary and planning practices requires a mature development of the B4SDGs approach (e.g., see Halimatussadiah (Reference Halimatussadiah2020)), whereas we only address the initial challenges faced by a government starting to link SDGs into their national budgetary processes. In addition, a one-dimensional tagging approach can be suitable when the budget data is highly disaggregated (Palacios et al., Reference Palacios, Quiroga, Romero and Ruiz2022). Nonetheless, assessing the performance of ML algorithms for multi-membership classification of fiscal data into the SDGs represents a promising avenue for future research on the topic.
Third, we explore only three institutional settings that, while having their own budgetary culture and practices, are not substantially different. Even if there is variation in terms of their progress towards the SDGs, they do not encompass the whole spectrum. Substantially different levels of development can translate into substantially different capability/incentives to integrate the 2030 Agenda within budgetary and planning practices. Fourth, these countries are not representative of broader geographical regions, as they are all located in Latin America. However, these limitations are partly due to the lack of widespread availability of SDG-labeled fiscal data at the BP level. Hence, we also advocate for an increase in efforts to publish such data. Materializing such efforts could lead governments to exploit a broad set of SDG taxonomies and develop innovative automated approaches to assist the integration of SDGs into their budgetary practices.
6.2. Conclusions
Mapping public programs into the SDGs is crucial for integrating the 2030 Agenda into the budget system, as it represents a preliminary step for consequent financial diagnostics. Such an alignment allows identifying financial gaps and supports the implementation of performance-based budgeting. As a result, we have observed an increasing trend in the number of governments (national and subnational) that are tracking (or are planning to track) their public expenditures according to the 2030 Agenda. As noted by Okitasari and Kandpal (Reference Okitasari and Kandpal2022), in the 2021 round of VNRs, 31 out of 40 countries report undertaking such an effort; an increase of 21% compared to 2020. While a strong political commitment is necessary for a government to approach the B4SDGs paradigm (Hege et al., Reference Hege, Brimont and Pagnon2019), the process of SDG budget tagging also involves a significant investment in terms of administrative capabilities, human resources, and time. Such costs might be exacerbated in developing countries due to poor institutional capacity and sluggish bureaucratic procedures. Under these conditions, the automation of the tagging process through ML might be a cost-effective solution.
In this paper, we have assessed the scope for automatic SDG budget tagging across three different countries, using novel, highly disagreggated SDG-labeled fiscal data and well-established text analysis algorithms. The results show that our classifiers can achieve great accuracy, when scaling an existing SDG taxonomy to new public programs, but perform poorly when trained with data that are not representative of the institutional setting considered. These findings imply that a national government trying to integrate SDGs into its planning and budget practices cannot just rely on AI tools and off-the-shelf coding schemes. The development of an SDG taxonomy requires the engagement of local stakeholders and the integration of contextual expertise, while automated processes can be useful allies in scaling the system and making it sustainable. Given the significant investment that it entails, international development organizations should support national governments in undertaking the process of SDG budget alignment, as it represents a significant step in the global effort to achieve the 2030 Agenda.
Supplementary material
The supplementary material for this article can be found at http://doi.org/10.1017/dap.2023.28.
Funding
The authors acknowledge funding from the Economic and Social Research Council (ESRC). Grant code: ES/T005319/1. The funding source had no involvement in the development of the research.
Competing interest
The authors declare none.
Author contribution
D.G.: Conceptualization (equal), data curation (lead), formal analysis (lead), investigation (lead), methodology (lead), project administration (supporting), visualization (lead), writing – original draft (lead). O.A.G.: Conceptualization (equal), data curation (supporting), formal analysis (supporting), funding acquisition (lead), investigation (supporting), methodology (supporting), project administration (lead), writing – original draft (supporting). G.C.: Data curation (supporting).
Data availability
The data that support the findings of this study are openly available at:
http://www.transparenciapresupuestaria.gob.mx
Code availability
The code developed for the analysis is available upon request.


 Open access
Comments
No Comments have been published for this article.