


Characteristics Of Glacier De Sarennes
Glacier de Sarennes (45°7′ N, 6°8′ E) is located on the south slope of Pic du Lac Blanc (3323 m), to the east of Grenoble, near the ski resort of Alpe d’Huez (Grandes Rousses range). Its area today is about 0.5 km2 as against 1.57 km2 in 1850 (glacier tongue in 1853 situated 1.3 km further downstream). Its length is 1350 m (in 1991), the tongue is at an altitude of 2850 m, the top at 3190 m. The maximum width is 1000 m, and the thickness is no more than 80–100 m. One can observe many moulins 30–40 m deep, draining the meltwater at the glacier surface.
This glacier has been visited by glaciologists for more than a century. The French geologist P. Termier mentioned the name of Sarennes in 1882, and P. R. Bonaparte visited the glacier in 1891. He noted that the tongue of the glacier was stationary. The first scientific observations were conducted in 1905–06 by Grenoble University, with the printing of an accurate map of the Grandes Rousses range (Flusin and others, 1909). Between the two world wars, only a few observations were made and photographs taken (published in 1927). In 1948, the Eaux et Forêts corps decided to take care of a summer field-data collection with winter snow accumulation and summer ablation (Garavel, 1955). This job is today continued by CEMAGREF (Valla, 1989), a scientific research organisation and offshoot of Eaux et Forêts.
In winter, this small glacier is like a huge gauge, accumulating solid precipitation measured at five representative locations marked by poles (Fig. 1). In summer, ablation is generally important, due to the south exposure, and the equilibrium line is often over 3200 m. Mass balance is given by a linear combination of the local mass balance at each pole (coefficient proportional to the glacier area strip represented by the ablation pole). Martin (1978) reconstituted the mass balance with the meteorological data of Grenoble for the 1880–1948 period.
Glaciological Documents
In this work, we used all the available glaciological data, maps and aerial photographs. For the Little Ice Age we used the terrain restitution made in 1995 with the terrain evidence. We also used the bedrock map produced by the radar ice-thickness campaign and the topographic maps from the Institut Géographique National. We digitized the isohypses of the maps and applied Are-Info for volume calculation and determination of sections.
1850 stage
Around 1850, the extension of glaciers in the Alps was at a maximum. Remote traces are still visible, such as a clear bedrock colour contrasting with the surroundings. In 1995, we made the survey and drew the map of the Little Ice Age (Piedallu, 1995). Assuming that the surface of the glacier is clearly defined, the contour lines can be drawn “realistically” or with a rather high delineation or a low one. For further analysis we chose the high delineation of contour lines.
1906 glaciological map
In 1905 and 1906, scientists of Grenoble University mapped the glaciers of the Grande Rousse range at a scale of 1:10 000 with remarkable accuracy. The results were published in 1909 in the first volume of Études Glaciologiques (Flusin and others, 1909). More than 100 points were surveyed with decimetric accuracy, and contour lines of 10 m equidistance

Fig. 1. 1906 map with the fine measurement locations.
Table. 1 Evolution of the main parameters, Glacier de Sarennes, 1850–1991

hd, high delineation; ld, low delineation.
were drawn. The topographical accuracy of this map is higher than 5%. Digitizing errors or positioning errors of the reference points are less than 0.5%.
1950 glaciological map
In 1950, a glaciological map was compiled (Cherrey, 1951), but despite a good topographic accuracy (3%), the glacier delimitation is so inaccurate that it could not be used for this study.
1959 glaciological map
This document (de Crecy, 1963) is the product of two field campaigns in 1956 and 1959. The global accuracy is rather poor (error 17.5%) but it was possible to correct the position of the glacier on the topographic map, so we used this map for the study.
1981 aerial picture analysis
Since 1970, the Division Nivologie of CEMAGREF has surveyed the main glaciers of the French Alps by means of aerial photographs taken every 3 years. The Sintegra office produced an orthophoto image and mapped the glacier

Fig. 2. Glacier de Sarennes area evolution, 1850–1991.

Fig. 3. Surface, perimeter, volume and thickness evolution of Glacier de Sarennes, 1850–1991.
with the 1981 photo at a scale of 1:5000 (Valla, 1982) as well as the hydrological basin defined by the gauging station at an elevation of 2700 m. Because of a good accuracy (error 1%), we decided to take this map as a reference for the glacier basin; but the precision of the ice boundaries was enhanced using other documents.
1991 aerial picture mapping
For the newest map, we used the Sintegra 1991 aerial picture. When the photograph was taken, the glacier was completely snowless and the delineation of the ice surface clearly visible. The mapping (Girard, 1993) was done by Savoie University with a 5% precision.
1992 bedrock map
In 1991, a seismic sounding campaign was conducted by the Laboratoire de Glaciologie du CNRS, Grenoble. The maximum depth of the ice was found to be around 100 m and it was decided to carry out a radar campaign with the EPF Zurich glaciology laboratory. As a result, over 80 ice thickness points were measured on the glacier in 1992 (Funk and others, 1993). Using the 1981 map, the bedrock map was obtained with an accuracy of about 10 m, in accordance with the radar precision and the interpolation computer software.
Analysis Of The Glaciological Stages And Evolution
Working with the Geographic Information System (Arc-Info) (Berger, 1992), we constructed the three-dimensional map for each stage, and extracted the main parameters with their evolution during the last two centuries (Table 1; Fig. 2). Figure 3 shows the graphical representation of these values.
Around 1850 was the stage of maximum extension, with an area of more than 1.5 km2 (156.5 ha, three times the present value) and a volume of 79 × 106 m3 (five times the 1991 value) according to the high-delineation assumption. The low delineation is less realistic, and the difference between the assumptions is 10% (7 × 10⁶ m3).
The average thickness (50 m) of the glacier is less than it is half a century later (60 m) because the surface gained during the last Little Ice Age is rather thin.
In 1906 the glacier area extent is a little more than 1 km2 (108.5 ha), and the glacier surface has been in constant retreat
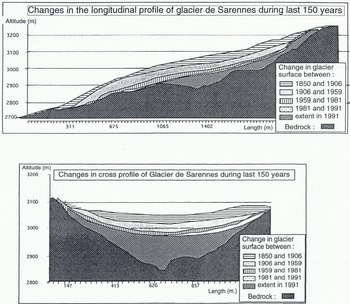
Fig. 4. Longitudinal and cross profiles visualizing Glacier de Sarennes length and thickness variations between 1850 and 1991.
for half a century (the front position was 900 m lower in 1853 than the 1906 front position). The perimeter is 6.4 km, and we calculated a volume of 63 × 106 m3. The maximum thickness is 154 m, just in the middle of the glacier near today’s measurement location 3, and the glacier’s average thickness is about 60 m, 10 m higher than in 1850.
In 1959 the surface has reduced to 78 ha, whereas the perimeter, 7.1 km, has slightly increased, as an effect of the break-up of the glacierized area. The volume is reduced, to 30 × 106 m3. The thickness at the glacier centre is about 115 m, whereas average thickness is 39 m.
In 1981 the glacier is even smaller, with a surface of 67 ha and a perimeter of 6.3 km. Its volume has reduced to 22 × 106 m3, the maximum thickness is 98 m and the average thickness 33 m. The shrinkage started at the end of the Little Ice Age is still active and will be accelerated for the next 15 years.
In 1991, despite 4 years of mass balance near zero, the surface is only 52.5 ha, but the perimeter is about the same. 6.1 km. The volume continues to be reduced, at 16 × 106 m3, and the average thickness is on the order of 30 m (maximum thickness 94 m). Since this date, drastic negative mass balances between 1991 and 1994 have amplified the shrinkage.
Longitudinal and cross-sections
Figure 4 shows the changes in the surface of Glacier de Sarennes along two profiles (Fig. 2) over the last 150 years. The longitudinal profile depicts the drastic retreat of the glacier between 1850 and 1906. The cross-section illustrates the loss of thickness, and both sections highlight the significant loss of ice: today, we can observe only one-fifth of the 1850 glacier volume! We can see the sagging of the surface especially in the centre of the glacier.
Based on the bedrock map, we can predict that frontal retreat will be rather small even with further ice loss. The glacier has quite a significant ice thickness just uphill of its actual front position. If the retreat continues, we can expect two small lakes in the centre of the cross-section in a few decades.
Global melt-rate evolution
During the studied period 1850–1991, the volume of the glacier changed quite rapidly but not regularly. The global net loss through melting is calculated for the four periods shown in Table 2, which also gives mean annual values.
Table. 2 Net loss through melting (ice and w.e.), 1850–1001, calculated for four different periods, Glacier de Sarennes

Between 1850 and 1906 the glacier lost 14 × 106 m3 in 56 years, an annual melting rate of 250 000 m year. Between 1906 and 1950, this value increased to 660 000 m3 year−1; for the period 1959–81, it decreased to 360 000 m3 year−1 due to a series of slightly negative mass balances. However, despite favourable mass balances for the years 1981–84, the 1981–91 period shows high net loss trough melting of 600 000 m3 year−1. The southern exposure, the decreasing area of the glacier and its shallow vertical extent cause a rapid retreat of the glacier since 1981. As a result, during the 1981–91 decade, with a net melt rate of 90 cm w.e. year−1, the glacier had a specific melt rate five times higher than during the 1850–1906 period (17 cm w.e. year−1). It seems that the glacier, reduced in size, is more sensitive to high summer air temperature•.
Conclusion
For the first time in France, thanks to valuable old documents, volumetric variation of a small glacier has been quantified over a period of one and a half centuries. The loss of ice is quite remarkable: the glacier volume in 1991, 16 × 106 m3, is only 20% of that in 1850 or 25% of that in 1906. The tongue retreated more than 1 km, and the surface area shrank from 1.6 to 0.5 km2. If the climate trend observed during the last decade (1981–91) continues, we expect a short remaining lifetime for Glacier de Sarennes: more or less half a century.


