


Introduction
The significance of coastal and estuarine areas for understanding former human life and palaeolandscapes is now recognised internationally. For example, in the context of present-day climate warming and sea-level rise, the study of the response of coastal and estuarine palaeolandscapes to postglacial sea-level rise is particularly relevant (e.g. Boski et al., Reference Boski, Moura, Veiga-Pires, Camacho, Duarte, Scott and Fernandes2002; Woodruff et al., Reference Woodruff, Irish and Camargo2013). The large preservation potential of these sedimentary environments, on the transition of the terrestrial and marine environment, makes them ideal for studying landscape evolution through time. Research into the intertidal area of the Severn Estuary, SW England (Bell, Reference Bell2007), for instance, has provided the first human Mesolithic footprints, while in Roman and medieval times these dynamic estuarine landscapes were intensively exploited (Rippon, Reference Rippon2000). In Romney Marsh in SE England, one of the largest coastal wetlands in Britain, research has allowed reconstruction of the landscape evolution and human exploitation from later prehistory to the medieval period (Rippon, Reference Rippon, Long, Hipkin and Clarke2002). In the Netherlands many studies have been carried out in coastal and estuarine/fluvial wetlands, ranging from Zeeland in the southwest to the Wadden Sea area in the north, unravelling the geographical, morphological and environmental changes of these landscapes through time and the impact on human occupation (e.g. Van der Spek & Beets, Reference Van der Spek and Beets1992; Vos & de Wolf, Reference Vos and de Wolf1993; Vos & van Heeringen, Reference Vos, van Heeringen and Fischer1997; Bos et al., Reference Bos, Huisman, Kiden, Hoek and van Geel2005; Hijma & Cohen, Reference Hijma and Cohen2011; Vos & Knol, Reference Vos, Knol and Vos2015; Vos et al. Reference Vos, de Koning, van Eerden and Vos2015).
In Flanders, systematic Quaternary geological, sedimentological and palaeoecological research on fluvial and coastal wetlands has been carried out for a number of decades (e.g. De Muynck, Reference De Muynck1976; Augustyn, Reference Augustyn1977, Reference Augustyn1985; Baeteman & Verbruggen, Reference Baeteman and Verbruggen1979; Heyse & De Moor, Reference Heyse and De Moor1979; Baeteman Reference Baeteman1991, Reference Baeteman1999; Denys, Reference Denys1993), and many geomorphological, geological and soil maps have been made of Belgium including its wetlands (e.g. Jacobs et al., Reference Jacobs, De Ceukelaire, De Breuck and De Moor1993, Reference Jacobs, Polfliet, De Ceukelaire and Moerkerke2010; De Moor & van de Velde, Reference De Moor and van de Velde1995; Bogemans Reference Bogemans1997; AGIV, 2000; Adams et al., Reference Adams, Vermeire, De Moor, Jacobs, Louwye and Polfliet2002). Moreover, early reconstructions of the historical landscape of the Scheldt polders started in the 1960s (e.g. Snacken, Reference Snacken1964; Mijs, Reference Mijs1973; Guns, Reference Guns1975), and research on Late Pleistocene and Holocene deposits has been carried out here since the late 1980s (e.g. Meire & Kuijken, Reference Meire and Kuijken1988; Kiden, Reference Kiden and Baeteman1989; Verbruggen et al., Reference Verbruggen, Denys, Kiden, Berglund, Ralska-Jasiewiczowa and Wright1996; Kiden & Verbruggen, Reference Kiden, Verbruggen, Bourgeois, Crombé, De Mulder and Rogge2001). However, systematic geoarchaeological research into onshore wetlands in Flanders is quite a recent development. Large-scale interdisciplinary wetland research in the Scheldt floodplain was often conducted in anticipation of large infrastructural works such as Antwerp harbour expansion (e.g. Minnaert & Verbruggen, Reference Minnaert and Verbruggen1986; Gelorini et al. Reference Gelorini, Meersschaert and Van Roeyen2003, Reference Gelorini, Verleyen, Verbruggen and Meersschaert2006; Perdaen et al. Reference Perdaen, Sergant, Crombé and Crombé2004; Crombé, Reference Crombé2005; Deforce et al. Reference Deforce, Gelorini, Verbruggen, Vrydaghs and Crombé2005; Meers-schaert et al. Reference Meersschaert, Van Roeyen and Verbruggen2006; Deforce, Reference Deforce2011), nature development and water management projects (Bogemans et al., Reference Bogemans, Meylemans, Jacobs, Perdaen, Storme, Verdurmen and Deforce2012; Meylemans et al., Reference Meylemans, Bogemans, Storme, Perdaen, Verdurmen and Deforce2013).
Drilling techniques for mapping and assessing the buried archaeological and palaeoenvironmental heritage were applied in Flanders for the first time in the mid-1990s, for example in the Verrebroek dock in the Scheldt polders (Crombé & Meganck, Reference Crombé and Meganck1996). Since then further testing mainly in the Scheldt floodplain and polders has resulted in more refined drilling techniques and methods (e.g. Bats, Reference Bats, Barber, Clark, Cressey, Crone, Hale, Henderson, Housley, Sands and Sheridan2007; Crombé & Verhegge, Reference Crombé and Verhegge2015). Recently, a new step forward was taken in prehistoric landscape reconstruction for archaeological purposes with the PhD research by Verhegge (Reference Verhegge2015). He developed an efficient approach based on near-surface geophysical and geotechnical techniques to map the prehistoric landscape of the Scheldt polders, and modelled the peat growth and the subsequent drowning of the landscape. However, his research only focused on a small test area (Doelpolder Noord), and a broader regional approach was still lacking. A second new development was the reconstruction of intertidal landscape response since the 16th century by Jongepier et al. (Reference Jongepier, Soens, Temmerman, Missiaen and De Wit2015a, Reference Jongepier, Wang, Missiaen, Soens and Temmermanb). Previously this had only been attempted on short timescales, mostly less than 100 years. Using a combination of historical maps and analysis of present-day soil texture this allowed mapping of the step-wise evolution (location of tidal channels, tidal flats and salt marshes) over the last c. 400 years of the Waasland Scheldt polders marked by de- and re-embankment (Jongepier et al., Reference Jongepier, Wang, Missiaen, Soens and Temmerman2015b).
The Waasland Scheldt polders were selected as the study area for three reasons. First, they are known to be rich in well-preserved prehistoric sites and landscapes, as demonstrated by recent research (e.g. Crombé, Reference Crombé2005). Covered by 1–4m of clayey and peaty deposits lies a well-preserved palaeo coversand landscape which was mainly formed near the end of the latest Ice Age; within this palaeolandscape many prehistoric camp sites have been discovered. Gradually this landscape was influenced by rising groundwater due to sea-level rise, which turned the area into a continuously expanding peat marsh. A second reason was the strong intertwining of landscape and human occupation during medieval and post-medieval times, especially in view of the great inundations of the 14th–16th centuries. Both direct and indirect human interventions greatly influenced the (often very rapid) transformation of the landscape. Lastly, the Scheldt polders are under imminent threat from commercial activities. Due to the continuous expansion of Antwerp harbour, only a relatively small part of the original Waasland Scheldt polders still remains. A new dock is planned in this area within the next few years, while on both sides of the border the coastal realignment in the Hedwige and Prosper polder will affect the last relicts of this drowned landscape, for example through local erosion of channels, but most of the area will be further covered and preserved under new estuarine deposits.
The main objective of this paper is to map the palaeolandscape evolution of the Waasland Scheldt polders from the Late Glacial – early Holocene to the present time. This is done on two different timescales: (1) a Holocene timescale, resulting in a series of palaeogeographical reconstructions mainly based on geotechnical, geological and archaeological data; and (2) a post-medieval timescale, resulting in a series of landscape reconstructions mainly based on historical maps, land registers and data of the soil mapping. Where possible, palaeolandscape reconstructions are also included, based on various environmental data (pollen analyses, plant remains, etc.). By combining these different techniques and methodologies we were able to obtain a coherent picture of the drowning of the dynamic landscape of the Waasland Scheldt polders since the Late Glacial, and the effects of this drowning on the successive stages of human settlement and land-use through time.
Study area
General background
The Waasland Scheldt polders consist of a flat, low-lying region on the western bank of the river Scheldt, in NW Belgium (Fig. 1). The western and eastern limits of the study area are respectively formed by the Dutch/Belgian border and the river Scheldt, with its southern limit situated at the edge of the Waasland subcuesta. The current landscape of the Waasland Scheldt polders is highly influenced by the proximity of the North Sea and the river Scheldt. The delicate balance between sea-level rise, tidal regime and river sedimentation during the Holocene resulted in different transgressive and regressive events. Adding to this since the Middle Ages, the impact of man on the landscape has become dominant by the building of dikes and rebuilding after sporadic inundations. This battle between man and water left many traces still visible in the landscape.
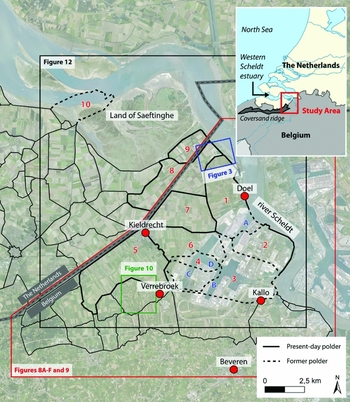
Fig. 1. Overview of the Waasland Scheldt polders in northern Belgium (background map from Google Earth©). The red and black boxes indicate respectively the extent of the Holocene (Fig. 8) and the post-medieval maps (Fig. 12). Blue and green boxes mark the extent of Figures 3 and 10. The grey dashed line marks the border between Belgium and the Netherlands. Full and dashed black lines respectively mark existing and former dikes. Numbers and letters refer to sites (polders and docks) discussed in the text. 1 = Doelpolder; 2 = Sint-Annapolder; 3 = Kallopolder; 4 = Polder van Haendorp; 5 = Konings-Kieldrechtpolder; 6 = Oud-Arenbergpolder; 7 = Nieuw-Arenbergpolder; 8 = Prosperpolder; 9 = Hedwigepolder; 10 = Polder van Namen; A = Deurganck dock; B = Vrasene dock; C = Verrebroek dock; D = Waasland dock.
The present-day Western Scheldt forms the southern part of the Rhine–Meuse–Scheldt region, and evolved from the Honte tidal basin during the Middle Ages (Vos & van Heeringen, Reference Vos, van Heeringen and Fischer1997; De Brouwer et al., Reference De Brouwer, Crosato, Dankers, van Duin, Herman, van Raaphorst, Stive, Talmon, Verbeek, de Vries, van der Wegen and Winterwerp2001). Just north of the Waasland Scheldt polders lies the only remaining extensive tidal flat in the Western Scheldt, the (Drowned) Land of Saeftinghe (Fig. 1). It consists of approximately 3000ha of salt marshes, mudflats and sand flats, cut by numerous tidal channels and creeks (e.g. Dijkema et al., Reference Dijkema, Beeftink, Doody, Gehu, Heydemann and Rivas Martinez1984; Meire & Kuijken, Reference Meire and Kuijken1988; Missiaen et al., Reference Missiaen, Slob and Donselaar2008; Wang & Temmerman, Reference Wang and Temmerman2013).
The present surface elevation in the Waasland Scheldt polders varies roughly between c. 0.5 and 6m TAW (Belgian datum approximate to lowest astronomical tide (LAT) at Ostend) (see Fig. 2). This implies that the majority of this region would be flooded (sometimes even at low tide) in the absence of dikes. In the Early Middle Ages (AD 500–1000) this region was a peaty wetland environment that progressively changed into dry (occupied) land due to human-induced drainage and also (at a later stage) the creation of polders (Snacken, Reference Snacken1964; Mijs, Reference Mijs1973; Augustyn, Reference Augustyn1977; Soens, Reference Soens, Thoen, Borger, De Kraker, Soens, Tys, Vervaet and Weerts2013). The low altitude of the land is largely the result of the drainage of the peat (in addition to peat extraction) with subsequent subsidence of the land. The lowest altitudes are often related to old creeks, that either still contain water or have dried up. In general the younger polders have a higher elevation as they silted up during a longer period of time and land subsidence started later (De Kraker, Reference De Kraker2006; Jongepier et al., Reference Jongepier, Wang, Missiaen, Soens and Temmerman2015b; Vos, Reference Vos2015). Due to the continuous expansion of Antwerp harbour the polder landscape is only in parts preserved. The construction of large docks and adjacent industrial areas locally increased the original elevation by up to 10m (see Fig. 2).

Fig. 2. Distribution of data used to reconstruct the Holocene evolution of the Waasland Scheldt polders (each dot represents a sediment core, archaeological augering or CPT). Background elevation data (in m NAP and TAW) from AGIV (Agentschap voor geografische informatie Vlaanderen) ©. Dark blue dots indicate data points that reach the pre-Holocene deposits. Light blue dots indicate data points that were too shallow to reach the top of the Pleistocene deposits. Green dots indicate locations of 14C samples (after Verhegge et al., Reference Verhegge, Missiaen, Van Strydonck and Crombé2014). The black rectangle indicates the location of the peat/clay sequence at Doel-Deurganck dock that was used for multi-proxy palaeoenvironmental analysis. The white dashed line marks the border between Belgium and the Netherlands.
Evolution of the river Scheldt
At the end of the last glacial (c. 30–14.5ka cal BP) the river Scheldt formed part of a braided river system that drained through the wide Flemish valley towards the west and north (Kiden & Verbruggen, Reference Kiden, Verbruggen, Bourgeois, Crombé, De Mulder and Rogge2001). The braided rivers were marked by wide, but shallow, mostly sandy river channels with seasonally variable water levels (Kiden & Verbruggen, Reference Kiden, Verbruggen, Bourgeois, Crombé, De Mulder and Rogge2001; Kiden, Reference Kiden2006). The sparse tundra vegetation cover created a surface extremely susceptible to wind erosion (Verbruggen et al., Reference Verbruggen, Denys, Kiden, Berglund, Ralska-Jasiewiczowa and Wright1996) which led to the formation of local coversand ridges (Heyse & De Moor, Reference Heyse and De Moor1979), a process which continued during the cold Dryas stadials of the Late Glacial (Crombé et al., Reference Crombé, Van Strydonck, Boudin, Van den Brande, Derese, Vandenberghe, Van den Haute, Court-Picon, Verniers, Gelorini, Bos, Verbruggen, Antrop, Bats, Bourgeois, De Reu, De Maeyer, De Smedt, Finke, Van Meirvenne and Zwertvaegher2012). One of these coversand ridges, the Maldegem–Stekene ridge (3–4m high and 2–3km wide; see inset Fig. 1), gradually dammed the Flemish Valley, forcing the rivers to follow a new course (Kiden, Reference Kiden, Starkel and Thornes1991; Kiden & Verbruggen, Reference Kiden, Verbruggen, Bourgeois, Crombé, De Mulder and Rogge2001; Crombé et al., Reference Crombé, De Smedt, Davies, Gelorini, Zwertvaegher, Langohr, Van Damme, Demiddele, Van Strydonck, Antrop, Bourgeois, De Maeyer, De Reu, Finke, Van Meirvenne and Verniers2013). (This coversand ridge ran over a much larger distance than its name seems to suggest: from the North Sea coast (Gistel) to the Waasland Scheldt polders (Verrebroek) (see Fig. 1).) Also the river Scheldt established a new (eastern) route, breaching through the cuesta near Antwerp, possibly using an existing depression in the cuesta (Kiden, Reference Kiden, Starkel and Thornes1991), towards the Rhine–Meuse valley.
Rising temperatures during the Late Glacial (14.5–11.5ka cal BP) caused major hydrological changes, affecting the discharge, regime and sediment load of the river systems (Kiden, Reference Kiden, Starkel and Thornes1991; Verbruggen et al., Reference Verbruggen, Denys, Kiden, Berglund, Ralska-Jasiewiczowa and Wright1996; Bogemans et al., Reference Bogemans, Meylemans, Jacobs, Perdaen, Storme, Verdurmen and Deforce2012; Crombé et al., Reference Crombé, De Smedt, Davies, Gelorini, Zwertvaegher, Langohr, Van Damme, Demiddele, Van Strydonck, Antrop, Bourgeois, De Maeyer, De Reu, Finke, Van Meirvenne and Verniers2013; Meylemans et al., Reference Meylemans, Bogemans, Storme, Perdaen, Verdurmen and Deforce2013). The braided pattern of the river Scheldt changed into a large-scale meandering pattern, incising the previously infilled Pleistocene topography (Verbruggen et al., Reference Verbruggen, Denys and Kiden1991; De Moor & van de Velde, Reference De Moor and van de Velde1995; Bogemans, Reference Bogemans1997). At the start of the Holocene (c. 11.5ka cal BP) climatic warming resulted in an increasingly dense vegetation cover, decreasing the river discharge and sediment transport (Kiden & Verbruggen, Reference Kiden, Verbruggen, Bourgeois, Crombé, De Mulder and Rogge2001). At this time the river Scheldt still drained towards the north into the Rijn/Maas valley (Vos & van Heeringen, Reference Vos, van Heeringen and Fischer1997).
Around 7400–6300 cal BP the river Scheldt established a new northwesterly route towards the North Sea through the Eastern Scheldt (Oosterschelde) (Kiden, Reference Kiden2006). This change of the river's position and the further rising sea level caused the Lower Scheldt to turn brackish and to experience tidal influence; it is the furthest marine incursion for the Lower Scheldt during the middle Holocene (Kiden, Reference Kiden2006). From roughly 5700 cal BP, sea-level rise started to slow down and the tidal influence in the Lower Scheldt disappeared until the Early Middle ages.
At least until the Early Middle Ages the river Scheldt discharged through the Eastern Scheldt, a peat-covered ridge northwest of the Land of Saeftinghe blocking a more western course (Van Rummelen, Reference Van Rummelen1965; Vos, Reference Vos2015). The connection between the Honte tidal basin (the precursor of the Western Scheldt) and the river Scheldt east of Saeftinghe most likely came into existence in the 9th century AD (Leenders, Reference Leenders1986; Vos & van Heeringen, Reference Vos, van Heeringen and Fischer1997). During the 11th and 12th centuries the Honte sea branch gradually enlarged, probably as a result of various floods (Gottschalk, Reference Gottschalk1984). Until the 15th century, however, the Honte connection (now called Western Scheldt) remained very shallow and navigation was only possible during high tide (Brand, Reference Brand1983). Storm surges in the 15th and 16th centuries resulted in large-scale inundations and an increase in the tidal regime of the Western Scheldt. This led to a shift in the watershed between the Western and Eastern Scheldt, the Western Scheldt now becoming the main branch of the river Scheldt (van der Spek, Reference Van der Spek1994; Vos & van Heeringen, Reference Vos, van Heeringen and Fischer1997; Vos, Reference Vos2015).
Geological setting
In the Waasland Scheldt polders the Quaternary deposits rest on Neogene sediments which consist largely of sandy deposits (Formations of Lillo and of Kattendijk), covering thick clay beds of Oligocene age (Formation of Boom (Member of Putte)) (Jacobs et al., Reference Jacobs, De Ceukelaire, De Breuck and De Moor1993, Reference Jacobs, Polfliet, De Ceukelaire and Moerkerke2010). The Quaternary deposits are less than 5m thick in the southwest and increase up to a thickness of 25–30m in the northeast.
The Quaternary stratigraphy of the Waasland Scheldt polders is complex, and over the years several subdivisions have been described and proposed for different areas (see De Moor & van de Velde, Reference De Moor and van de Velde1995). The Quaternary deposits in the Waasland Scheldt polders were all deposited in a dynamic environment, implying much lateral variation within the same depositional unit. Consequently, these deposits have been catalogued into units based on the following criteria adapted from De Moor (Reference De Moor2002): (1) the lithostratigraphy (including lateral extent), (2) the chronostratigraphy, (3) the lithology and sedimentology of the sedimentary facies, and (4) the genesis of the deposit and indications for its palaeoenvironment (see Methodology section).
The oldest Quaternary deposits in the study area are Middle Weichselian sandy river deposits. They are only observed in the eastern and extreme western part of the study area. They consist of fine to coarse river sands that were deposited by a braided river system in a periglacial environment c. 30,000 years ago De Moor & van de Velde, Reference De Moor and van de Velde1995; Bogemans, Reference Bogemans1997; Adams et al., Reference Adams, Vermeire, De Moor, Jacobs, Louwye and Polfliet2002). In the central part of the study area Late Glacial and Holocene deposits lie directly on top of the Neogene formations.
The covering Quaternary unit consists of Late Glacial aeolian sand deposits (marine istope stage 2, c. 30–15ka cal BP). During this period the climate was still very cold and windy, the vegetation cover was limited and a thin layer of sand (on average 2m thick) was deposited over the entire Waasland Scheldt area (De Moor & van de Velde, Reference De Moor and van de Velde1995; Bogemans, Reference Bogemans1997; Adams et al., Reference Adams, Vermeire, De Moor, Jacobs, Louwye and Polfliet2002), similar to many other regions in NW and central Europe (e.g. Kasse, Reference Kasse2002).
The Pleistocene coversand deposits in the Waasland Scheldt polders are locally overlain by Late Glacial / early Holocene meandering river deposits consisting of one, sometimes two, fining-upward cycles (from fine sand to silt/clay) and ranging in thickness between 2 and 5m (Bogemans, Reference Bogemans1997). In other, less energetic parts of the floodplain, clay was sometimes deposited (De Moor & van de Velde, Reference De Moor and van de Velde1995).
The lowermost Holocene deposits consist of (dark) brown peat. Most of the basal peat accumulated in a marsh environment along the Scheldt river and estuary. With time, peat also started to grow in higher locations. The total thickness of the peat deposits ranges roughly between 0.1 and 6m. In the (north)eastern part of the Waasland Scheldt polders, the basal peat is covered by a grey to almost black clay (occasionally sandier), which often contains peat fragments. This sediment was deposited during the marine incursion of the middle Holocene (around 6000 cal BP) which changed the low-lying western bank of the river Scheldt into an estuarine tidal landscape (Minnaert & Verbruggen, Reference Minnaert and Verbruggen1986; Verbruggen & Denys, Reference Verbruggen and Denys1995; Gelorini et al., Reference Gelorini, Verleyen, Verbruggen and Meersschaert2006; Deforce, Reference Deforce2011; Deforce et al., Reference Deforce, Bastiaens and Crombé2014a). In some places this marine incursion eroded the basal peat.
The peat deposits are overlain and locally eroded by a sequence of late Holocene estuarine sandy and clayey sediments, often with remains of organic matter or marine shell fragments, that was deposited in a tidal flat environment (Kiden & Verbruggen, Reference Kiden, Verbruggen, Bourgeois, Crombé, De Mulder and Rogge2001; Kiden, Reference Kiden2006). Consequently there is a lot of lateral variability within this deposit ranging from a thickness of roughly 5cm up to 10m. The most recent sediments consist of late and post-medieval flood deposits made up of (often organic-rich) clay, which are locally more sandy towards the base.
Occupational history
The Waasland Scheldt polders are known to be rich in archaeological remains, especially dating back to prehistoric and medieval times (Crombé, Reference Crombé2005; Meersschaert et al., Reference Meersschaert, Van Roeyen and Verbruggen2006). During the last decades various archaeological salvage excavations in the vicinity of Doel and Verrebroek (for location see Fig. 1), conducted in the context of harbour expansion, have revealed a number of well-preserved prehistoric settlements, all located on the tops and flanks of Upper Pleistocene sand ridges (Crombé, Reference Crombé2005). The oldest remains date back to the Final Palaeolithic and Early Mesolithic, when the landscape was still a largely dry environment (Crombé et al., Reference Crombé, Sergant, Robinson and De Reu2011, Reference Crombé, De Smedt, Davies, Gelorini, Zwertvaegher, Langohr, Van Damme, Demiddele, Van Strydonck, Antrop, Bourgeois, De Maeyer, De Reu, Finke, Van Meirvenne and Verniers2013). A series of sites dating back to the Mesolithic–Neolithic transition (Crombé, Reference Crombé2005; Sergant et al., Reference Sergant, Crombé and Perdaen2006), and attributed to the Swifterbant culture (Crombé et al., Reference Crombé, Sergant, Robinson and De Reu2011), are contemporaneous with a period of increased tidal influence (Verhegge et al., Reference Verhegge, Missiaen, Van Strydonck and Crombé2014).
So far no direct archaeological proof of human activity has been found that dates from the Middle Neolithic to the Middle Ages, when the area was covered by large fens and peat bogs, but archaeological records from nearby locations in the southwestern Netherlands indicate that occupation took place even in these wet situations (De Clercq, Reference De Clercq2009; De Clercq & Van Dierendonck, Reference De Clercq and Van Dierendonck2009). For instance, near Borsele a Roman settlement was discovered on top of the peat (Sier, Reference Sier2003). At Colijnsplaat in the Oosterschelde estuary and at Serooskerke, Roman occupation was attested at the top of the peat (De Clercq & Van Dierendonck, Reference De Clercq and Van Dierendonck2009; Dijkstra & Zuidhoff, Reference Dijkstra and Zuidhoff2011). According to Vos & van Heeringen (Reference Vos, van Heeringen and Fischer1997) the oldest occupation of the peat landscape occurred along the edges of the estuarine system and can be dated back to the early Iron Age (roughly 2600 BP).
The medieval occupational history of the Waasland Scheldt polders has not been completely established so far. Historical sources inform us of a gradual intensification of land use in the 12th century, starting from the Waasland subcuesta in the south and the Pleistocene sand ridges, on which the medieval villages Kallo, Verrebroek and Kieldrecht (see Fig. 1) are mentioned from the 12th century onwards (Augustyn, Reference Augustyn1977; Van Gerven, Reference Van Gerven1977). Saeftinghe in the north became a stronghold of the count of Flanders in the 13th century, controlling navigation on the river Scheldt (Gottschalk, Reference Gottschalk1984). The count of Flanders and the lord of Beveren also granted large stretches of marshlands to abbeys, which turned them into agricultural estates.
At the height of the medieval occupation phase in the 14th century, several new settlements came into existence, many of them related to peat exploitation and transport (e.g. Namen, Casuwele, Sint-Laureins) (Gottschalk, Reference Gottschalk1984). The decline of peat exploitation and increasing flood problems (a direct result of the lowering of the landscape due to peat compaction and extraction) locally intensified the general demographic and economic decline of the 14th century. At the end of the 16th century large parts of the Waasland Scheldt polders were flooded as a result of large-scale inundations, mostly intentionally caused as part of a military strategy during the Eighty Years’ War. Only the more elevated areas (e.g. the village centre of Kieldrecht and the polders of Namen, Doel and Sint-Anna) were spared the inundations. In the following centuries the area lost to the sea was gradually re-embanked and reoccupied (Jongepier et al., Reference Jongepier, Wang, Missiaen, Soens and Temmerman2015b).
Methodology
Holocene palaeogeographical maps (11,000–950 cal BP)
The topographical and palaeogeographical maps of the Holocene were created using geological and geotechnical information from a wide variety of sources: sediment cores, cone penetrometer tests (CPT) and archaeological augerings. The vast majority of the core and CPT data were obtained from the subsurface database of the Flemish Government (Databank Ondergrond Vlaanderen – DOV). New CPT and core data were obtained in 2011–14 in Doelpolder (Verhegge et al., Reference Verhegge, Missiaen, Van Strydonck and Crombé2014; Missiaen et al., Reference Missiaen, Verhegge, Heirman and Crombé2015) and near Kieldrecht and Verrebroek (for location see Fig. 1). The depth of the CPT data varied roughly between 8 and 30m. Geological information from archaeological augerings was provided by the Department of Archaeology of Ghent University; these data were obtained in the framework of various projects. Average depth of the augerings ranged from 2 to 7m whereas core interdistance generally ranged between 3 and 50m (with a few exceptions up to 70–80m).
A major difficulty in the dataset was the diversity of the type of data (electrical and mechanical CPT, mechanical core, hand augering), the diversity in depth resolution (ranging from 1cm to over 50cm), and the diversity of observers (geologists, engineers, archaeologists). Consequently not only the quality of the data varied greatly, but also the determination of the exact depth and thickness of each sediment unit.
In the final dataset, only sites with raw data available (e.g. detailed sediment descriptions or original CPT measurements) were considered. The data were interpreted following the criteria mentioned earlier (‘Geological setting’ section), and considering the most current geological knowledge of the area. Using the sedimentological description (e.g. clay, sand or peat), the palaeoevironmental indicators (e.g. shells or plant remains), the lithostratigraphic position, the chronostratigraphic information (if available) and the correlation with all sites in the close vicinity, all deposits were logged in different units (not necessarily present at all sites). These units consist from bottom to top of (1) a mostly sorted sandy deposit with no biological remains interpreted as a Late-Glacial coversand, (2) a clay and/or sandy clay (often absent) interpreted as an early Holocene meandering river and/or river flood deposit, (3) a (dark) brown peat sometimes intercalated by a clay layer which is interpreted as a peat deposit interrupted by a marine incursion, (4) a sequence of sand and clay deposits with shell remains interpreted as Late Holocene estuarine deposits, (5) an anthropogenic clay interpreted as late and post-Medieval flood deposits, and (6) a soil cover and/or construction deposits related to harbour activities.
The majority of the CPT data involved mechanical CPT measurements. Resolution of the mechanical and electrical CPT data was respectively 10–20cm and 2–5cm. It is known that the accuracy of mechanical CPT data can sometimes be inadequate for a quantitative analysis (Lunne et al., Reference Lunne, Robertson and Powell1997), and interpretation was therefore done with great care, and where possible also comparing with sediment cores taken in close proximity. Electrical CPT logs are generally better suited to determine the different stratigraphical layers but also here the interpretation was done manually and involved a good local geological knowledge. Automated classification of soil stratigraphy was abandoned since this often did not allow the peat and (organic-rich) clay layers to be distinguished (Missiaen et al., Reference Missiaen, Verhegge, Heirman and Crombé2015).
In total the dataset consisted of 6423 data inputs of which 5783 reached the Pleistocene/Holocene boundary (Fig. 2). However, not all these data could be used to deduce a detailed Holocene stratigraphy. Notwithstanding the careful data interpretation, most of the mechanical logs only allowed the transition from soft Holocene sediment to more compact sandy Pleistocene sediment to be deduced. With regard to core data, only cores with a detailed sediment description could be used. As can be seen in Figure 2, the data coverage is not evenly distributed. In areas of archaeological interest or with a lot of construction works (e.g. docks of Antwerp harbour) the data density is very high. In the agricultural parts of the study area data are scarcer, and the data description is often less detailed.
The distinction between late Holocene estuarine (clay) deposits and overlying late to post-medieval flood deposits was not always straightforward. For the cores the main criterion was the presence of organic material and human traces (in which case we speak of flood deposits, labelled as ‘polder clay’ by DOV). For the CPTs the main criterion was the friction ratio (R f) which was often noticeably lower in the estuarine sediments. The distinction between early Holocene river clay deposits and overlying Mid-Holocene marine clay (in the absence of a lower peat layer) was based on colour and the presence of marine shell fragments.
To allow optimal integration with data from the Netherlands, and an easier comparison with relative mean sea-level curve reconstructions, all depths were converted from the Belgian reference level (TAW) to the Dutch reference level (NAP). In practice this meant subtracting 2.33m from every depth or elevation.
Post-medieval landscape maps (AD 1570–1850)
For the landscape reconstructions of the post-medieval period, historical maps were the main source of information. The excessively large map production in the Waasland Scheldt polders (a direct result of land-surveying practices related to large embankment works) makes historical maps a source for landscape evolution studies that can hardly be overlooked. The analysed maps were selected from a database of around 300 historical maps (16th- to 19th-century) found in the (State) Archives of Brussels, Ghent, Beveren and Middelburg.
Although they provide a rich source of information, historical maps have some serious limitations. Quality and accuracy may vary widely between different maps, leading to misinterpretations in the palaeolandscape reconstruction when using these maps without regarding these limitations. A vital component of the quality and usefulness of historical maps is the planimetric accuracy, or how well distances and locations on these maps correspond to the actual distances and locations of corresponding (present-day) features. Knowing this accuracy, it is possible to evaluate the likelihood that a reconstruction will accurately display the former area.
Recently a methodology was developed by Jongepier et al. (Reference Jongepier, Soens, Temmerman, Missiaen and De Wit2015a) that allows one to calculate, analyse and visualise the planimetric accuracy of historical maps. For the present study we have applied this methodology to evaluate the planimetric accuracy of 30 historical maps covering the Waasland Scheldt polder area. As one might expect, supraregional (small-scale, i.e. >1000km2) maps generally showed the lowest accuracy, with mean positional errors (MPEs) between 500 and 1600m, making their use for palaeolandscape reconstruction very restricted. Regional (medium-scale, i.e. 100–1000km2) maps proved to be far more accurate, often becoming more accurate over time, although a large variation was noticeable here. Local (large-scale, i.e. <100km2) maps provided the highest planimetric accuracy, with MPEs of <50m, and also provided enough topographical details (especially when the maps were related to embankment activities). Surprisingly, however, the quality of older maps (16th- or 17th-century) could be as high as or even higher than more recent maps. This was certainly the case for large-scale maps, but even medium- and small-scale maps showed rather weak correlations between date and positional accuracy (Jongepier et al., Reference Jongepier, Soens, Temmerman, Missiaen and De Wit2015a).
Based on the dates of (re-)embankments and inundations in the region, five time slices were chosen in order to conduct a landscape analysis of the Waasland Scheldt polders (respectively AD 1570, 1620, 1690, 1790 and 1850) (Jongepier et al., Reference Jongepier, Wang, Missiaen, Soens and Temmerman2015b). For each time slice, several maps were georeferenced and digitised in GIS. Choosing the most appropriate map(s) for each reconstruction was largely based on the positional error, since a small error would, at least in theory, provide the most accurate depiction of that area (Fig. 3). In addition to this quantitative approach, the qualitative interpretation also played an important role, such as topographical detail and date (Jongepier et al. Reference Jongepier, Soens, Temmerman, Missiaen and De Wit2015a). In view of the importance of the Saeftinghe area with respect to the post-medieval landscape evolution of the Waasland Scheldt polders, this area was included for the reconstructions.

Fig. 3. Two maps depicting the same part of a salt marsh near Doel (for location see Fig. 1). Left a map from 1813 (ARA, Arenberg, no. 842) with a mean positional error (MPE) of 104m, right a map from 1816 (ARA, Kaarten & plans, no. 8554) with a MPE of 33m. The map on the right with the lowest MPE is to be preferred, on condition that the date of the map corresponds with the chosen time period.
Appropriate maps for the late medieval period are not abundant (the older the map, the smaller the chance of conservation). Furthermore, detailed local and regional maps have only been produced in large quantities from the 17th century onwards. The map of 1575 made by land surveyor F. Horenbault (Rijksarchief Gent, Kaarten & Plans, no. 2454), showing the impact of late medieval small-scale inundations, proved to be the most suitable for the 1570 reconstruction. Mean positional error of this map was 722m.
For the 1625 reconstruction the ‘map by Coeck’ (Atlas van Loon, Scheepvaartmuseum Amsterdam) proved very valuable, showing the inundations of the late 16th century and the first re-embankments in the south of the Waasland Scheldt polders in great detail. Though the geometric accuracy of this map is limited (1383m), elaborate georeferencing resulted in a useful depiction of the salt marsh. Moreover it makes a clear division between the higher and lower salt marsh. The map probably dates to around 1625.
By the late 17th century an increasing number of highly detailed large-scale maps were made. For the 1690 reconstruction, two high-quality local maps (Atlas of Hattinga, Zeeuws Archive Middelburg) proved very valuable for the southwestern and eastern part of the study area. Mean positional errors were mostly outstanding (as low as 53m), though correct assessment of the MPE in certain embankment areas was not always possible due to lack of correspondance with the actual landscape (since the entire embankment was drowned later). The reconstruction in the remaining parts of the study area was based on two supraregional maps with a MPE of 1006 and 1507m.
For the reconstruction of 1790 a large number of highquality maps were available. A good example is the local map by land surveyor J. Coppens which shows the eastern salt marsh near the Doelpolder and on which perpendicular distances from the dikes to the border of the higher salt marsh were also indicated. This resulted in an excellent mean positional error of 103m. The reconstruction of 1850 was based on several large-scale maps, produced in large series. For the Dutch parts of the reconstruction, the ‘Bonnebladen’ of Sealand were available. For the Belgian parts, the first cadastral surveys (Primitive Cadastral maps/Maps of P.C. Popp) proved to be the most useful.
Palaeoecological data
The value of traditional landscape-related biological proxies (e.g. fossil pollen, phytoliths, charcoal and plant macrofossils) has been demonstrated in the palaeoenvironmental study of natural sediment archives and archaeological features world-wide (e.g. Nelle et al., Reference Nelle, Dreibrodt and Dannath2010; Mayle and Iriarte, Reference Mayle and Iriarte2014; Mercuri et al., Reference Mercuri, Allevato, Arobba, Bandini Mazzanti, Bosi, Caramiello, Castiglioni, Carra, Celant, Costantini, Di Pasquale, Fiorentino, Florenzano, Guido, Marchesini, Mariotti Lippi, Marvelli, Miola, Montanari, Nisbet, Peña-Chocarro, Perego, Ravazzi, Rottoli, Sadori, Ucchesu and Rinaldi2014; Mauri et al., Reference Mauri, Davis, Collins and Kaplan2015). These proxies have been proven to be powerful tools that help elucidate past environmental and climatic conditions and human responses to changing ecosystem services (Birks & Birks, Reference Birks and Birks2006; Nelle et al., Reference Nelle, Dreibrodt and Dannath2010; Birks et al., Reference Birks, Gelorini, Robinson and Hoek2014). To ensure an accurate palaeogeographical reconstruction, we therefore also integrated relevant information from landscape-related proxy data (mainly fossil pollen, charcoal and plant macrofossils) derived from palaeo-soils, peat deposits and archaeological features in the study area. The contemporaneity and comparability of these data enabled a reconstruction of the vegetation composition and wetland changes particularly from the middle to late Holocene. Contrarily, proxy data recorded from sediment archives dating from the Late Glacial to the early Holocene were far less abundant and more subjected to taphonomical and/or interpretative constraints. Figure 2 shows an overview of the sampling locations for radiocarbon dates on bulk peat samples and small terrestrial peat macro-remains (cf. Verhegge et al., Reference Verhegge, Missiaen, Van Strydonck and Crombé2014).
In the framework of this study, a 1m thick peat/clay sequence from Doel-Deurganck dock (for location see Fig. 2) was selected for multi-proxy, palaeoenvironmental analysis. The selection of this site was based on the fact that it represents one of the rare peat beds located relatively far inland that contain marine transgressive deposits – all the other studied peat sequences in the Waasland polders being very close to the Scheldt river. The sequence from Doel-Deurganck dock therefore allows more insight to be gained into the vegetation shift related to the marine transgression further away from the estuary. In order to reconstruct local vegetation and hydrological changes during the middle Holocene, palynomorphs, diatoms and sedimentological properties were analysed. Loss on ignition (LOI) (Bengtsson & Enell, Reference Bengtsson, Enell and Berglund1986) was applied at 3cm intervals across the sediment units to estimate the amount of minerogenic and organic sediment input.
A total of 17 sediment samples at varying 3cm (peat, in situ) and 10cm (organic clay, allochthonous) intervals were prepared following standard pollen-analytical procedures (Moore et al., Reference Moore, Webb and Collinson1991). In each sample, palynomorph counting continued until at least c. 500 terrestrial pollen grains were encountered to ensure statistical robustness of the results. However, in four samples palynomorphs were almost completely absent (see Fig. 4, marked with x) and, hence, disregarded for further analysis and interpretation. Since diatoms are not well preserved and mostly absent in peaty deposits (e.g. Gelorini et al., Reference Gelorini, Verleyen, Verbruggen and Meersschaert2006), only samples (11 in total, 5cm interval) from the clayey deposit were taken for in-depth analysis in order to provide additional insights into palaeohydrological conditions and possible tidal forcing. Terrestrial plant remains from the base of the two peaty units and top of the lower peaty unit (basal peat) were selected for accelerator mass spectrometry (AMS) 14C dating (see Table 1).

Fig. 4. Pollen percentage and loss on ignition (LOI) diagram from Doel-Deurganck dock (for location see Fig. 1). Shaded graphs present 10× exaggeration of original percentages.
Table 1. Details of the radiocarbon dates from the peat/clay sequence from Doel-Deurganck dock.

Calibrated according to Reimer et al. (Reference Reimer, Bard, Bayliss, Beck, Blackwell, Ramsey, Buck, Cheng, Edwards, Friedrich, Grootes, Guilderson, Haflidason, Hajdas, Hatté, Heaton, Hoffmann, Hogg, Hughen, Kaiser, Kromer, Manning, Niu, Reimer, Richards, Scott, Southon, Staff, Turney and van der Plicht2013).
Palaeogeographical base map and Holocene time frame
Correct reconstruction of the Holocene palaeogeography requires a reliable model of the Pleistocene surface relief. An isohypse map of the boundary surface was constructed using both geostatistical software and geological interpretation. As a first step an empirical semi-variogram was calculated using the 5783 data points that reached the Pleistocene–Holocene boundary. Based on the best-fit model (in our case a directional linear semi-variogram with a nugget of 0.7) and using point kriging, a grid for the boundary surface was then created (XY spacing 40m, minimum eight data points per grid cell). In order to minimise any local artefacts (e.g. oval depressions instead of valleys, or a higher relief than the current relief) a combination of the gridded surface, the original data points, the digital elevation model (DEM) and general geological knowledge of the area were used to draw the final Pleistocene–Holocene boundary relief map by hand using ArcGIS (Fig. 5).

Fig. 5. Final relief map of the top of the Pleistocene deposits (i.e. Pleistocene–Holocene boundary) based on point data, gridded data, digital elevation model and general geological knowledge. Elevation in m NAP (Dutch reference level). The red line marks a possible valley system that shows a strong link with prehistoric occupation (cf. Fig. 8A). Thick grey lines mark the location of cross-sections A to C shown in Figure 7. The black arrows mark two small channels SW of Kieldrecht where the basal peat has been eroded.
The thus created Pleistocene–Holocene boundary map reflects the original palaeorelief only when the (basal) peat is still present in the subsurface. When the basal peat has been eroded, assumptions about the Pleistocene surface have to be made using a good geological knowledge of the area and of the depositional environments. In the Waasland Scheldt polders peat was present everywhere, except for two small channels southwest of Kieldrecht (black arrows in Fig. 5) which are linked to marine incursions due to breaching of the embankments. The current relief of the Pleistocene–Holocene boundary surface could be considered the palaeosurface. As can be seen in Figure 5 the southern and southwestern part of the Waasland Scheldt polders, where the coversand locally almost reaches the surface, is marked by a higher palaeotopography (above 0m NAP or 2.33m TAW), while the northeastern part is lower (below 0m NAP) and here the Holocene cover is much thicker. This topography fitted very well with the Pleistocene/Holocene surface of the Netherlands, though the latter generally showed less detail due to the different scale of the study (after Vos & van Heeringen, Reference Vos, van Heeringen and Fischer1997; Vos et al., Reference Vos, Moree and Zeiler2002).
Using the Pleistocene surface relief, together with the Holocene stratigraphy, different palaeoenvironmental maps for successive time slices could be created. The elevation of the Pleistocene surface was used to determine the maximum extent of the (Holocene) marine deposits and peat deposits. In order to obtain a time frame for the reconstructions, relative sea-level curves for Belgium and the S(W) Netherlands (Denys & Baeteman, Reference Denys and Baeteman1995; Kiden, Reference Kiden1995, Reference Kiden2006) and a dated peat growth evolution model for the Waasland Scheldt polders (Verhegge et al., Reference Verhegge, Missiaen, Van Strydonck and Crombé2014) were used as they provide an age for the altitude to which the marine influence was present or show how the peat expanded (Fig. 6). For the peat growth model, a series of radiocarbon dates from organic remains (i.e. seeds/fruits and charcoal) was collected at the base of the peat deposits at different heights (for the sample locations see Fig. 2). Considering the error margins in the semi-variogram calculation (error variance of 2.5m) and the point kriging of the model of the Pleistocene surface relief, the maps do not always follow the model of Verhegge et al. (Reference Verhegge, Missiaen, Van Strydonck and Crombé2014) to the letter.

Fig. 6. Left: Holocene relative sea-level curves for the Belgian coast and the S(W) Netherlands (Denys & Baeteman, Reference Denys and Baeteman1995; Kiden, Reference Kiden1995, Reference Kiden2006). Right: Age–depth model of the base of the peat sequence in the Waasland Scheldt polders (adapted from Verhegge et al., Reference Verhegge, Missiaen, Van Strydonck and Crombé2014). Grey crosses indicate the age and elevation of the peat base samples collected in the Scheldt polders. The red and blue line indicate the upper and lower age envelope for this cluster of ages.
In order to visualise the extent and variability of the Holocene deposits three cross-sections were made that cover various parts of the study area (for their location see Fig. 5). The cross-sections were created in areas with sufficient density of high-quality core or CPT data to allow good correlation without much interpolation. In the first cross-section (Fig. 7A) parallel to the river Scheldt the earliest Holocene deposits (meandering river deposits) are present in a small depression cut into the surface of the top of the Pleistocene deposits. The young (1000 years old and younger) estuarine deposits are vertically and horizontally variable, locally eroding the underlying peat. In the second, short cross-section (Fig. 7B) through the northern part of Doelpolder close to the river Scheldt the thick layer of marine deposits in between the peat deposit stands out clearly. In the third, long cross-section (Fig. 7C) perpendicular to the river Scheldt and crossing the harbour area we see the different sedimentary environments in the Holocene deposits getting thinner towards the southwest, away from the river, where the Pleistocene coversand almost surfaces. The middle Holocene marine clay deposits are only present in the deeper parts. It should be noted here that not all the (channel) features of the cross-sections are equally visible on the map in Figure 5 since the latter is based on a generally coarser grid and involved a certain amount of smoothing which may have filtered out small topographical details.

Fig. 7. Schematic cross sections through Nieuw-Arenberg polder (A), Doelpolder Noord (B) and Antwerp harbour (C) showing the sequence of Holocene deposits overlying the coversand. A thin layer of Late Glacial / early Holocene meandering river deposits is present in some of the deeper top Pleistocene topography. The erosive power of the tidal channels and the variability of the late Holocene estuarine deposits is clearly visible. At Doelpolder Noord a thick layer of estuarine clay covers the basal peat bed. For location of the sections see Figure 5.
Palaeogeographical and palaeoenvironmental evolution and human occupation and impact
Late Glacial to early Holocene (14,500–8200 cal BP)
Rising temperatures during the Late Glacial (c. 14.5–11.5ka cal BP) caused an increase in vegetation cover, which resulted in better soil fixation and less erosion, except for the colder Dryas stadials (Verbruggen et al., Reference Verbruggen, Denys, Kiden, Berglund, Ralska-Jasiewiczowa and Wright1996). Fossil pollen from organic palaeosols, intercalating the aeolian deposits within the coversand region (Crombé et al., Reference Crombé, Van Strydonck, Boudin, Van den Brande, Derese, Vandenberghe, Van den Haute, Court-Picon, Verniers, Gelorini, Bos, Verbruggen, Antrop, Bats, Bourgeois, De Reu, De Maeyer, De Smedt, Finke, Van Meirvenne and Zwertvaegher2012), indicate that during most of this period shallow marshy conditions locally occurred in the study area, with Cyperaceaea (sedges) and Poaceae (grasses) as predominant herbaceous components. Surprisingly, traditional Late-Glacial arboreal taxa, such as Salix sp. (willow), Betula sp. (birch) and Pinus sp. (pine), were less prominently observed, probably pointing towards more site-specific controls (e.g. hydrology, basin morphometry, catchment size) on plant habitats and adaptation. However, during the warmer Allerød interstadial (c. 13.8–12.6ka cal BP) Pinus sp. is more present (Deforce et al., Reference Deforce, Gelorini, Verbruggen, Vrydaghs and Crombé2005), especially from c. 13,400–13,300ka cal BP onwards (late Allerød).
Figure 8A shows the landscape at the start of the Holocene (c. 11.5ka cal BP). Late Glacial/early Holocene channel erosion by the proto-Scheldt river and small effluents can be distinctly detected. Most likely, only the channels deeper than −4m NAP were active river or stream channels, while the area between −2 and −4m NAP might have been flooded occasionally during heavy rainfall. In the latter area a thin (≤20cm) layer of muddy sediment, thinning out further away from the river Scheldt, can be distinguished in some of the sediment cores and geotechnical measurements, probably representing flood sediments. It is not unlikely that this thin mud layer may be present in more places but was not detected due to the resolution of the geotechnical data (often >10–20cm) or to the fact that peat growth on top obscured its presence. Moreover, these flood deposits may also have been (partly) eroded or reworked by the Mid-Holocene marine incursion. This could explain why they do not appear on the cross-sections in Figure 7. The palaeoriver channels fit well with the early Holocene palaeo-Scheldt reconstruction of Kiden (Reference Kiden1995, Reference Kiden2006) as well as the early Holocene palaeoenvironmental reconstruction of the Netherlands (Vos & van Heeringen, Reference Vos, van Heeringen and Fischer1997; Vos et al., Reference Vos, Moree and Zeiler2002) (Fig. 11A, further below).

Fig. 8(A, B). Palaeogeographical maps of the Waasland Scheldt polders for different periods. (A) 11000 cal BP; (B) 7500 cal BP.
In terms of human occupation a potential local channel running west to east (indicated by the red line in Fig. 5), following the southern edge of the Maldegem–Stekene coversand ridge, seemingly had a strong attraction. This fossil river channel has been studied and sampled in a trench during archaeological excavations at Verrebroek ‘Aven Akkers’ (Sergant et al., Reference Sergant, Bats, Noens, Lombaert and D'Hollander2007). Over several kilometres along both banks, but mainly along the steep northern bank, numerous sites from the Early (10,750–9350 cal BP) and Middle Mesolithic (9400–8350 cal BP) have been detected during surveys and salvage excavations (Perdaen et al., Reference Perdaen, Sergant, Crombé and Crombé2004; Crombé, Reference Crombé2005; Crombé et al., Reference Crombé, Sergant, Robinson and De Reu2011). Similar occupation patterns are known along other rivers from the Scheldt basin such as the Lower Scheldt (Meylemans et al., Reference Meylemans, Bogemans, Storme, Perdaen, Verdurmen and Deforce2013) and the Kale/Durme (Crombé et al., Reference Crombé, Sergant, Robinson and De Reu2011, Reference Crombé, De Smedt, Davies, Gelorini, Zwertvaegher, Langohr, Van Damme, Demiddele, Van Strydonck, Antrop, Bourgeois, De Maeyer, De Reu, Finke, Van Meirvenne and Verniers2013), thus underlining the importance of rivers as providers of drinking water and for transport during the early Holocene.
First part of the middle Holocene (8200–7000 cal BP)
Rising temperatures during the early to middle Holocene resulted in the development of a denser forest vegetation, reducing soil erosion and runoff to a minimum (Verbruggen et al., Reference Verbruggen, Denys, Kiden, Berglund, Ralska-Jasiewiczowa and Wright1996). Consequently, the river discharge consistently decreased, causing gradual desiccation of the Late-Glacial floodplains. Only in the deepest channels was some shallow water still present. In these areas, as part of the hydrosere process, peat also started to accumulate (Kiden, Reference Kiden, Starkel and Thornes1991; Kiden & Verbruggen, Reference Kiden, Verbruggen, Bourgeois, Crombé, De Mulder and Rogge2001; Bos et al., Reference Bos, Huisman, Kiden, Hoek and van Geel2005; Bogemans et al., Reference Bogemans, Meylemans, Jacobs, Perdaen, Storme, Verdurmen and Deforce2012). During this period, the palaeo-Scheldt river flowed northward (Kiden, Reference Kiden2006), while sea level was still rising rapidly, by c. 0.7cma−1 (Denys & Baeteman, Reference Denys and Baeteman1995).
The early to middle Holocene landscape of the Waasland Scheldt polders is illustrated in Figure 8B. The Scheldt river south of the Dutch–Belgian border was still a fresh-water environment (in contrast to the SW Netherlands where it had already turned brackish by 8000 cal BP), but on the low-lying banks along the channels peat growth started to develop. Most likely the peat was confined to regions roughly below −4m NAP, around the low-lying river and stream banks. Again a strikingly good correlation can be observed with the corresponding palaeogeographical map of the southern Netherlands by Vos et al. (Reference Vos, Moree and Zeiler2002) and Vos & van Heeringen (Reference Vos, van Heeringen and Fischer1997) (Fig. 11B, further below).
Palaeoecological data from Doel-Deurganck dock indicate that in the lowest depressions/valleys permanent wet conditions occurred, favouring the development of wooded fen, dominated by Alnus (alder) and Fraxinus (ash), whereas in the transition zone (from dry to wet) Corylus avellana (common hazel) occurs (see also Fig. 4, Zone I). On the higher – drier – elevations, i.e. the sand dunes, a predominant dry woodland was present, with Quercus sp. (oak), Tilia sp. (lime) and Corylus avellana (common hazel) as main arboreal components (Gelorini, unpubl. data). The pollen percentage and LOI diagram in Figure 4 indicate an abrupt temporary increase of Tilia around 3.8m NAP (Zone II), concurrent with a notable rise in the presence of the parasitic fungi Kretzschmaria deusta (T. HdV-44) and Diporotheca rhizophila (T. HdV-143). This sudden change indicates the temporal development of a local dry Tilia forest phase, in which both parasitic fungi infected most of the potential host populations living in the area, and may be the main agents stimulating the Tilia dominance in the local forest. Hydrological stress, besides some possible damage by domestic animals, is probably the main factor accelerating the disease spread. This is also suggested by a succeeding phase, which is typified by a succession of Alnus, indicating local wetter conditions (i.e. development of alder carr).
Judging by the distribution of Late Mesolithic sites (c. 8350–7000 cal BP), human occupation and land use changed drastically compared to the early Holocene. The number of sites decreases considerably (see Fig. 8B), indicating a reduced exploitation of the interior and/or a decrease of the group mobility (Crombé et al., Reference Crombé, Sergant, Robinson and De Reu2011). Possible causes may have been the increased density of the forest dominated by deciduous tree species and the decreasing availability of drinking water, driving the last hunter-gatherers to the somewhat higher and therefore drier banks of the Scheldt river where they settled on small levees (Crombé et al., Reference Crombé, Verhegge, Deforce, Meylemans and Robinson2015).
Second part of the middle Holocene (7000–5000 cal BP)
During the middle Holocene, relative sea-level rise dropped to c. 0.4–0.25cma−1 (compared to 0.7cma−1 prior to 7500 cal BP) (Denys & Baeteman, Reference Denys and Baeteman1995; Kiden, Reference Kiden1995). The sedimentation rates were, however, relatively low due to the limited sediment supply and the low transport capacity of the rivers. The tidal activity in the study area was still limited, in comparison to the SW Netherlands where a shallow, lagoonal environment had already developed in the vicinity of the Scheldt estuary; around 6500 cal BP the sea reached its most inland position in Zeeland (Vos and van Heeringen, Reference Vos, van Heeringen and Fischer1997). By 6500–6000 cal BP the river Scheldt had turned brackish south of the Dutch/Belgian border (Vos & van Heeringen, Reference Vos, van Heeringen and Fischer1997), and the part of the Waasland Scheldt polders closest to the Scheldt river changed into an extended tidal landscape with mudflats (including tidal channels) and salt marshes (Fig. 8C).

Fig. 8(C, D). Palaeogeographical maps of the Waasland Scheldt polders for different periods (continued): (c) 6500 cal BP; (D) 5000 cal BP.
The limit of the marine flooding in the study area was determined using the occurrence of the Holocene (peri-)marine deposits and the peat growth model by Verhegge et al. (Reference Verhegge, Missiaen, Van Strydonck and Crombé2014). Most of the early Holocene fens drowned and were covered with an organic-rich alluvial clay (Zone II in Fig. 4). According to Deforce et al. (Reference Deforce, Storme, Bastiaens, Debruyne, Denys, Ervynck, Meylemans, Stieperaere, Van Neer and Crombé2014b) the lack of Phragmites (Poaceae) and Salix may seem to suggest a fresh-water environment. However, given the presence of dinoflagellates Spiniferites and Operculodinium israelianum and an increase of Chenopodiaceae, it seems more likely that the clayey sediments are deposited under brackish circumstances. This corroborates earlier studies by Minnaert & Verbruggen (Reference Minnaert and Verbruggen1986) and Verbruggen & Denys (Reference Verbruggen and Denys1995). Surprisingly, during this phase also indications of crop cultivation (cf. cereal type) are found; however, its origin (autochthonous/allochthonous) is unknown. Some fens, however, continued to develop, mostly confined to the transition zone between the tidal areas and the higher Pleistocene coversands. This peat most likely accumulated in areas below −2.5m NAP.
During this middle Holocene flooding phase the transition from a hunter-gatherer to an agro-pastoral economy took place. Prehistoric groups belonging to the Swifterbant Culture (c. 6500–5950 cal BP) and Michelsberg Culture (c. 5950–5600/5500 cal BP) were again attracted to the interior, settling on the same coversand ridges as their early Holocene predecessors (Crombé & Sergant, Reference Crombé, Sergant, Fokkens, Coles, van Gijn, Kleijne, Ponjee and Slappendel2008). By that time these dunes were already largely reduced in occupation surface due to peat growth and flooding, explaining also why these small sandy outcrops are not visible in the landscape model. In most cases just the small top part of the river dunes or coversand ridges was still available for settling. This was covered by alluvial hardwood forest dominated by Quercus sp., Tilia sp., Ulmus sp. (elm) and Fraxinus excelsior (common ash) with a rich shrub layer, including Cornus sanguinea (common dogwood) and Viburnum opulus (guelder rose) (Bastiaens et al., Reference Bastiaens, Deforce, Klinck, Meersschaert, Verbruggen, Vrydaghs and Crombé2005; Deforce et al., Reference Deforce, Bastiaens, Ervynck, Lentacker, Van Neer, Sergant and Crombé2013, Reference Deforce, Bastiaens and Crombé2014a; Crombé et al., Reference Crombé, Verhegge, Deforce, Meylemans and Robinson2015). These alluvial forests are characterised by the highest species richness, productivity and structural and successional complexity within the temperate forest ecosystems (for references, see Deforce et al., Reference Deforce, Bastiaens, Ervynck, Lentacker, Van Neer, Sergant and Crombé2013, Reference Deforce, Storme, Bastiaens, Debruyne, Denys, Ervynck, Meylemans, Stieperaere, Van Neer and Crombé2014b).
Archaeobotanical analysis (Deforce et al. Reference Deforce, Bastiaens, Ervynck, Lentacker, Van Neer, Sergant and Crombé2013, Reference Deforce, Bastiaens and Crombé2014a) demonstrated that the Swifterbant groups who settled on these dunes mainly consumed seeds, nuts and fruits from the trees and shrubs growing on the dunes, e.g. Quercus sp. (acorns), Cornus sanguinea (dogwood berries), Corylus avellana (hazelnut), Malus sylvestris (crab apples), Prunus spinosa (sloe plums) and Viburnum opulus (guelder rose berries). Thousands of calcined bone remains collected during excavations demonstrate that hunting and fishing were also part of the subsistence. The dominance of cyprinids among the fish remains points to the presence of large creeks with stagnant to slow-running fresh water (Van Neer et al., Reference Van Neer, Ervynck, Lentacker, Bastiaens, Deforce, Sergant and Crombé2013). Also the availability of Viscum album (mistletoe) and Hedera helix (ivy) may have contributed to the attractiveness of these sites. The large numbers of charcoal from Viscum album (mistletoe) and charred seeds from Hedera helix (ivy), collected during excavations, have been interpreted as an indication for animal husbandry from the mid-7th millennium cal BP onwards (Deforce et al., Reference Deforce, Bastiaens, Ervynck, Lentacker, Van Neer, Sergant and Crombé2013). Both plants are evergreens, and were commonly used as winter leaf fodder during (pre)historic times, as documented by plenty of archaeobotanical and historical data.
Transition middle to late Holocene (~5000–2500 cal BP)
During the middle to late Holocene the relative sea-level rise decelerated from c. 0.4–c. 0.25 ma−1 to 0.07 ma−1 (Denys & Baeteman, Reference Denys and Baeteman1995), leading to a more balanced net sedimentation. As the tidal landscape started to fill up, peatland started to expand seaward in a relatively short period of time. According to Vos and van Heeringen (Reference Vos, van Heeringen and Fischer1997), the tidal area of Zeeland (southern Netherlands) was completely covered by peat in a period of c. 500 years. In the Waasland Scheldt polders at the southern edge of the Zeeland region a substantial peatland area already existed around 5000 cal BP (Fig. 8D). This is in good agreement with the landscape reconstruction in the southern Netherlands (11C, further below).
In our study area this renewed peat formation took place under more mesotrophic conditions (e.g. at Kallo-Vrasene Dock, Doel-Deurganck dock). Here, the alder carr vegetation was directly succeeded by more open sedge fens, characterised by Cyperaceae, Poaceae and filicales, and poor fen stages with Betula and Myrica gale (bog myrtle) (e.g. Munaut, Reference Munaut1967; Janssens & Ferguson, Reference Janssens and Ferguson1985; Minnaert & Verbruggen, Reference Minnaert and Verbruggen1986; Gelorini et al., Reference Gelorini, Verleyen, Verbruggen and Meersschaert2006; Deforce, Reference Deforce2011). Over the next 1000–1500 years the peatland slowly expanded further westward towards higher grounds, with the exception of a few small ‘islands’ of coversand, which were nevertheless enclosed by peat. At the earliest, around 4000 cal BP (at Doel; see Deforce, Reference Deforce2011) the sedge fen was gradually replaced by oligotrophic peat bogs, mainly consisting of Ericaceae (heath), Sphagnum (peat moss) and Myrica gale (e.g. Gelorini et al., Reference Gelorini, Verleyen, Verbruggen and Meersschaert2006; Deforce, Reference Deforce2011). However, at some sampling sites (as from, e.g., Doel-Deurganck dock and Kallo-Vrasene dock) this bog stage was preceded by a short-lived establishment of Pinus (pine) forests, probably resulting from site-specific edaphic differences (i.e. local dryer conditions) (Janssens & Ferguson, Reference Janssens and Ferguson1985; Gelorini et al., Reference Gelorini, Verleyen, Verbruggen and Meersschaert2006).
For humans, the Waasland Scheldt polders seemed much less attractive during this period, probably due to the extent of more open peatland, reducing the capability of settlement development (i.e. most dunes were gradually covered by peat) and decreasing the availability of food resources. Late Neolithic and Bronze age sites are currently only known from the dry hinterland to the west and south of the Waasland polder area (Thoen, Reference Thoen1989; De Reu et al., Reference De Reu, Deweirdt, Crombé, Bats, Antrop, De Maeyer, De Smedt, Finke, Van Meirvenne, Verniers, Zwertvaegher and Bourgeois2011).
Late Holocene (2500–1500 cal BP)
Around 2500 cal BP the coastline barriers were breached at several locations in the SW Netherlands (Vos & van Heeringen, Reference Vos, van Heeringen and Fischer1997; Vos, Reference Vos, Moree and Zeiler2002). As a consequence, in the surroundings of these coastal barriers peat growth ceased. The Waasland Scheldt polders, however, are located much further inland, well protected from the invading sea, favouring the continuous accumulation of peat. Here, at different sampling locations, radiocarbon measurements on the topmost part of the peat seem to demonstrate that peat formation probably continued – at least at some sites – until at least 1220 cal BP (c. AD 730) (Kiden, Reference Kiden and Baeteman1989; Van Strydonck, Reference Van Strydonck and Crombé2005; Gelorini et al., Reference Gelorini, Verleyen, Verbruggen and Meersschaert2006; Deforce, Reference Deforce2011; Verhegge et al., Reference Verhegge, Missiaen, Van Strydonck and Crombé2014).
The exact extent of the peat has been a subject of debate in Belgium between geoscientists (e.g. Verhoeve & Verbruggen, Reference Verhoeve and Verbruggen2006) and historians (e.g. Soens & Thoen, Reference Soens and Thoen2009). Geoscientists expect traces of peat growth in the soil and/or subsoil. Therefore, if no traces of peat are found, past peat growth is considered doubtful (this viewpoint was, however, already questioned by Vos & van Heeringen, Reference Vos, van Heeringen and Fischer1997). Historians, on the other hand, use information from historical records and maps and accept more circumstantial evidence like place names or written records of peat extraction as a corroboration of peat presence (Soens & Thoen, Reference Soens and Thoen2009). Recently, Jongepier et al. (Reference Jongepier, Soens, Thoen, Eetvelde, Crombé and Bats2011) showed that combining geographical and historical data can help to bridge the gap between geoscientists and historians.
In the eastern part of the Waasland Scheldt polders, peat is clearly present in sediment samples and/or indicated by the geotechnical data (CPT logs) (white hashed area in Fig. 9). The top of the peat layer surprisingly has a maximum elevation of c. 1m NAP (or 3.3m TAW) (see Fig. 7), which is exceptionally high for the region. Formerly, the highest point up to which peat growth had been recorded in the Waasland Scheldt polders ranged roughly between −1.3 and −0.8m NAP (or 1 and 1.5m TAW) (Crombé et al., Reference Crombé, Perdaen, Sergant and Crombé2005; Meersschaert et al., Reference Meersschaert, Van Roeyen and Verbruggen2006). According to Verhoeve & Verbruggen (Reference Verhoeve and Verbruggen2006) this is the threshold level for peat growth, as locations above 1.5m TAW (−0.8m NAP) are generally considered to be too dry. In the best case, an impermeable layer in the shallow subsurface needs to be present to retain rainwater in the soil. However, Ovaa et al. (Reference Ovaa, Van der Meer and Steur1957) state that in lower depressions between sand ridges the substrate is impermeable enough to allow peat growth and that in the past wetter conditions must have existed in these depressions as drainage was considerably worse. The depressions southeast of Kieldrecht seems to have fulfilled these requirements, where traces of peat have been recorded in a number of sediment cores (green dots in Fig. 8E). Since the data points for this part of the Waasland Scheldt polders are unevenly spaced and the sediment descriptions are based on subsurface samples at a 50cm interval, it seems likely that peat layers may not have been detected.

Fig. 8(E, F). Palaeogeographical maps of the Waasland Scheldt polders for different periods (continued): (E) 2500 cal BP; (F) AD 1000. The map shown in (F) is highly tentative.

Fig. 9. Palaeogeographical map of the peat expansion in the Waasland Scheldt polders around 2500 cal BP. This situation likely lasted till c. 1350 cal BP. The white hashed area indicates where peat was detected in the cores and/or geotechnical data. Green dots mark sediment cores with a presence of peaty sand or sand with peat fragments, but where no defined peat layer was found. The black hashed area indicates where traces of medieval drainage features (‘Blockstreifen’ pattern; see also Fig. 10) are still visible.
There is also a lot of historical evidence concerning peat exploitation. Already in the 12th and 13th centuries, peat exploitation in the Waasland Scheldt polders was very significant (Jongepier et al., Reference Jongepier, Soens, Thoen, Eetvelde, Crombé and Bats2011). According to Augustyn (Reference Augustyn1999), around AD 1300 the counts of Flanders realised an annual production of about 8000 ‘last’ of peat – one last equalling 10,000 blocks of peat – on their estates in this region. Unfortunately, the historic documents seldom mention where exactly the peat was dug. However, it is known that two major reclamation centres were founded in Kieldrecht and Verrebroek (Augustyn, Reference Augustyn1985). The peat reclamations presented a so-called Blockstreifen pattern with long, narrow parcels of land separated by ditches, often starting at a road or waterway (Gottschalk, Reference Gottschalk1984). This pattern can still be identified in the region on the DEM or on aerial pictures (Fig. 10); its extent is shown in Figure 9 (black hashed area). Some geoscientists consider the presence of this Blockstreifen pattern insufficient to prove the existence of peat (e.g. De Muynck, Reference De Muynck1976). However, the fact that the pattern is visible in the medieval morphology (i.e. in areas where the late medieval surface is not covered by post-medieval tidal deposits) supports the historical records. The thin peat layer (roughly 10cm) that was mostly left behind during the exploitation may easily be missed due to the low sampling resolution in the cores (50cm or more), or it may have disappeared altogether due to drainage and oxidation, or due to erosion during later inundations. It is likely that such a Blockstreifen pattern also existed further north, in the area around Kieldrecht (Augustyn, Reference Augustyn1999), but the large floods in the 16th–17th century have wiped out all evidence.

Fig. 10. Google Earth© image of the area around Verrebroek (for location see Fig. 1) showing the presence of a medieval ‘Blockstreifen’ pattern (red dotted lines) in the landscape where the late medieval surface is not covered by tidal deposits. Drainage of the peat lands was done by digging many ditches, perpendicular to reclamation axes (mostly a road, indicated in light blue).
Based on the assumptions stated above, it therefore seems likely that the Waasland Scheldt polders landscape would have been completely covered with peat around 2500 cal BP (Fig. 8E), and this situation likely persisted for c. 1000 years (till c. 1500 cal BP). The map of 2500 cal BP also agrees well with the palaeoenvironmental reconstruction of the Netherlands for this period (Vos & van Heeringen, Reference Vos, van Heeringen and Fischer1997; Vos et al., Reference Vos, Moree and Zeiler2002) (Fig. 11D, further below). This complete peat coverage might explain the – so far – total absence of archaeological sites belonging to the Iron Age and Roman Period in the Waasland Scheldt polders. However, studies from the Belgian coastal plain (Baeteman, Reference Baeteman, Beenakker, Horsten and de Kraker2007; Demey et al., Reference Demey, Vanhoutte, Pieters, Deforce, Denys, Ervynck, Lentacker, Storme and Van Neer2013, Baeteman & Pieters, Reference Baeteman, Pieters and Hameeuw2015) and the SW Netherlands (De Clercq, Reference De Clercq2009; De Clercq & Van Dierendonck, Reference De Clercq and Van Dierendonck2009) indicate human activity in these areas that were characterised by large peat bogs at that time. It is not unlikely that the large-scale extraction (and erosion) of the peat may have (partly) destroyed the archaeological evidence from Iron Age and Roman sites in the study area.

Fig. 11. Combined palaeogeographical maps of the Waasland Scheldt polders and the neighbouring southern part of the Netherlands showing a good correlation (partly after Vos, Reference Vos, Moree and Zeiler2002 and Vos & van Heeringen, Reference Vos, van Heeringen and Fischer1997). (A) 11,000 cal BP; (B) 7500 cal BP; (C) 5000 cal BP; (D) 2500 cal BP.
Middle Ages (1500–500 cal BP) (AD 500–1450)
As stated earlier, the man-made transformation of the landscape through dike building, draining and peat extraction started in the 11th and 12th centuries. Unfortunately, it is still uncertain what the landscape looked like prior to these man-induced landscape changes. Once drained, peat soils often became subject to rapid erosion and shrinkage, as documented for many peatland regions in the western and northern Netherlands (e.g. Borger, Reference Borger and Verhoeven1992; Vos, Reference Vos2015). The extraction of the peat further accelerated this process. As result of this human interference and the disappearance of the top layer of peat, a depositional hiatus of several centuries is visible in the soil archive from the documented end of the peat growth in the 7th–8th centuries AD until renewed flooding and deposition of estuarine clay deposits, locally attested in the 10th–11th centuries and more widespread in the 13th century AD (Deforce, Reference Deforce2011). Because of both peat erosion/extraction and overlying estuarine deposits, the reconstruction of the early medieval landscape before the start of large-scale drainage and embankment remains tentative.
It seems likely, however, that the landscape during the Early Middle Ages looked similar to the landscape a thousand years earlier, except for some tidal flats and salt marshes close to the river Scheldt. Augustyn's (Reference Augustyn1977) statement that in the Early Middle Ages the Waasland Scheldt polders consisted of a peat bog with some small sand ridges and pools in between may well be a correct description. On the present DEM (see Fig. 2) and on the soil maps some of these old creeks can still be distinguished, but it is almost impossible to determine the age of these features. Using the soil map (AGIV, 2000) and geological knowledge of the area, a tentative palaeogeographical reconstruction was made for c. AD 1000 (Fig. 8F). Both archaeological and historical traces of human occupation before AD 1000 are missing. This does not imply that the area was completely uninhabited. A low-intensive land use directed at the exploitation of the wetland resources (pasturing, fishing, fowling, etc.) is possible parallel to what happened in other parts of the coastal wetlands in this period (see Soens et al., Reference Soens, Tys and Thoen2014).
Starting in the 11th or 12th century, small-scale dams were built, which either served as elevated roads in the wetland area or as drainage improvements. Archaeological excavations recently discovered the remains of such a dam south of the village of Kieldrecht (Cryns et al., Reference Cryns, Noens, Allemeersch, Bats, Cruz, Jongepier, Laloo, Rozek, Sergant, Soens, Verhegge and Windey2014). In this period, ownership over the unreclaimed ‘wastelands’ was gradually established by local lords – the lord of Beveren, whose castle Singelberg was situated immediately north of the higher cuesta (Wilssens et al., Reference Wilssens, Bartholomieux, De Kraker, De Meulemeester, Poschet, Van Daele, Verelst and Willems2007). For the 13th and 14th centuries, historical sources inform us of the systematic reorganisation of the landscape. In the surroundings of the villages of Kieldrecht and Verrebroek, a pattern of dikes (so-called moerdijken or ‘peat dikes’), ditches and roads was set up in order to excavate and transport the extracted peat (Augustyn, Reference Augustyn1999).
Closer to the river Scheldt, marshlands were protected from flooding by dikes from the 13th century onwards and turned into ‘polders’ (e.g. the Harnesse in Kieldrecht, protected by dikes in 1262) (Van Roeyen, Reference Van Roeyen2007). In the 14th and 15th centuries, larger dikes were built in order to keep the Scheldt floods out, but the water of the Scheldt increasingly invaded the low-lying region. Combined with the increasing tidal influence on the river Scheldt, the region had become very vulnerable to floods as the land level in many cases was lowered through the drainage, shrinking and extraction of the peat (Vos and van Heeringen, Reference Vos, van Heeringen and Fischer1997; Soens, Reference Soens, Thoen, Borger, De Kraker, Soens, Tys, Vervaet and Weerts2013). A highly dynamic period of floods, alternated with renewed land reclamation through embankment set in.
Archaeobotanical analyses (fossil pollen and plant macrofossils) revealed that in the 14th–16th centuries the southern part of the Haendorp polder (for location see Figs 1 and 12) was characterised by a relatively open, agrarian landscape, associated with crop rotation of cereals and leguminous crops such as peas and beans, and limited presence of woodland. In the northern part, where peat remained still (partly) uncovered, more diverse landscape types occur, consisting of heath and grasslands, shrub and woodland vegetation (Gelorini et al., Reference Gelorini, Meersschaert and Van Roeyen2003).

Fig. 12. Post-medieval palaeolandscape maps for different time periods (adapted after Jongepier et al., Reference Jongepier, Wang, Missiaen, Soens and Temmerman2015b). (A) AD 1570; (B) AD 1625; (C) AD 1690; (D) AD 1790; (E) AD 1850. Numbers and letters refer to sites discussed in the text. 1 = Doelpolder; 2 = Sint-Annapolder; 3 = Kallopolder; 4 = Polder van Haendorp; 5 = Konings-Kieldrechtpolder; 6 = Oud-Arenbergpolder; 7 = Nieuw-Arenbergpolder; 8 = Prosperpolder; 9 = Hedwigepolder; 10 = Polder van Namen; A = Saeftinger gat; B = Deurganck. The white dashed line marks the present-day border between Belgium and the Netherlands.
Late Middle Ages till modern times (500–100 cal BP) (AD 1450–1850)
An important wave of reclamation through embankment of previous flooded land took place from 1431 onwards, when large stretches of marsh were sold by Philip the Good, duke of Burgundy, to private drainage companies (Jongepier et al., Reference Jongepier, Soens, Temmerman, Ooghe, Goossens and Segers2012). Until 1567, various embankments resulted in the polders of, among others, Hoog-Verrebroek, Kieldrecht and Doel (Van Gerven, Reference Van Gerven1977). Furthermore, large parts of the peatland earlier excavated were drained and converted into agricultural land. The landscape reconstruction of 1570 (Fig. 12A) shows that by then almost the entire study area was embanked and a large number of (small) villages have been founded. West of Doelpolder, remains of the former peatlands are still found. The salt marsh is limited to the fringes of the river Scheldt outside of the dikes. In contrast to the earlier embankments of the Middle Ages, which were often more curved in shape, dictated by the landscape, these later embankments became increasingly linear. From the 17th century onwards the typical embankment layout was in regular (orthogonal) grids (Soens et al., Reference Soens, Tys and Thoen2014).
Military inundations during the Eighty Years’ War (1568–1648) resulted in renewed flooding of large parts of the Waasland Scheldt polders. The impact of the floods was severe due to centuries of peat extraction and drainage, accompanied by compaction, which had significantly lowered the surface of the land (often lower than Mean High Water Level) (Vos, Reference Vos2015). This meant that large areas could easily be flooded once the dikes were breached. Since no immediate recovery plans for the drowned area were made, an extensive tidal flat developed (Land of Saeftinghe), cut by a large tidal channel (so-called Saeftingher Gat). The landscape reconstruction of 1625 (Fig. 12B) shows how this tidal flat extended far into the Waasland Scheldt polders. Only the higher areas such as the village centre of Kieldrecht (on a sandy ridge) and the polders of Namen, Doel and Sint-Anna escaped complete flooding. Most of the villages that existed in 1570 appear to have been drowned now.
In the centuries after the end of the Eighty Years’ War (in 1648) the entire area was gradually re-embanked. The first areas to be re-embanked included Doelpolder and Sint-Anna polder (which had largely escaped flooding) in 1614, and the polders south of Verrebroek in 1618. The landscape reconstruction of 1690 (Fig. 12C) shows some continuity with the landscape in 1625, but the course of the main tidal channel has changed and it now runs due east to the Doelpolder where an internal connection to the Scheldt river was established (the so-called Deurganck; see Fig. 12C), probably in order to facilitate future military inundations. Most of the tidal area consists of low-lying mudflats. Due to the successive embankments, sedimentation seaward of the new sea dikes was reinitiated after each embankment, leaving little time for higher salt marshes to be formed.
In the course of the 18th century, embankment continued with the Nieuw-Arenbergpolder (in 1729–1784). Dikes became higher and stronger, but especially the landscape ‘design’ changed drastically: while medieval embankments were often consistent with the natural topography, the early modern embankments were characterised by a regular pattern of perpendicular roads and ditches and a rectangular parcelling, neglecting all natural features (De Kraker, Reference De Kraker and Wilssens2007). Due to the larger embanked area, the volume of the tidal area decreased, and therefore the flood and ebb discharges going through the tidal channel system were reduced, causing sedimentation in the channels themselves (D'Alpaos et al., Reference D'Alpaos, Lanzoni, Mudd, Fagherazzi, D'Alpaos, Lanzoni, Mudd and Fagherazzi2006; Vandenbruwaene et al., Reference Vandenbruwaene, Meire and Temmerman2012). The landscape reconstruction of 1790 (Fig. 12D) shows that, apart from the new embankments, almost a century of sedimentation has allowed the salt marsh to be heightened in the Land of Saeftinghe. The tidal channel is much reduced in size and the area of lower salt marsh has extended, but also higher salt marsh has developed against the sea-dikes of most of the embankments.
The process of salt marsh formation persisted in the period 1790–1850. By then, almost the entire tidal flat was bordered by a salt marsh, located along the outer dikes bordering the remaining intertidal area, and the tidal channel surface reduced even further in size (Fig. 12E).
Synthesis
In this paper we have described the landscape development of the Waasland Scheldt polders from the Late Glacial – early Holocene to the present time, and the effects of this changing landscape on the human settlement. The regional landscape evolution has been visualised in a series of palaeogeographical maps for successive time frames; for each map the various driving mechanisms behind the palaeoenvironmental changes and human occupation are discussed. Two different map series were produced: a series of Holocene palaeogeographical reconstructions (11,000 cal BP – AD 1000; Fig. 8) based on geotechnical, geological and archaeological data, followed by a series of post-medieval landscape reconstructions (AD 1570–1850; Fig. 12) based on historical maps, land registers and soil data. The basis for the Holocene reconstructions was provided by the top Pleistocene relief map (Fig. 5), which was used to determine the maximum extent of the successive marine, peat and estuarine deposits. A solid time frame was provided by relative sea-level curves and a dated peat growth evolution model (for the Holocene landscapes) and old historical maps (for the post-medieval landscapes). Palaeoecological data such as pollen, charcoal and plant macrofossils provided information on the vegetation and wetland changes, particularly for the middle to late Holocene. The landscape of the Waasland Scheldt polders is highly dynamic, and only through these combined methods was it possible to obtain an accurate reconstruction of the (drowning) landscape and to interpret successive stages of human settlement and land use.
In short the evolution of the Waasland Scheldt polders landscape can be described as follows. At the start of the Holocene (c. 11,500 PB) the landscape was marked by coversand deposits, towards the east locally eroded by channels of the palaeo-Scheldt river. Human occupation was concentrated along the southern edge of an E–W-trending sand ridge, most likely the location of a former fossil river channel. Rising temperatures during the early Holocene resulted in the gradual development of a woodland, and peat started to grow in the deeper channels. Human occupation decreased considerably, the last hunter-gatherers settling on small levees on the banks of the Scheldt river, which was still a fresh-water environment. As sea level rose, a large part of the area changed into an extended tidal landscape with mudflats and salt marshes during the middle Holocene. Human occupation again returned to the coversand ridges, though now often concentrating on the top part due to extending peat growth and flooding. Already around 5000 cal BP a substantial peatland area existed, making human occupation increasingly less attractive. During the late Holocene, peat growth gradually took over the entire area. By 2500 cal BP almost the entire area was covered by peat, which probably explains the absence (so far) of Iron Age and Roman settlements. Peat growth probably continued till roughly 1200 cal BP.
During the Early Middle Ages the landscape was still largely peat-covered, except for some tidal flats and salt marshes close to the river Scheldt. Traces of human occupation are missing, but this does not exclude some local land use (pasturing, fishing, etc.). Human intervention in the landscape started in the 11th–12th century with the building of small dams (for roads or drainage). From the 13th century onwards dikes, ditches and roads were set up to excavate and transport the peat. Closer to the river Scheldt, larger dikes were built to protect the increasingly invaded low-lying region. Intensive land reclamation through embankment took place, and large parts of the earlier-excavated peatland were drained and converted to agriculture land. By 1570 almost the entire area was embanked, and a large number of villages had been founded. Peatland only occurred in the west. During the next 50 years military inundations resulted in large-scale flooding of the area – a direct result of the increasing tidal influence and lowering of the land through drainage, shrinking and extraction of the peat. Many villages that existed in 1570 were drowned. In the following centuries the area was gradually re-embanked, and the remaining tidal area pushed back to the northern limits (Land of Saeftinghe). Dikes became larger, and the embankments were increasingly characterised by a regular pattern neglecting all natural features. As the tidal area decreased, the marsh in Saeftinghe was considerably heightened.
In contrast to the landscape evolution during the Holocene which was mainly sea-level driven, the landscape transformation during the last millennium (i.e. since the Early Middle Ages) was largely due to human interventions. The latter included both direct landscape modifications (such as the development of a drainage and flood protection infrastructure, agricultural land use or settlement) and their indirect and mostly unintended consequences (such as the dramatic lowering of soil levels due to peat drainage, as well as the increase of storm-flood levels in the estuary as the accommodation space for excess flood water had shrunk due to progressive embankment (Soens, Reference Soens, Thoen, Borger, De Kraker, Soens, Tys, Vervaet and Weerts2013; Vos, Reference Vos2015; and for the northern Netherlands, Van Dam, Reference Van Dam2001; Knol, Reference Knol2013)). An important key to understanding the landscape evolution of the Waasland Scheldt polders is peat and its nature, growth, coverage and extraction. On the one hand, peat has the great advantage of covering and preserving former landscapes and the archaeological traces of prehistoric occupation it contains. On the other hand, through its transient nature (due to shrinkage, extraction, erosion, etc.), peat often makes landscape reconstruction difficult (as traces of settlement on top of the peat have often disappeared). By combining multiple methods and disciplines, former interpretations of peat growth in the area, which had been the subject of intense debate in Belgium, could now be corrected. The peat evolution in the Waasland Scheldt polders correlates extremely well with the Holocene landscape maps from the SW Netherlands (Fig. 11) by Vos & van Heeringen (Reference Vos, van Heeringen and Fischer1997) and Vos et al. (Reference Vos, Moree and Zeiler2002), although the Dutch maps show less resolution due to the scale involved. More research is still needed to reconstruct the chronology and topography of medieval peat reclamations and the subsequent disappearance of the peat. Traditional historical-geographical and archaeological methods, which were successfully applied to reconstruct medieval peat colonisation in different parts of the Netherlands (Leenders, Reference Leenders1989; Borger, Reference Borger and Verhoeven1992; De Langen, Reference De Langen1992; Ligtendag, Reference Ligtendag1995; de Bont, Reference de Bont2014) are problematic in regions where the medieval landscape has been covered by thick layers of post-medieval sediments such as our study area. The present palaeogeographical reconstructions, including a detailed mapping of the Pleistocene surface relief, offer a new and solid base for such enquiry.
Conclusions
The interdisciplinary reconstruction of the Holocene palaeogeography and occupation history of the Waasland Scheldt polders presented here is quite new in Belgium. For the first time a series of detailed palaeogeographical maps and landscape reconstructions has been made that gives an overview of both the long-term (typically thousand-year period, pre-medieval) and short-term (typically hundred-year period, post-medieval) evolution of this wetland region since the Late Glacial – early Holocene, including recent historical times. Previous reconstructions typically focused on a more limited time period (e.g. Middle to Late Holocene, or post-medieval), did not combine data from such a wide range of disciplines investigating past landscape evolutions or did not attempt to extrapolate data into a coherent landscape model.
The maps presented in this study are based on an extensive body of existing and new data. In the future this database will be continually updated with new information from many different sources (e.g. geology (boreholes), geomorphology, archaeology, datings, palaeoecology, historical data and maps), not only related to academic research but also in the framework of commercial projects (among others, the planned construction of a large new dock (the so-called Saeftinge dock) affecting large parts of Doelpolder and Nieuw-Arenbergpolder). This new information should allow further refinement of the maps, and, where necessary, their modification. Expanding the present maps to a wider regional scale, as was done in the Netherlands by Peter Vos, may seem a logical step but this will require a significant effort. Nonetheless, regional palaeogeographical maps can be a valuable tool for the prospection of buried archaeological heritage because they show which palaeolandscapes (for a specific period) favour human settlement and/or specific human activities. In turn this can lead to new archaeological data that may supply important information about the palaeoenvironment and the age of deposits and which will help to improve the map reconstructions.
Acknowledgements
The presented research was funded by the EU Interreg 2 Seas programme (project ‘Arch-Manche’) and the Research Foundation Flanders (FWO) (project ‘Archaeological exploration across the land–sea boundary in the Doelpolder Noord area: impact of sea-level rise on the landscape and human occupation, from the prehistory to medieval times’). Iason Jongepier and Tim Soens acknowledge funding by the University of Antwerp Research Council (‘Drowned but not deserted. Interactions between social and ecological resilience of estuarine landscapes after flooding. Test-case: the Waasland polders on the west-bank of the river Scheldt (15th–18th centuries)’). Koen Deforce, Stijn Temmerman and Peter Vos are kindly acknowledged for their critical review of the paper. The authors would like to thank the two reviewers, Patrick Kiden and Cecile Baeteman, for their helpful comments.


