

Introduction
Accurate characterization and monitoring of the Earth’s cryosphere is essential in order to ascertain global climate and environmental change (Reference PatersonPaterson, 1981; Reference Østrem and BrugmanØstrem and Brugman, 1991). Alpine environments and glaciers play significant roles in atmospheric, biospheric and lithospheric processes (Reference Bishop, Shroder, Sloan, Copland and ColbyBishop and others, 1998a; Reference Shroder, Bishop, Asif Khan, Qasimjan, Treloar and SearleShroder and Bishop, 2000). The uplift of high Asia is of considerable scientific interest because of a host of interlinked geologic and geographic problems that include complex feedbacks between climate change, glaciation, surface processes and tectonism (Reference Shroder, Bishop, Asif Khan, Qasimjan, Treloar and SearleShroder and Bishop, 2000). The chronology and extent of glaciation in high Asia is at the heart of much of this discussion. Recognition of the diversion or capture, or both, of many of the great rivers of Asia, and these relations to past and present ice is profound. Furthermore, considerable attention is focused on the role of alpine glaciers as the main source of meltwater for irrigation and agriculture.
Given the significance of alpine glaciers in high Asia, it is important that baseline cryospheric information becomes available (Reference Bishop, Shrode and WardBishop and others, 1995). It is notoriously difficult to obtain accurate in situ measurements and information in alpine areas due to hazardous and logistical difficulties. The alpine cryospheric system, however, can be monitored and quantitatively measured via remote sensing (Reference Hall and MartinecHall and Martinec, 1985; Reference Williams, Hall and BensonWilliams and others, 1991; Reference Bishop, Shroder, Hickman and CoplandBishop and others, 1998b). Challenges that must be addressed include the current paucity of algorithms and the need to integrate field and remote-sensing investigations.
The purpose of this paper is to demonstrate the utility of remote sensing for extracting topographic and glacier information from satellite multispectral and stereo data. In addition, we address issues related to the Global Land Ice Measurements from Space (GLIMS) project and make applications to glaciers in northern Pakistan.
Background
The Himalaya and associated mountains of high Asia, together with the immense Tibetan Plateau, constitute a major topographic part of planetary climate control, as well as a huge catchment of snow and ice, and a watershed for the surrounding dry lowlands. Glaciers in high Asia have been monitored sporadically for several centuries, with increasing attention in recent years (Reference FieldField, 1975; Reference Mayewski and JeschkeMayewski and Jeschke, 1979; Reference Mayewski, Pregent, Jeschke and AhmadMayewski and others, 1980; Reference Hewitt and TinklerHewitt, 1989). In the Himalaya of northern Pakistan, studies of glacierization and past glaciation have been especially numerous (Reference Derbyshire, Li, Perrott, Xu, Walters and MillerDerbyshire and others, 1984; Reference Goudie and MillerGoudie and others, 1984; Reference MillerMiller, 1984; Reference Shroder, Khan, Lawrence, Madin, Higgins, Malinconico and LillieShroder and others, 1989, Reference Shroder, Owen, Derbyshire and Shroder1993; Reference Hewitt and YoungHewitt and Young, 1990; Reference Shroder, Bishop, Asif Khan, Qasimjan, Treloar and SearleShroder and Bishop, 2000).
Traditional remote-sensing investigations have used satellite imagery of low to moderate resolution, with visual interpretation and traditional statistical classifiers to produce information on glacier location, extent, facies and character (Reference Hall and MartinecHall and Martinec, 1985). Investigations have also shown that detailed information on glacier geomorphology, structure and process rates can be obtained from such data, although issues involving anisotropic reflection, digital elevation model (DEM) extraction, spatial analysis and advanced pattern recognition must be addressed for fully operational assessment and monitoring (Reference Bishop, Shrode and WardBishop and others, 1995, Reference Bishop, Shroder, Sloan, Copland and Colby1998a, Reference Bishop, Shroder, Hickman and Coplandb, Reference Bishop, Hickman and Shroder1999). Many of these challenges will require next-generation satellite sensors and data, algorithm and model development, advanced computation, and integrated scientific investigations in order to improve understanding of glacial processes. The GLIMS project is now organized to accomplish this.
GLIMS is an international project designed to ascertain the extent and condition of the world’s glaciers (http:// wwwflag.wr.usgs.gov/GLIMS/). GLIMS entails a wide variety of satellite imagery and analysis dedicated to assess and inventory glaciers so that a millennial snapshot and better understanding of the total cryosphere can be obtained. These records will comprise a uniform baseline against which subsequent glacier change can be assessed as Earth systems are increasingly affected by global warming.
GLIMS is designed primarily to use data from the Advanced Spaceborne Thermal Emission and Reflection Radiometer (ASTER), due for launch in late 1999, and secondarily, data from Landsat 7, already in orbit. GLIMS’objectives will be achieved through careful planning, a robust and publicly accessible database for storage and manipulation of glaciological data, liberal and inexpensive distribution of images and data, the establishment of an international consortium of regional centers, and reliance on other institutes such as the U.S. National Snow and Ice Data Center (NSIDC), Boulder, CO, and the Earth Resource Observation System (EROS) Data Center, Sioux Falls, SD, U.S.A. Glacier monitoring activities are expected to continue through the 6 year life of the ASTER mission and beyond. The operational phase of GLIMS will begin about 6 months after the launch of ASTER, and scientific data will become available during summer 2000. With the need for about 20 glaciological institutes to produce comprehensive and compatible results, new analytical methodologies and robust software are being developed for their use. We report initial results on the efficacy of operational glacier analysis in the extreme topographic relief of the western Himalaya as a pilot project for part of GLIMS.
Methodology
A Systeme probatoire pour l’observation de la terre (SPOT) panchromatic stereo pair was acquired on 27 and 28 October 1996 over the Nanga Parbat massif, western Himalaya (Fig. 1). Two DEMs were produced: one using our DEM extraction algorithm and one by the SPOT Data Corporation (Reference Bishop, Shroder, Sloan, Copland and ColbyBishop and others, 1998a). Both panchromatic and multispectral SPOT imagery were used to extract information for various glaciers on Nanga Parbat, as well as Batura Glacier (Fig. 1). All imagery was ortho-rectified where appropriate to reduce registration error, and radiometrically calibrated to units of radiance ( Wm–2sr–1μm–1. An atmospheric correction was not applied, as its influence is minimal given the high altitude and the purpose of this research. Spectral variability caused by extreme mountainous terrain and variable land cover (Reference Justice and HolbenJustice and Holben, 1979; Reference Smith, Lin and RansonSmith and others, 1980; Reference Hugh and FreiHugh and Frei, 1983), however, does require an anisotropic reflection correction for accurate interpretation and subsequent analysis (Reference Bishop, Shroder, Sloan, Copland and ColbyBishop and others, 1998a, Reference Bishop, Shroder, Hickman and Coplandb, Reference Bishop, Hickman and Shroder1999).
Location of Batura Glacier and Nanga Parbat in Pakistan. Batura Glacier is the eighth largest glacier in the mid-latitudes, and Nanga Parbat is heavily glacierized at higher altitudes by 69 separate glaciers that cover 302 km2 with an estimated volume of 25 km3.
Monitoring the cryosphere from space involves producing information about glacier mass balance, spatial extent, terminus location and glacier facies, so that a variety of processes can be studied. To date, automatic processing to accurately map glaciers is problematic, because of issues of spectral variability and the limitations of traditional supervised and non-supervised statistical brute-force classification algorithms. To determine the potential for automated analysis of glaciers, we examined: (1) DEM extraction and geomorphometric analysis to assist in glacier-extent mapping; (2) spatial analysis to characterize glaciers with geomorphic criteria; and (3) pattern-recognition approaches for mapping supraglacial characteristics.
The boundaries of debris-covered glaciers are difficult to detect with conventional multispectral analysis, but accurate determinations are possible with topographic data. A morphological operator can locate in a DEM elongated V-shaped features (large, uniaxial-positive, second derivative) that are characteristic of glacier edges. Such features occur either where the glacier meets a rising valley or moraine wall, or where the glacier surface drops down to the valley floor. At each location of aV-shape in the DEM, the V’s strength and orientation is determined and connected along similar orientations. Alternatively, drainage networks that tend to flow alongside glaciers to join at the terminus can be extracted from the DEM. Once such morphological boundary lines are located, a searching algorithm starts at seed points or line segments known to be on glaciers (either provided by a human operator, or from a database of seed points, or determined from the multispectral data), and searches outward to find the most likely glacier edge.
Visual interpretation of satellite imagery of glaciers in the western Himalaya reveals unique spatial patterns of spectral reflectance apparently associated with ice fracture and flow, debris loads and ice cliffs. Glacier analysis from satellite imagery can involve traditional pattern-recognition approaches or more advanced means. Semivariogram analysis can provide useful quantitative spatial information for such features (Reference Bishop, Shroder, Hickman and CoplandBishop and others, 1998b), and we have also used artificial neural networks to identify unique spectral, spatial and geomorphometric relationships that characterize the glaciers in the western Himalaya (Reference Bishop, Hickman and ShroderBishop and others, 1999).
Results and Discussion
DEM extraction and geomorphometry
We have processed both SPOTcross-track stereo data (eight-bit data with a base-to-height ratio of 0.6) acquired over the Nanga Parbat Himalaya, and Japanese Earth Resources Satellite (JERS-1) along-track stereo data (six-bit data with a base-to-height ratio of 0.3) acquired over Alaska. Even though neither of these datasets adequately tests our parallax algorithm for the data types that will be acquired from the imminent ASTER system (eight-bit stereo data with a 0.6 base-to-height ratio along track), we have produced a preliminary DEM comparison between our derived results and those from Reference Bishop, Shroder, Sloan, Copland and ColbyBishop and others (1998a).
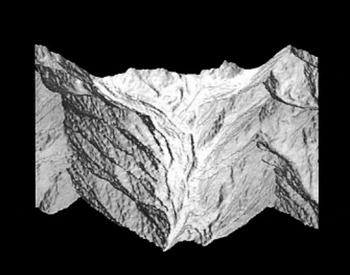
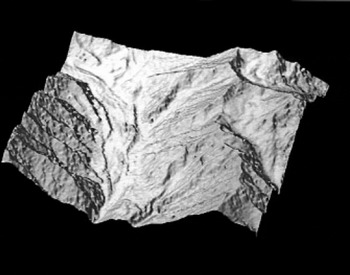
The area of comparison covers a 100 km2 region centered close to Raikot Glacier in the Nanga Parbat Himalaya, ranging from –2800 to 5600ma.s.l. The SPOT Corporation produced its DEM of this area at 20 m intervals in Transverse Mercator coordinates (Fig. 2). Our preliminary but completely automatic U. S. Geological Survey (USGS) DEM was produced with postings at every pixel in the projection of one of the images (∼10.5 m per pixel) (Fig. 3). To provide reasonable comparison, our DEM was processed with a quasi-Gaussian filter (two successive applications of a 3 × 3 low-pass filter) and spatially compressed to a nominal 20 m resolution by extracting alternate pixels. Except for a few high-frequency artifacts and low-frequency projection differences, our DEM compares very favorably with the SPOT product.
Shaded-relief image of the DEM produced by the SPOT Corporation of the Raikot Glacier area, Pakistan. Mote the terminus of Raikot Glacier near the bottom of the image.
Shaded-relief image of the DEM produced by the USGS of the Raikot Glacier area, Pakistan. Note the terminus of Raikot Glacier near the bottom of the image.
The results of geomorphometric analyses have provided new insights into the complex interrelationships between tectonics, denudation and topography. The topography at Nanga Parbat is heavily glacierized and has been significantly influenced by glacial advances, which decreased local relief to produce low slope angles. Such minimum angles at intermediate altitudes represent erosion by warm-based glaciers, and deposition of hummocky moraine. Moraines at various altitudes show the great extent of ice formerly emanating from the mountain. DEM mapping and dating by cosmogenic isotope exposure ages provided temporal control and indicated that, although several glacial advances of ≥ 100 kyr are known from tills and glaciolacustrine sediments, much of the modern landscape is dominated by a glacial heritage from the late Pleistocene and early Holocene. Hyspometric and slope analysis reveal that glaciation at Nanga Parbat was far more extensive in the past and played a significant role in the mass flux of sediment.
Assessment of denudation in the Nanga Parbat Himalaya (Reference Shroder, Khan, Lawrence, Madin, Higgins, Malinconico and LillieShroder and others, 1989, Reference Shroder, Bishop and Scheppy1999; Reference Bishop, Shroder, Sloan, Copland and ColbyBishop and others, 1998a; Reference Bishop, Shroder, Asif Khan, Qasimjan, Treloar and SearleBishop and Shroder, 2000) has been a paramount objective and has focused upon the primary roles of mass movement, fluvial erosion, catastrophic flood flushing and glaciation. Evidence exists for at least 5–6 major episodes of glaciation in the late Quaternary (Reference Shroder, Khan, Lawrence, Madin, Higgins, Malinconico and LillieShroder and others, 1989, Reference Shroder, Owen, Derbyshire and Shroder1993; Reference Shroder, Bishop, Copland and SloanShroder and Bishop, 2000). The four most recent include the Gorikot, which is perhaps equivalent to the Yunz (∼139 Kyr) of Reference Derbyshire, Li, Perrott, Xu, Walters and MillerDerbyshire and others (1984), the so-called High Moraine (50–65 K 10Be, 3He yr) at Bezar Gali and numerous other places on Nanga Parbat, possibly the Drang (34–38K10Beyr) and the Neoglacial (9–5 K10Beyr). The timing of these glaciations is largely asynchronous with the standard chronologies of the Northern Hemisphere (personal communication from W. M. Phillips, 1999), and strongly suggests forcing by the southwest Asian monsoon and the Southern Oscillation. We used satellite imagery and geomorphometric analysis to locate high erosional and depositional terraces associated with some of these glacial expansions, in order to assess and map former glacier-valley sides and bottoms, from which to calculate postglacial incision rates.
Anisotropic reflectance correction
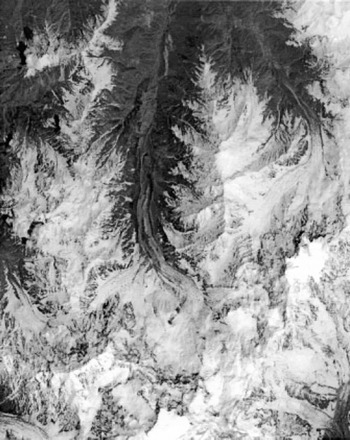
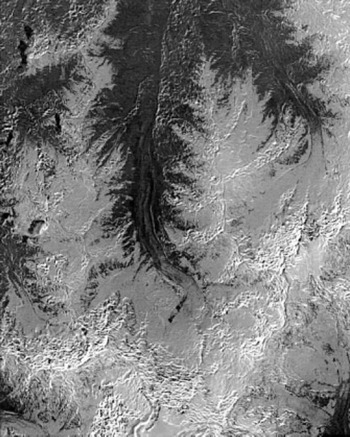
Variable geomorphology and land cover cause anisotropic reflection that limits the usefulness of satellite imagery. Examination of the near-infrared region of the spectrum for the Raikot basin on the north side of Nanga Parbat demonstrates the influence of topography on satellite imagery, in that high variability of spectral reflectance is characteristic (Fig. 4). A vertical relief of 7 km over 21 km horizontal in the basin with a solar elevation of 72.1° and an azimuth of 127.0° contributes to low-frequency, reflectance variability throughout this subscene. The geomorphometry of the basin is highly influenced by pervasive past glaciation (Reference Shroder, Bishop, Copland and SloanBishop and Shroder, 2000), present-day glacierization, large- and small-scale mass movement and deep fluvial incision that produce additional spectral variability superimposed on the low-frequency variation.
SPOT 3 spectral band 3 image of the Raikot basin. Differential illumination is present at a variety of scales. High-frequency reflectance variation is clearly visible and highlights the terrain. The terminus of Raikot Glacier can be seen.
The results of use of the standard Lambertian model show that reflectance variations caused by topography are reduced, although artifacts of the normalization process are clearly present (Fig. 5). The model appears to produce reasonable results in areas that do not exhibit steep slopes, but overcorrects in areas of steep slopes, which would cause problems for mapping alpine snow cover and steep glaciers. Moreover, the assumptions of the Lambertian model are known to be invalid in these environments, and the model does not take into consideration anisotropic reflectance due to land cover.
SPOT 3 spectral band 3 image of the Raikot basin after topographic normalization using the Lambertian assumption. Much of the reflectance variability found m the original image (Fig. 4) has been reduced, although image artifacts are present as a result of overcorrection.
The non-Lambertian model, with global Minnaert constants, produced images with fewer artifacts caused by overcorrection (Reference Bishop, Shroder, Sloan, Copland and ColbyBishop and others, 1998a). Reference Colby and KeatingColby and Keating (1998) have also recognized that the non-Lambertian model is preferable to the Lambertian model in mountain environments for producing accurate land-cover classifications. Nevertheless, the use of global Minnaert constants does not effectively address the issue of anisotropic reflectance due to land cover, and can result in information compression. Our results indicate most effective application if multiple Minnaert constants are calculated appropriately and applied.
Corrected imagery has been used to enable accurate mapping of snow cover and the identification of former glacier-valley sides and bottoms. For example, the Rupal valley on the south side of Nanga Parbat generated large ice streams that descended throughout the Astor valley at least three times in the late Pleistocene, and part-way down in the early Holocene. Our satellite-image processing was especially helpful in discovering remnant linear belts of glaciofiuvial sediment deposition on ridges up to ― 1 km vertically above Gorikot in the Astor River valley. These well-sorted sands and gravels, of probable Drang age equivalency, were originally deposited in ice-contact kame terraces, but are now eroded almost beyond recognition because of the prevailingly strong incision rates. Similar determination of location and altitude of 15 glacial erosion terraces around Nanga Parbat has enabled determination of general rates of incision of 2.2 ± 1.1 cm a"1 (Reference Shroder, Bishop, Copland and SloanShroder and Bishop, 2000). In the absence of high-quality topographic maps in areas of such profound relief, processing of satellite imagery enabled determination of some of the most rapid such rates in the world.
Glacier feature detection and mapping
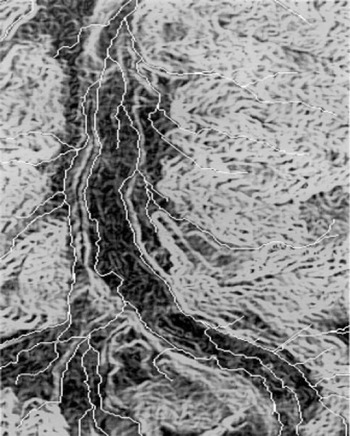
Results of automated mapping of glacier boundaries using topographic information are encouraging (Fig. 6). Drainage lines closely follow the lateral edges of the glacier, and at the glacier terminus the two lateral drainage lines wrap around the glacier snout and converge. These lines are only close approximations of the actual glacier boundaries; refinements are made by applying the V-groove operator and adjusting the locations of the drainage lines to correspond with the topographic break that is characteristic of glacier boundaries. While the method does not yet yield reliable glacier boundaries for all glacier conditions, it is improving rapidly and has potential for operational applications related to estimating the accumulation-area ratio (AAR).
Local spectral variability on glaciers is determined by ice structure, glacier topography and facies, ablation rates, debris loads and ice-surface velocity vectors. Consequently, one might expect texture patterns of satellite images to be of value in mapping glaciers and assessing supraglacial features such as seracs, ogives, reticulated ice hills, ice cliffs and supraglacial fluvial action.
Automatically extracted drainage network overlaid on slope nap of Raikot Glacier (darker shades), Pakistan. After pruning and positional adjustment by use of the V-shape operator, these lines correspond closely to the boundaries of the glacier.
Visual interpretation of SPOT panchromatic data of large and small glaciers in northern Pakistan reveals unique texture patterns associated with ice structure and supraglacial features (Reference Bishop, Shrode and WardBishop and others, 1995). Quantitative characterization and differentiation of these patterns can be used for glacier mapping. Results for Batura Glacier suggest that semivariogram analysis does have potential for mapping, although caution is advised in spatial sampling and interpretation.
Most of our measured semivariograms exhibited a classic form, although several representing ogives and related reticulated ice hills had periodic fluctuations at larger sample lag distances (multifrequency form). For ogives the transects were selected based upon the relative amount of debris load and the definition and spacing of the features. The semivariograms exhibiting a well-defined multifrequency form represent those locations on the glacier where the debris load is relatively low and the ogives well defined (Fig. 7). The difference in spacing of ogives is reflected in the periodicity of the semivariance with scale. For example, the largest distance from ogive to ogive was associated with transect 4. Comparison of semivariograms (transects 1 and 4) indicates that an increase in the frequency of periodicity is associated with closely spaced ogives. In addition, an increase in the presence of debris load masks the periodicity (eg. transects 2 and 3).
Semivariograms of ogives. Semivariograms representing transects 1 and 4 exhibit a multifrequency form. Periodicity of the semivariance is associated with the distance from ogive to ogive. An increase in the presence of debris load masks the periodicity and results in semivariograms exhibiting a classic form (transects 2 and 3).
Examination of the height of semivariograms indicated that differences in spectral variability exist for supraglacial features. As expected, relatively large semivariances were associated with seracs, ogives and the reticulated ice hills resulting from the melting of ogives (Fig. 8), whereas relatively low semivariances were associated with medial, debris-covered parts of glaciers. Ogives and reticulated ice hills exhibited the greatest spectral variability, with S2 values of >30 at scales of >50m. Seracs had S2 values near 30 at scales of ≥ 100m, while debris-covered classes exhibited the lowest spectral variability, with S2 values of ω30 across all scales. Collectively these results indicate that the spatial spectral patterns in satellite imagery can be exploited and used for mapping detailed characteristics of glacier surfaces.
Semivariograms of seracs fields. Spectral variability for ogives is higher than seracs, while spectral variability for seracs is relatively higher than the spectral variability of debris-coveredfeatures.
We tested the utility of artificial neural networks for mapping glaciers at Nanga Parbat (Reference Bishop, Hickman and ShroderBishop and others, 1999). We empirically determined our artificial neural network (ANN) structure and training parameters. The selection of the number of hidden nodes was based upon the need for generalization. During early training efforts we set a learning rate and a momentum rate both at 0.6, but we found that this combination did not allow ANN convergence. We therefore lowered the learning rate to 0.2 and found that each ANN would converge with a system-error tolerance of 0.05.
Training time varied depending upon the complexity of the glacier reflectance patterns. For example, simple, low-frequency, spectral variation associated with glacier surface variation required little training time. Conversely, more iterations were required to recognize spectral patterns related to debris-load variations. ANN training time was greatest for the most complex glacier surfaces.
Glacier feature detection and mapping is fundamental for obtaining information on mass balance and glacier denudation. In the Himalaya, mass-balance data are available for very few glaciers due to hazards and logistics. Consequently, estimates are required, using satellite measurements combined with field data, to determine the relationships between the AAR and the equilibrium-line altitude (ELA). In this way, remote-sensing and field-based studies can be integrated. For example, Reference KulkarniKulkarni (1992) utilized AAR and ELA methods to estimate mass balance in the Himalaya. He found strong correlations between the AAR and ELA and mass-balance data on Gara and Gor-Garang Glaciers in India. Results indicate that an AAR value of 0.44 may correspond to a zero mass balance. Furthermore, even though poor correlations, as determined by algorithms and methods used to estimate the AAR and ELA, may limit the utility to accurately estimate mass balance, trends in mass balance may be obtained where field data are non-existent. Further work on the integration of field data and satellite data is warranted to better understand the response of Himalayan glaciers to climate change.
Remote-sensing investigations have contributed to our understanding of transport of glacier sediment and glacier denudation. Research in texture analysis and pattern recognition has enabled the production of accurate maps portraying supraglacial features and debris-load characteristics (Reference Bishop, Shrode and WardBishop and others, 1995, Reference Bishop, Shroder, Hickman and Copland1998b). This information has the potential to be used to produce regional denudation estimates. Currently, the magnitude and spatial variability of glacial denudation in the Himalaya is not well known. Field-based studies indicate that glacier denudation at Nanga Parbat can be as high as 4.6–6.9 mm a"1 (Reference Gardner, Jones and ShroderGardner and Jones, 1993), although remote-sensing and field-based studies indicate that glacier denudation rates are highly variable at Nanga Parbat due to the spatial and temporal variability of glacier velocities, episodic, glacier-meltwater blockages and outbursts and highly variable sediment-transfer efficiencies (Reference Shroder, Bishop, Asif Khan, Qasimjan, Treloar and SearleShroder and others, 2000).
Summary and Conclusions
In sensitive high-altitude and high-latitude environments, the remote-sensing science and technology of the GLIMS project is required to map snow and ice distributions, and extract quantitative information. To accomplish this, operational models, algorithms and software must be available to the geoscience community. Specific remote-sensing problems and issues must also be effectively addressed.
We have demonstrated that DEM extraction, anisotropic reflectance and glacier-mapping issues can be effectively addressed by using remote-sensing models and new algorithms. Collectively our results indicate that alpine glaciers in the western Himalaya exhibit unique spatial, spectral and geomorphometric patterns that can be exploited by various models and algorithms to produce accurate information regarding glacier extent, supraglacial features and glacial geomorphology The integration of spectral, spatial and geomorphometric features, coupled with advanced pattern-recognition approaches, should enable accurate characterization of debris-covered glaciers in high Asia.
The challenge will be the development of integrated approaches to analysis, such that scientific knowledge and advanced technology produce reliable information from satellite data for the scientific community. Remote sensing and geographic information system (GIS) technology and research have already provided new insights into the workings of the geodynamics of the Nanga Parbat region (Reference Bishop, Shroder, Sloan, Copland and ColbyBishop and others, 1998a). Similar analysis, which will be a part of the GLIMS project, should help scientists better understand and monitor glaciers.
Acknowledgements
We would like to thank C. Reed, J. Flocken, A. Stoyen, P. Ng, P. Craiger andj. Olsenholler at the University of Nebraska at Omaha, and K. Mullins at the USGS, Flagstaff, for their tremendous support.


