


Introduction
The most substantial part of the ice cover of the Antarctic Peninsula is the ice cap of the central plateau. This is drained by glaciers which flow into relatively small ice shelves or calve directly into the sea. Along the west coast there are many mountainous, glaciated islands with their own ice caps, piedmonts and glaciers. The Antarctic Peninsula has the warmest climate in Antarctica and, despite comprising only 6.8% of its area, receives 25% of the continent's total accumulation (Drcwry and Reference Morris and MulvaneyMorris, 1992). Evidence for a recent climate warming on the Antarctic Peninsula has come from temperature records (Reference KingKing, 1994; Reference Harangozo, Colwell and KingHarangozo and others, 1997) and from the analysis of borehole temperature profiles (Reference Nicholls and ParenNicholls and Paren, 1993). At the same time, evidence for the retreat of ice shelves has been presented (e.g. Doake and Vaughan, 1991; Reference Rott, Skvarca and NaglerRott and others, 1996; Vaughan and Doake, 1996), apparently resulting, at least in part, from increasing air temperatures. There have also been reported changes in a number of glaciers and perennial snow patches on the Antarctic Peninsula which have been proposed to be related to a regional climate warming (e.g. Reference SplettstoesserSplettstoesser, 1992; Morris and Mulvaney, 1996; Reference Fox and CooperFox and Cooper, 1998). Here we present the changes observed in the ice ramp at Rothera Point on the Antarctic Peninsula (ear%–-1 and relate them to the local temperature record and other meteorological data.
Rothera Point Ice Ramp
Rothera Point is a small peninsula situated on the southeast of Adelaide Island, off the west coast of the Antarctic Peninsula. Access from the peninsula to the island is via an ice ramp forming the southern limit of the Wormald Ice Piedmont (ear%–-1. The surface elevation of the ramp rises from 10 to 110 ma.s.l.., over a horizontal distance of around 600 in. Following the establishment of a scientific station on Rothera Point in 1975, the ramp saw considerable year-round vehicle traffic, largely in support of aircraft operations from a skiway on the piedmont. This traffic increased steadily over the years. in early 1990, construction of a gravel runway between the station and the ramp began and by 1992 all aircraft operations had been transferred to this runway. Subsequent traffic on the ramp has been light but there are no data to indicate whether use of the runway has led to increased dust accumulation on the ramp, with the potential for a reduction in albedo and increased insolation.
A survey programme was begun in February 1989 to monitor the ice ramp's mass balance and to detect any changes. Monitoring of the ice ramp complements the level-line surveys established elsewhere on the Antarctic Peninsula (e.g. Reference RichardsonRichardson, 1986; Morris and Mulvaney, 1996). A single line was surveyed up the ramp (ear%–-1 by optical (acheometry using a theodolite and infrared distance measurement, and tied to a nearby rock station. The same line has been repeated at around the same time each year, initially using the same technique, but more recently by kinematic GPS profiling.
Survey Results
A selection of the survey results (1989, 1992 and 1997) is shown in Figure 2, to give an indication of the ice-ramp geometry and the overall changes which have occurred. ear%–-1ur shows the differences between each survey and the 1989 data. Over most of the ramp there has been a largely consistent lowering of the surface with time, although there are short distances over which the surface rose slightly between consecutive surveys. Near the top of the ramp, the pattern is less consistent, with the surface elevation rising and falling within a range of around 2 m, but there has still been an overall lowering of the surface over the period of the surveys. The difference in changes between the top of the ramp and the rest of it is possibly due to the difference in elevation and the associated decrease in air temperature with altitude (Morris and Vaughan (1992) derived a lapse rate of -0.0082°C m−1 for the west coast of the Antarctic Peninsula), but local variations in ablation and accumulation due to nearby topography may be considerable. Mean changes over the whole length of the survey line will be considered from now on.

Fig. 1. Location maps of the Marguerite Bay area, Antarctic Peninsula and Rothera Point, showing places discussed in the text. On the righthand map, permanent ice or snow cover is white; contours are from British Antarctic Survey (1995; 10-40 m contours are from sheet 1A, 50 m and above from sheet IB). (Contours are shown onlyfor the ice ramp and adjacent areas.) The two arrows on the lower part of the ramp mark the positions of velocity measurements and indicate the flow direction. Numbers in boxes are the corresponding velocity magnitudes (ma−1). Short, dashed line at the top of the ramp marks the edge of a windscoop and the upper end of the survey line.
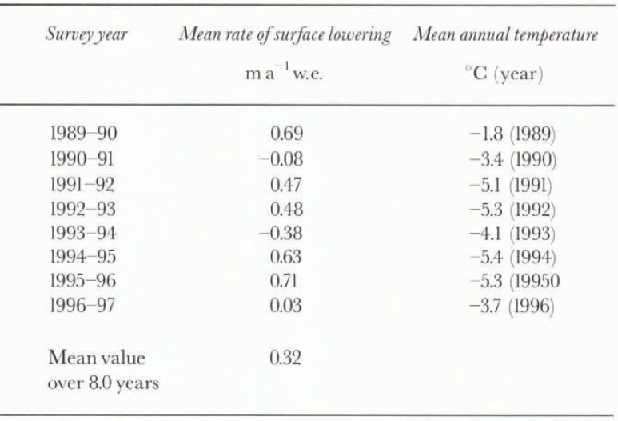
Mean surface elevation changes between successive surveys are given in ear%–table. The data show an overall lowering, with net gains occurring in only two of the survey periods (1990-91 and 1993-94). The mean rate of surface lowering, along the whole survey line, for the eight years between early February 1989 and late January 1997 was 0.32 m a−1 w.e. (assuming an ice density of 850 kg m−3.
The movement of marker stakes on the ice ramp (ear%–-1 shows that the ice-flow velocity is low (around 0.1 m a−1 down the slope), indicating that any surface elevation changes are dominated by accumulation and ablation, rather than by the ice dynamics. This conclusion is supported by the results of a ground-penetrating radar (GPR) survey carried out along the survey line in November 1996 (ear%–-1. This shows an undulating pattern of internal reflectors which does not appear to be consistent with any significant ice flow. The GPR profile also shows that the bed of the ramp is everywhere above sea level, varying in elevation between around 5 and 75 m a.s.l. This means that, irrespective of any retreat of the ramp caused by local meteorological conditions, it is unlikely to suffer enhanced retreat caused by melting at its base by sea-water.
Temperature and Accumulation
Following Reference RobinRobin (1977), Morris and Mulvaney (1996) used mean annual temperature as an indicator of whether surface melting occurred during the summer months at various sites on the Antarctic Peninsula. Sites with a mean annual temperature warmer than -11 °C were assumed to suffer summer melting, whereas colder sites were not. Mean annual temperature at Rothera between 1977 and 1986 was -6.4°C (Morris and Vaughan, 1992). Summer melting of the surface of the ice ramp is therefore assumed to occur and is, in fact, sometimes observed in the form of surface runoff. Despite considerable interannual variability, records from 1945 to 1990 show a long-term trend of increasing mean annual air temperature on the Antarctic Peninsula, at a rate of 0.067°Ca−1 (King, 1994). Mean annual temperatures at Rothera Point during the period of the ramp surveys (Tabic 1) were variable, including the warmest year yet recorded (1989; Reference MorrisonMorrison, 1990), but the data continue to confirm King's long-term warming trend. The seasonal air temperatures at Rothera show that this trend is caused mainly by progressively warmer winters.
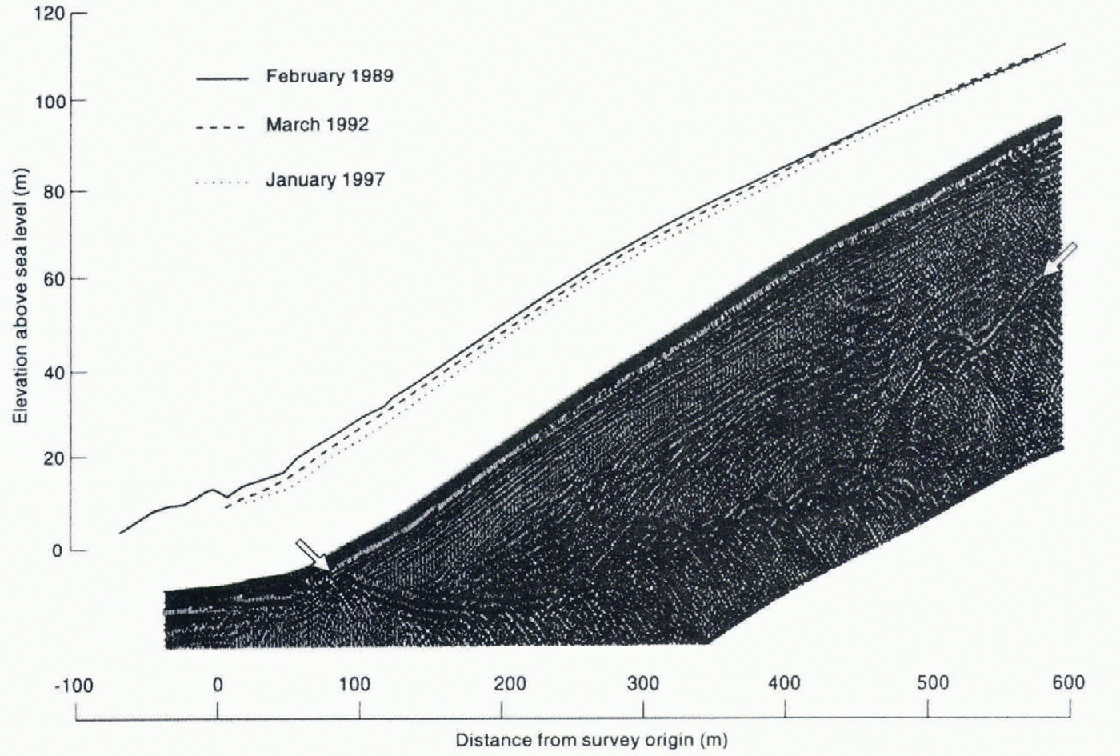
Fig. 2. Selected surface elevation profiles for the ice ramp at Rothera Point and the results of the GPR survey conducted in November 1996. The lefthand ends of surveys and of the GPR profile mark the bottom of the ramp. The righthand ends mark the edge of a windscoop where the ramp joins Reptile Ridge (ear%–-1. The GPR profile has been shifted down slightly, so the surface elevation is absolute for the survey data only. An AGC filter has been applied to the GPR data. Arrivals parallel to the ramp surface are instrument noise. The ice-bed interface is the strongest arrival below the surface along the profile and is marked with arrows. The GPR profile is slightly longer than the 1997 survey because ofsome winter accumulation remaining at the foot of the ramp.

Fig. 3. Cumulative differences between the 1989 survey and each of the following ones. The data at the very foot of the ice ramp have been truncated, prior to 20 m from the distance origin.
Table 1. Mean rates of surface lowering along the whole of the survey line on Rothera Point ice ramp, and mean annual temperatures
Accumulation has not been measured on the ice ramp, but data are available from a stake scheme on Rothera Point. Surface mass balance ranged between around +0.2 and -0.1 m snow per month in 1989, for example. It has been decreasing since at least 1981, at a rate of 0.1 ±0.03 m of snow per year (0.03 m a−1 w.e., assuming a density for surface snow of around 300 kg m−3). Although local meteorological effects could be different at the ramp and at the stake scheme, this suggests that a regional reduction in surface balance probably plays at least some role in the changes observed on the ramp. There is evidence for an increase in precipitation at Rothera since at least the mid-1970s (Reference Turner, Lachlan-Cope, Thomas and ColwellTurner and others, 1995, Reference Turner, Colwell and Harangozo1997) which suggests that the reduction in surface balance is the result of increased ablation.
Antarctic Peninsula Level-Lines and Changes in The Ice Cover
The overall retreat of the ice ramp at Rothera Point, and the mean surface lowering rate, can be compared directly with similar measurements from a number of other sites on the Antarctic Peninsula (table 2). Rates of surface lowering are broadly similar to that of the ice ramp.
Morris and Mulvaney (1996) presented a study of level-line results from eight sites on the Antarctic Peninsula. They found that, over an 8 year period, the surface elevation decreased at sites where the mean annual temperature was warmer than around -11 °C. At colder sites, there was either little change or else an increase in the surface elevation. Iwo of Morris and Mulvaney's (1996) sites (Moraine Corrie and Stephenson Nunatak) showed a lowering of the surface. The rate of surface lowering at Moraine Corrie is greater than at the ice ramp, but the possible effects of unknown ice dynamics and surface moraine in Moraine Corrie could be significant (Morris and Mulvaney, 1996). Two of the colder sites from Morris and Mulvaney, which showed an increase in the surface elevation (Puppis Pikes and St Paneras), are also included inTable 2, for comparison. Morris and Mulvaney (1996) concluded that, at warmer sites, ice bodies are shrinking due to increased summer ablation. Conversely, at colder sites, ice is thickening in response to increased accumulation. Both these effects are likely under a warming climate and will have opposite influences on the surface mass balance (Reference Warrick, Oerlemans, Houghton, Jenkins and EphraumsWarrick and Oerlemans, 1990).
Table 2. Comparison of surface lowering of rates and rates of mass loss per degree-day between Rothera Point ice ramp anda number of other sites. Where ranges are quoted, mean values are given in parentheses
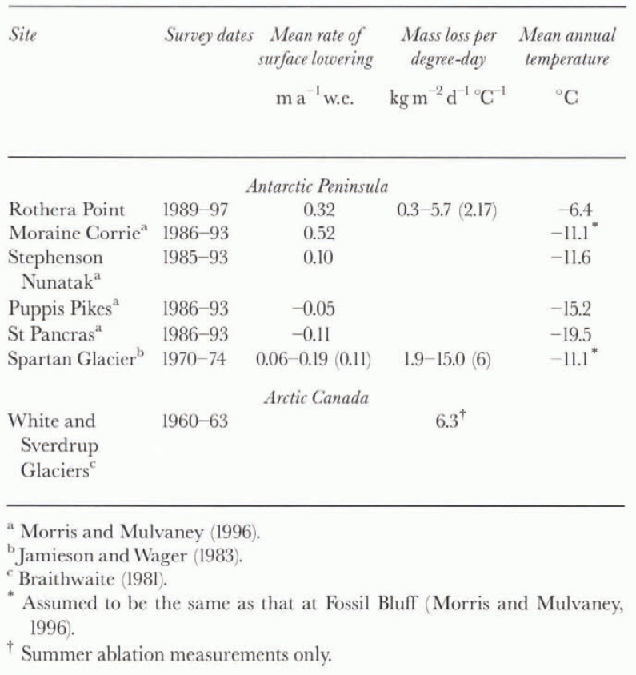
Reference Jamieson and WagerJamieson and Wager (1983) presented data from Spartan Glacier (ear%–-1, a site only 30 km north of Moraine Corrie. Surface lowering rates between November 1970 and February 1974 are given in ear%–table. During this period, mean annual temperatures in the Marguerite Bay region were up to 2.5°C warmer than the long-term trend (King, 1994).
Stonington Island lies 90 km southeast of Adelaide Island on the eastern edge of Marguerite Bay (ear%–-1. A similar ice ramp to that at Rothera Point once connected Stonington Island to the mainland of the Antarctic Peninsula. No survey data are available for the Stonington Island ice ramp, but disintegration occurred during the 1980s, leading to its complete loss by 1990, a process suggested as being associated with a warming trend on the Antarctic Peninsula (Splettstocsscr, 1992), possibly combined with the influence of sea water on the ice base.
Climate-Related Glacier Mass-Balance Studies
The record of air temperature from Rothera Station allows a degree-day approach (Reference BraithwaiteBraithwaite, 1981) to be applied to the ice-ramp survey-line data. Degree-day methods are a simple, quantitative approach to correlating ablation with temperature, and allow comparisons between different sites. From a study of four glaciers in Arctic Canada, Braithwaite (1981) concluded that, whilst long-wave radiation was the main source of energy for ablation, the best correlation with measured ablation was with air temperature. The sum of positive degrcc-days, S, is given by:
where T1 is the mean daily temperature, n is the number of days between consecutive surveys, and αi=1 for Ti ≥ 0.0°C and αi = 0 for Ti < 0.0°C. The average mass loss per positive degree-day at various sites is given in ear%–table. The values from Spartan Glacier are directly comparable with the ice-ramp data as both are from year-round records, i.e. including accumulation and ablation. The difference between these two sites may be due, for example, to higher accumulation at Rothera or a greater influence of radiation at Spartan Glacier. The examples from Arctic Canada are from ablation measurements only, and hence are expected to be higher than the ice-ramp values. ear%–-1ur shows S calculated for consecutive survey periods on the ice ramp, compared with the corresponding surface lowering rates. The two lines agree well, indicating that surface ablation is related to air temperature at this site. The lines in ear%–-1ur also suggest that a value of 5 of greater than around 100 is required for net annual mass loss on Rothera Point ice ramp. If 5 is lower than 100 then there is net mass gain.

Fig. 4. Comparison between the sum of positive degree-days between consecutive surveys, S, and the corresponding rate of surface lowering.
Conclusions
The ice ramp at Rothera Point has been receding, at least since 1989. This recession may have been happening for many years, but there are currently no data to quantify this. The mean surface lowering rate between February 1989 and January 1997 was 0.32 ma−1 w.e. Similar rates of wastage have been reported elsewhere on the Antarctic Peninsula (Jamieson and Wager, 1983; Morris and Mulvaney, 1996) and are to be expected from energy-balance modelling (Oerlemans, 1994). The observations of the ice ramp thus support the conclusions of other studies, namely, that the decadal warming trend observed on the Antarctic Peninsula has resulted in the retreat of ice bodies at relatively warm sites due to enhanced ablation, and in ice-body growth at relatively cold sites due to increased precipitation.
The observed surface lowering coincides with a period of long-term increase in temperature and ablation and with a long-term decrease in the surface mass balance, seen in meteorological records from Rothera Station. The lowering rate can be compared directly with the trend of decreasing surface balance at the stake scheme of 0.03 m a−1 w.e. The big difference between these two values, from sites less than 1 km apart and at similar elevations, emphasises the local nature of the detailed meteorological conditions at individual sites, probably largely the result of local topography.
There is a good correlation between air temperature and surface lowering rates. We therefore conclude that increasing air temperatures in the region will raise ablation and increase the recession rate of the ice ramp.
Discussion
All hough the observed retreat of the ice ramp correlates well with air temperature using the degree-day approach, increasing temperature may not be the only reason for the mass-balance changes. Variations in radiation, for example, may also have an effect. We cannot rule out the possible effect of increased dust accumulation on the ramp, resulting from the nearby gravel runway. It is also interesting to note that ice-core data from the Antarctic Peninsula show increasing levels of dust in the atmosphere over the previous few decades (e.g. Reference ThompsonThompson and others, 1994), possibly related to retreat of the ice cover at low altitudes (personal communication from D. A. Peel, 1997).
Rothera Point ice ramp is Only a small ice bodv. and. taken alone, the results of the surveys would be of little significance. However, they are important because they add to an increasing body of evidence suggesting an influence of regional warming on the ice masses of the Antarctic Peninsula. The dramatic retreat and break-up of Antarctic Peninsula ice shelves is also believed to be a response to the observed warming trend (Doake and Vaughan, 1991; Vaughan and Doake, 1996). The particular value of the Rothera Point ice-ramp surveys and similar results is that they reveal a consistent pattern of change in the ice cover of the Antarctic Peninsula at sites where it cannot yet be detected by satellite or other remote-sensing methods.
The data presented here have three particular advantages over other Antarctic Peninsula level-line surveys. First, the surveys have been repealed annually, rather than separated by many years. This allows an appreciation of interannual variability and avoids the possibility that a survey during an anomalously warm or cold year will have a disproportionate effect on the analysis. Secondly, the close proximity of Rothera Station provides a good record of meteorological data with which to compare the survey-results. Thirdly, we can show explicitly that ice flow has an insignificant effect on the measured mass-balance changes, allowing these changes to be attributed to variations in ablation or accumulation. Finally, prior to the construction of the gravel runway, there were some fears that a future deterioration of the ice ramp at Rothera Point could be as rapid as that seen at Stonington Island, causing severe problems for aircraft operations. The fact that the bed of the ice ramp is above sea level suggests that a similar rapid disintegration is unlikely.
Acknowledgements
We thank the many people from Rothera Station who assisted with acquiring the survey data.


