

Introduction
The effect of wind on weakening the structure of snow crystals begins during snowfall. When the snow flakes reach the snow surface, they begin to move as soon as the wind velocity reaches a threshold that depends on the snow type. The snow grains quickly fragment and their size decreases as they collide with each other or with the ground. When snow drifts in dry air, sublimation can very efficiently reduce the grain-size. As their size decreases, the suspended particles tend to bond quickly by a sintering action. This explains the rapid formation of cornices and could be at the origin of slab-avalanche release (Reference MeisterMeister, 1989)
Many studies have been conducted on blowing snow. The subject of these studies has been based essentially on a theoretical approach to blowing-snow effects. For example, several papers related to this theme have been published: physical model (Reference PomeroyPomeroy, 1989), theoretical development of the saturation notion (Reference TakeuchiTakeuchi, 1980), investigation of threshold wind speeds (Reference SchmidtSchmidt, 1981; Reference Takeuchi, Ishimoto and Kajiya.Takeuchi and others, 1990), or geographical deposition (Reference FöhnFöhn, 1980).
For 5 years the Centre d’Études de la Neige (CEN) has investigated blowing snow. The aim of this research, among other things, has been to understand the relationship between blowing snow and avalanche activity. The final goal is to introduce the results of this research into snowpack-evolution models and to develop an application that forecasts blowing-snow events.
Blowing snow is one of the most important factors for forecasting the accidentally release of avalanches. The effect of blowing snow is not always easily quantified and most forecasting methods are based only on empirical rules and experience. From this study, we aim to provide users (avalanche forecasters, snow-safety services, etc.) with snowdrifting diagnostic tools to better understand wind effects on the snowpack in mountain regions. A special aspect of this study was taking into account wind-speed thresholds, according to morphological snow-grain parameters, in order to improve the 24 hour forecast of avalanche hazards.
Research Methods
Experimental Site
A large, north-south oriented pass (Col du Lac Blanc, 2700 m a.s.1.), where the wind is generally similarly channelled, was chosen for this research program. Close by (at Dôme des Petites Rousses), avalanche activity on two east-facing slopes has been followed and observed: on one slope, avalanches are artificially released according to the snow-cover conditions; on the other slope, there has been completely natural avalanche activity (Reference Guyomarc’h., Castelle. and ArmstrongGuyomarc’h and others, 1992).
Instrumentation
Several parameters (air temperature, wind direction and velocity, snow depth, snow cover, surface temperature and water equivalent of precipitation) are recorded hourly by a sheltered computer and transmitted to Grenoble on request. For 4 years, we have complemented these measurements with data from another automatic meteorological station at the top of the Dôme des Petites Rousses (2800 m).
In addition to these instruments, a new device has been developed and tested. This apparatus is based on a set of snow-depth sensors set up on two cables along a slope; it has been called a “snow profiler” (Reference Guyomarc’h., Mérindol and Sudul.Guyomarc’h and others, 1997). It follows the real-time snow-depth evolution and obtains, every 15 minutes, a snow profile along a slope at a site subject to snowdrifting.
Field Measurements
Our goal is to measure precisely the different wind-velocity thresholds allowing for snow transport and relate these to the morphological and physical features of the snow particles. As often as possible, the automatic measurements have been supplemented with manual observations in order to describe, in maximum detail, each period of snowdrifting. The following observations were carried out:
Before snowfalls or strong wind conditions, snowpack observations (type of snow, density, temperature profile, shear strength, surface conditions, etc.) were made in the uppermost meter of the snowpack.
During snow storms or snowdrifting periods, drift-flux measurements and vertical profiles of the wind speed were made (Reference CastelleCastelle, 1994).
After these periods, complete snow pits were once again made. If a slab avalanche had been released, snow-profile observations were made on the failure and the slab stratigraphy studied.
Several samples of snow grains were collected during the previous stages and transported to a cold laboratory for later microscopic analysis. Pictures of grains have been recorded on video tape and the characteristics of wind-drift snow particles have then been determined. These observations have been very uselul for associating snow-morphology parameters with wind velocity.
Protéon: an Application for Forecasting Blowing Snow
A snowdrifting-event forecasting model
In order to determine the risk of slab avalanche release, avalanche forecasters have to evaluate, among a number of other parameters, the wind effects on the snow distribution and on the snowpack stability. One problem is to know whether snowdrifting occurs in a particular site. Using results from field measurements, a model called PROTÉON (PRévision de l’Occurrence de Transport ÉOlien de la Neige - forecasting of wind snowdrifting occurrence) has been developed (Reference Guyomarc’h., Mérindol. and Sivardière.Guyomarc’h and Mérindol, 1995) The method, presented below, consists of:
Estimation of the wind velocity al the site using a staiistical method,
Simulation of the snow-panicle type at the snowpack surface and an estimation of its driftabiliiy.
Calculation of a “snowdrifting index”.
Wind Speed and Direction Estimation
The first part of the application was developed to estimate wind velocity and direction al Col du Lac Blanc. For this, data from the European Centre for Medium-Range Weather Forecasts were used. The statistical relationships between the model parameters on a 3 × 3 grid (covering the north of the French Alps) and wind measurements ai the site have been searched for. A multi-linear-regression method was used to calculate equations for the daily estimation of wind direction and velocity.
A comparison between measured wind parameters (over the 1993–94 season but not included in the learning file) and the forecast from this method is shown in Figure 1. In most cases, wind velocity is well estimated (correlation coefficient R = 0.77). The highest difference in wind direction appears only with low velocity (less than the threshold of the start of snowdrifting); in the other eases, the forecast direction is quite correct.
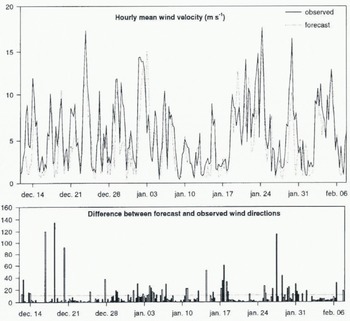
Fig. 1. Comparison between the measured wind velocity (continuous line) and the analysed one (dotted line) at Col du Lac Blanc. The graph shows the absolute value of the difference between forecast and observed wind direction (dotted line represents the mean).
Snow-Particle Mobility
To reach our objective, it was necessary to know precisely the daily state of the snowpack surface. For this. SAFRAN (Reference Durand, Brun., Mérindol, Guyomarc’h, Lesaffre and Martin.Durand and others, 1993) - Crocus (Reference Brun, David, Sudul and Brunot.Brun and others, 1992) was used to simulate the evolution of the snowpack at the experimental site. The first model (SAFRAN) provides the second one (Crocus) with an estimate of relevant meteorological parameters (such as air temperature, wind velocity, humidity, precipitation and its phase, etc.). Then, Crocus calculates a detailed stratigraphy of the snow cover for the site considered. One of the most important problems is having a good description of snow-grain characteristics, so a modification of the formalism used (as described by Reference ColbeckColbeck and others, 1990) has been necessary in order to describe snow evolution as a function of continuous parameters (Fig. 2). These variables are dendricity, sphericity and grain-size. Dendricity varies from 1 to 0, according to the part of the original crystal shape still remaining in a snow layer. Sphericity varies from 0 to 1 and describes the ratio of rounded vs angular shapes.

Fig. 2. Snow-grain symbolism in Crocus (as a function of continuous Parameters).
Using an empirical approach, we combined grain morphology, and grain-size to define a function describing a “driftability index”. This approach allowed us to take into account indirectly the differences in cohesion between snow particles, notably the sintering process. The influence of temperature on the snow cover is also indirectly taken into account through the metamorphisn laws used by Crocus. For example, it considers that, with the same dendricity, faceted crystals can be eroded more easily than small rounded grains, because of their sphericity difference. This hypothesis was confirmed by our field measurements.
In PROTÉON’s analysis, a Crocus-simulated snowpack was analysed from the top. For each layer, the driftability index (di) was calculated For each type of snow particle, it was necessary to describe the snow using the same parameters as the Crocus model. The analysis was separated into two cases:
The first case was when fresh snow was still present in a layer (that is its dendricity was > 0). In this case, the possibility of snow transport depends essentially on sintering cohesion between snow grains. It is described using the follow ing function:
where d is dendricity (1–0) and s is sphericity (0–1).
The second case was when the grain type was only the result of snow metamorphism and its possibility of being transported by wind depended upon its size and sphericity. In this case, we used the function:
where gs is the grain-size and s is sphericity (0–1)
We decided that a crust layer > 3 mm or a wet layer prevented snowdrifting and consequently stops the analysis. The driftability index takes a value between 1 for fresh recent snow fallen without wind and -1 for spherical melted snow.
Snow-Driftability Index
The last stage of the study consisted of a combination of previous information (di) and wind velocity) in order to forecast the occurrence of snow 1 day in advance in 6 hourly time-steps. Using field measurements and observations over 4 years, we determined, for each type of snow, the wind-velocity threshold which allowed snowdrifting. We compared at 6 hourly time-steps, the driftability-index value with the forecasted wind velocity. Then, it was possible to define a function using this index and wind velocity which discriminated between no-transport cases and the others. We calculate the driftability index (si) as:
where w is wind velocity and di is the previous snow-drift-ability index.
If the value of this function is positive, it is considered that snowdrifting will occur at the site (Fig. 3) and the thickness of the พ ind-eroded layer can be calculated.

Fig. 3. The two domains of the snowdrifting index values.
The evolution of the “driftability index” can be displayed on a graph for the previous 7 days. This information is available to an avalanche forecaster on his computer screen (Fig. 4).

Fig. 4. Evolution of the profile analysed by PROTÉON at the site from 23–30 November 1996. They axis gives the snow depth that could be eroded by wind. The green and blue colours describe a positive snowdrifting index for each snow layer (snowdrifting should occur). Yellow and red colours describe a negative snowdrifting index for snow layers which cannot be eroded by the forecast wind velocity. These layers are drawn below the zero line.
Test and Validation
Test on a Whole Season
For validating this forecasting tool, a simulation of the whole 1992–93 winter season was made. The snowdrifting index was calculated at 6 hourly time-steps, using the measured wind velocity. Then, it was compared with snowdrifting periods at Col du Lac Blanc. The lack of a reliable sensor specific to the delection of snowdrifting in real-time led us to use the difference between the hourly maximum and minimum values of the depth sensor. When snowdrifting occurs, the snow particles in motion cause interference, near the snowpack surface, to the ultrasonic waves used by the snow-depth sensor. So, when this difference (averaged over an interval of 6 hours) increases above 2 cm, it is assumed that a snowdrifting event occurred at the site (snowfall is easily distinguished using records from the heating precipitation gauge).
The results from this comparison (made every 6 hours 776 times) are shown in Figure 5.

Fig. 5. Comparison between observed snow events and simulated ones (PROTÉON) for 776 periods of the 1992–93 winter season
During this period, about 80% of the snowdrifting events were detected. These periods represent only 10.3% of the time during the winter season; 14% of the time false positive predictions were made.
Focus on a Period of the 1996–97 Season
The beginning of the 1996–97 season was rich in snowdrifting events. During this period, a new snow accumulation of about 2 m was observed at Col du Lac Blanc. In order to achieve a qualitative validation, a graphical comparison was made as a first approach. For this, it was necessary to display two indices: the first one synthesized the information of the analysed profile calculated by PROTÉON and the second one summarised the temporal behaviour of the snowpack thickness between two time-steps (6 hours). By using the SAFRAN-Crocus simulation (four times a day) and the PROTÉON analysis, a compound index (indc) was calculated for each simulated snow profile (Fig. 6). The principle is the following:

where n is the number of driftable layers, indi is the snow-drifting index of the layer i, epi is thickness of the layer i.

Fig. 6. Comparison between the compound index and the ECh index.
To define the snowdrifting period, hourly data from Col du Lac Blanc were used. In order to optimise the available data, the following function (Ech), named the normalized difference, has been defined:

where diffmx is the maximum difference for the period, hfnmx is the hourly maximum of snow depth, htnmn is the hourly minimum of snow depth. By definition, the Ech index is in the range (0,1).
A first validation could be made by comparing the values of the two previous indices on a graph. Figure 6 shows that, taken as a whole, the compound index and the normalized difference are in phase.
If we focus our attention on period 1, it appears that, when the driftable snow is thin, these layers disappear quickly due to the efficiency of wind erosion. However, the Crocus model is not yet able to remove snow layers, so snowdrifting conditions are still forecast by PROTÉON.
In period 2, another kind of disagreement is shown between ECh and the results of the PROTÉON analysis. This is explained by underestimation of the forecast wind velocity (the hourly mean of the measured wind velocity is 5 m s−1 stronger than the forecast one).
In period 3, a better agreement is observed. During these 20 days, snow depth increased by more than 150 cm and the wind blew with an average velocity greater than 10 ms−1. For these reasons, there was always an erodable snow layer.
The following contingency tables (Figs 7 and 8) show the comparison between observed snowdrifting events and the simulated ones for the same period. In calculating these tables, the information delivered by each index has been transformed to a simulated or an observed snowdrifting event when the index is positive. In the whole period, about 62% of the snowdrifting events have been well forecast. These events represent 28.3% of the time during this period. But, 15.6% of the time (false alarm), snowdrifting was forecast when none occurred. In period 3, about 87% of the snowdrifting events were detected. These events represent 39% of the time. In this period, only 6.1% of the time was the forecast false positive.

Fig. 7. Test for the whole period (1 November - 31 December

Fig. 8. Test for the reduced period (23 November - 12 December 1996).
Conclusion
This paper has shown it is feasible to forecast snowdrifting events 1 day in advance with satisfactory accuracy. This application is integrated into the SAFRAN-Crocus-MÉPRA (Reference Giraud, Brun, Durand and Martin.Giraud and others, 1994) operational chain for experimental testing in practical conditions and has been used by avalanche-risk forecasters from Grenoble for the last two winter seasons. The information can be transmitted, on request, to the Snow Safety Service of Alpe d’Huez.
These results can be improved. When the same snow-surface conditions remain more than 12 or 24 hours, the same thickness of transported snow will be forecast for each 6 hour step. By using measurements from the snow profiler, we plan to determine the rates and the time needed to erode a snow layer according to the snow-surface stale and wind velocity. The first results have been published (Reference Guyomarc’h., Mérindol and Sudul.Guyomarc’h and others, 1997). Then, the erosion or accumulation of blowing snow must be taken into account in the Crocus simulation.
Although this application can improve avalanche-hazard forecasting in some conditions, it is important to bear in mind that this tool has been designed for forecasters, which means the results must fit thier expectations, and this is not always measurable in terms of correlation coefficients and contingency tables.
Acknowledgements
This program has been supported financially by the Région Rhône-Alpes and the French government. Logistic support from SATA (the Snow Safety Service of Alpe d’Huez) made this study possible and is gratefully acknowledged. This research is part of the European Research Program called SAME (Snow Avalanche Warning and Mapping in Europe), which is supported financially by the European Commission in the field of the “Environment and Climate” program.


