


Early-life dietary habits influence future food preferences and dietary intake(Reference Switkowski, Aris and Gingras1–Reference Schwartz, Scholtens and Lalanne4). In the last decade, market sales and use of commercial complementary foods have increased substantially worldwide(Reference Theurich, Zaragoza-Jordana and Luque5–7). Consequently, commercial complementary foods play a vital role in the dietary intake of infants and young children. Thus, it is essential to describe the products’ nutritional characteristics for better nutrition policies and practices for infants and young children.
Previous studies have reported nutritional concerns regarding the content of commercial complementary foods. For example, high levels of Na and sugar and the presence of sweet foods have been reported in studies from the UK(Reference García, Raza and Parrett8), the USA(Reference Maalouf, Cogswell and Bates9,Reference Cogswell, Gunn and Yuan10) , Australia(Reference Dunford, Louie and Byrne11,Reference McCann, Russell and Campbell12) , European countries(Reference Theurich, Zaragoza-Jordana and Luque5,Reference Hutchinson, Rippin and Threapleton13–Reference Grammatikaki, Wollgast and Caldeira16) , Taiwan(Reference Koo, Chang and Chen17) and South-East Asian countries(Reference Bassetti, Zehner and Mayhew18). Other studies have reported a low variety of vegetables and other ingredients in commercial complementary foods(Reference Moding, Ferrante and Bellows19–Reference Mesch, Stimming and Foterek21). These studies were mainly published in Western countries. Since complementary foods differ by country(Reference Theurich, Zaragoza-Jordana and Luque5,Reference Bassetti, Zehner and Mayhew18) , their nutritional characteristics should be monitored and described in each country.
In addition to nutritional characteristics, the price of products is a major food-choice-related motive for consumers(Reference Konttinen, Halmesvaara and Fogelholm22). Food and diet costs could contribute to socio-economic disparities in diet quality(Reference Darmon and Drewnowski23). Previous studies have examined whether healthy products are more expensive than general foods and drinks(Reference Jones, Conklin and Suhrcke24,Reference Rao, Afshin and Singh25) . However, none have examined the association between the prices of products and their nutritional characteristics in commercial complementary foods. As commercial complementary foods are convenient food choices for parents with young children aged < 3 years, it is essential to examine the nutritional characteristics of products for young children in association with product price and nutrition.
Few studies have examined the characteristics of commercial complementary foods in Asian countries, including Japan. Further, the relationship of the characteristics of commercial complementary foods with price have rarely been examined. The current Japanese diet is characterised by high Na intake and low intake of dietary fibre, Ca, saturated fat and free sugars(Reference Asakura, Uechi and Sasaki26–28). Among Japanese toddlers aged 18–35 months, free sugar intake is also relatively low: the mean free sugar intake was 17·4 g/d (6·1 % of energy) for boys and 18·2 g/d (6·9 % of energy)(Reference Fujiwara, Murakami and Asakura27). Dietary intake among Japanese children may reflect the dietary habits of adults. It is possible that the characteristics of commercial complementary foods are similar to the Japanese dietary characteristics described above.
Disparities in diet quality related to different socio-economic statuses have seldom been reported in Japan. A previous study conducted among children aged 6–18 years showed that such disparities may be reduced by the school lunch programmes in elementary and junior high schools(Reference Kurotani, Shinsugi and Takimoto29). As similar lunch-providing systems are also available in many Japanese nursery schools, protective effects against socio-economic status differences in diet quality may also be expected in pre-schoolers(Reference Murakami, Okubo and Livingstone30). School lunches at nursery were usually prepared from scratch at school or outside cooking facilities(31). For children aged < 3 years, however, diet quality may be more sensitive to monetary costs due to a lower dependence on the lunch programme. For example, 38·1 % in 2015 and 50·4 % in 2020 for children < 3 years old attending nursery facilities(32) and the others (i.e. 61·9 % in 2015 and 49·6 % in 2020) were cared at home by parent(s). In Japan, market sales of commercial complementary foods have been increasing despite a decrease in the birth rate(7). This increasing sales might be related the increasing in female employment rate in Japan(33). Some parents might frequently use commercial complementary foods for convenience, because one-third of mothers think preparing complementary foods is burdensome(34). Although the intake amount of commercial complementary foods among Japanese infants and young children is unknown, it is possible that their contribution to children’s diets has been increasing. The national survey of infants in 2007 reported that 28·0 % and 47·8 % of parents answered ‘frequently’ and ‘sometimes’ used baby food, respectively(35). Considering the increase in the sale of commercially complementary food in Japan in the last decade, the frequency of baby food usage among parents might be higher than in 2007. Thus, this study aimed to (i) describe the information provided by commercially available complementary foods for infants and young children in Japan, focusing on nutrient profiles, ingredients, and food additives and (ii) compare these contents between the price levels of products.
Methods
Data collection
Data were primarily obtained from the websites of fifty-four Japanese brands for infant and young children’s food between March and July 2022. The products were first chosen from five leading manufacturers (Wakodo, Asahi Group Foods, Ltd; Kewpie Corporation; Pigeon Corporation; Bean Stalk Snow. Co. Ltd; and Glico Co., Ltd), which produce infant and toddler foods in Japan and participated in Nihon Baby Food Kyogikai (an organisation run by companies that manufacture baby food in Japan)(36,37) . Although the exact percentage of these companies’ market share is unknown, products from the five leading companies almost dominate (i.e. estimated to be > 80 %) the market of commercial complementary meal, snack and sweets, and drink(38). Additionally, products sold in food grocery markets, drug stores, retail stores in Tokyo or online stores were all selected. This study included products targeting infants and young children (up to 24 months of age). Products for children older than 24 months were excluded because few products were sold with distinct claims representing the recommended age of ≥ 24 months. Further, baby milk formula was excluded. Products not presenting the recommended age were excluded to distinguish them from other foods not targeting infants and toddlers.
The following information was obtained from the websites: brand name, product name, content weight, nutrient information (per 100 g or serving size), ingredients, food additives, reported serving size, recommended age and price. The nutrient information for energy (kcal), protein (g), total fat (g), carbohydrate (g) and Na (g) were obtained because these were to be mandatorily indicated on the food package in Japan(39). Information on other nutrients, such as Ca, Fe and vitamins, was obtained if available. The price data from online retail or grocery stores were extrapolated. If Akachan-honpo (a large retail store providing baby foods and goods) has the price of the target products, that value was used, because the online store of Akachan-honpo had the largest variety of products among the surveyed stores. Otherwise, the average price of the other grocery stores was used (namely, AEON, SEIYU, LIFE, SUNDRUG, Matsumotokiyoshi, Yodobashi Camera, Toysrus, or else) if the store provided the products. When the price data were unavailable from retail store but available from manufacturers’ websites, those from manufacturers’ websites were used. Data were obtained between March and July 2022. Ethical approval from an institutional review board was not required for this study because no human participants were involved.
Product categories
Products were classified according to the category defined in Supplementary Table 1 by the first author (M.S.) based on the product name, description of the package or website, and ingredients. The second author (X.Y.) checked the categorisation, and any disagreement was resolved by discussion between the two authors (M.S. and X.Y.). The category used in the WHO report(40) was modified to adapt to Japanese baby foods. The ‘soft–wet spoonable, ready-to-eat foods’ and ‘meals with chunky pieces’ categories in the 2019 WHO report were merged into ‘soft meals’, which had three subcategories: ‘cereal-based meal’, ‘meat, fish, cheese, pulses or vegetable-based meal, with rice or noodles’, and ‘meat, fish or cheese or vegetable-based meal without rice or noodles’. New categories were generated for products to which the 2019 WHO report categorisation was inapplicable, such as ‘dry, powdered and instant vegetable/fish/meat’, ‘other non-formula drinks’, ‘tea’, ‘meal accompaniments’, ‘sauce’, ‘soup’ and ‘soup stock powder’. Products were categorised into five major categories (i.e. dry meals, soft meals, snacks and sweets, drinks, and others) and further categorised into subcategories. The recommended age was categorised into six groups based on the label of the products: < 5 months (including products labelled ‘[for infants] from 0 [1, 2, 3, or 4] months,’), 5–6 months (‘from 5 [or 6] months’), 7–8 months (‘from 7 [or 8] months’), 9–11 months (‘from 9 [10, or 11] months’), 12 months (‘from 12 months’), and 1 year 4–6 months (‘[for toddlers] from 1 years and 4 [or 6] months’)
Nutritional profile
The energy density was calculated per 100 g of content. Nutrient densities for protein, fat, carbohydrate and Na were also calculated per 100 g content. Based on the recommendation in CODEX(41), foods containing Na > 200 mg/100 g are considered high-Na foods.
The added sugar content weight (g) is not currently required to be listed in Japan’s food packages, while providing used sugar names (e.g. sugar, glucose, corn syrup, etc.) in the ingredient list is mandated(39). WHO report proposed ‘no added sugar or sweetening agent’ used in commercially available complementary foods for infants and young children between 6 and 36 months(40). Thus, foods containing one or more sources of added sugars were identified from the ingredient list, and their percentage of them was described as an indicator of added sugar. The following ingredients were considered as added sugar based on the WHO report(40): sugar or sucrose, dextrose, fructose, glucose, maltose, galactose, trehalose, (any) syrup, honey, malt extract/malted barley, molasses, and juice (other than lemon or lime juice, as they are not sweet-tasting).
We did not use the nutrient profile model to describe the nutritional characteristics because there is no model applicable to Japanese products. There is no such model defined by the Japanese government for food products for infants and young children. In addition, other profile models such as the Pan American Health Organization Nutrient Profile Model(42) could not be applicable because many products did not show the content amount for some nutrients (including free sugar, saturated fat and trans-fatty acid) used in the existing nutrient profile model.
Food ingredients
The ingredients used were categorised into nineteen food groups: cereals, potatoes, starches, green and yellow vegetables, other vegetables, pulses, mushrooms, seaweed, fruits, eggs, meat, fish and seafood, dairy products, fat and oils, spices, seasonings, soup stocks, sugars and sweeteners, and miscellaneous. Green and yellow vegetables were defined by the Ministry of Labor, Health and Welfare(43), including carrots, spinach, reek, tomatoes, green peppers, garland chrysanthemum (shungiku), mizuna, chives, Japanese mustard spinach (komatsuna), mitsuba, bok choy, broccoli, asparagus, pumpkin, green beans, peas, okra, kale and moroheiya. Other vegetables were classified as ‘other vegetables’. Furthermore, miscellaneous groups included sesame seeds, wine and mirin (i.e. rice-based alcohol for cooking) used for sauce, vitamins or minerals for fortification, lactic acid bacteria, protein hydrolysate, edible eggshell powder, and citric acid.
Analysed products
Of the 873 products obtained, discontinued products during the data collection period (n 71) were excluded because the information was no longer available on the manufacturer’s website (Fig. 1). Next, products categorised into ‘others’ (n 29) and those that did not provide content weight were excluded from the analysis (n 17). Furthermore, products with volume packs or duplicates of other products were excluded from the analysis (n 27). Additionally, meals, snacks and sweets, and drinks from a variety packs or set meals (consisting of two separate meals: one mainly cereal and the other meat/fish and vegetables) were excluded from the analysis if they were duplicates of those in other products, for example, for the set meal ‘fish and rice lunch box’ consisting of two meals, ‘rice with vegetable and fish’ and ‘simmered potatoes and pork’, ‘simmered potatoes and pork’ was included in the analysis, while ‘rice with vegetables and fish’ was excluded because the same meal was also included in another set meal.
Selection of analysed products. Set meal is consisting of two separate meals: one mainly cereal and the other meat/fish and vegetables.

In total, 60 dry meals, 425 soft meals, 187 snacks and sweets, and 60 drinks from 725 products (including 41 set meals and 14 variety packs) of 49 brands were included in the analysis. Among them, forty-five brands were Japanese domestic manufacturers. Only twenty products were imported from five foreign manufacturers, namely baby bio (France), kiwigarden (New Zealand), Frucht bar (Germany) and GL BIO (Korea).
Data analysis
All statistical analyses were performed using the SAS statistical software (version 9.4; SAS Institute Inc.). All reported P-values were two-tailed. To estimate the effect size, Cohen’s d and phi (ϕ) were determined for continuous variables and for categorical variables, respectively. Cohen’s d and phi of 0·2, 0·5 and 0·8 were considered as a ‘small’, ‘medium’ and ‘large’ effect size, respectively(Reference Cohen44,Reference Ferguson45) . The results were interpreted based on P-values and absolute value of Cohen’s d or ϕ, avoiding the use of arbitrary P-value cut-off(Reference Sterne46).
The mean, standard deviation (sd), median, and 25 and 75 percentiles of the product price (yen/100 g) were described. Products were dichotomised by price (Japanese yen/100 g): separately by product-type subcategory and then combined by product-type category for analysis. The median value of the price of products at the product-type subcategory level was used as the tentative cut-off.
A t test was used to examine the differences in content weight and nutrient content between low- and high-priced products. The χ 2 test was used to evaluate differences in the prevalence of products containing Na > 200 mg/100 g(41), using ingredients from each food group, containing at least one added sugar, providing information on nutrients non-mandated to be indicated on the package, and containing food additives. The ingredients used were listed by food group and product category. Usage of sweet-taste vegetables was focused because manufacture may use it for palatability and could label ‘vegetable’ on the package for marketing strategy.
Results
Analysed products primarily came from Wakodo (32 %), followed by Kewpie (12 %), Kindest (11 %) and Pigeon (10 %). Dry meals were mainly targeted at the age groups 5–6 months and 7–8 months (online Supplementary Table 2), while soft meals were mainly targeted at the age groups 7–8 months, 9–11 months and 12 months. The targeted age groups of snacks and sweets differed by subcategories, namely 85 % of ‘confectionery, sweet spreads, and fruit chews’ were mainly used for children aged 12+ months, 100 % of ‘fruit (fresh or dry whole fruit or pieces)’ for 9–11 months and 12 months, 83 % of ‘fruit purée with or without the addition of vegetables, cereals or milk’ for 5–6 months, and 90 % of ‘other snacks and finger foods’ for 7–8 months, 9–11 months, and 12 months. Among drinks, ‘single or mixed fruit juices, vegetable juices’ were targeted at children at 12 months, while ‘other non-formula drinks’ and ‘tea’ were targeted at < 5 months and 5–6 months.
The mean price of products (yen/100 g) was 1290 (sd 1895) for dry meals, 353 (sd 370) for soft meals, 648 (sd 719) for snacks and sweets, and 97 (sd 84) for drinks (Table 1). The mean price of high-priced products was approximately three times that of low-priced products for any food type.
Price (yen/100 g) of commercial complementary foods sold in Japan for infants and young children (< 24 months) by food type

Tables 2 and 3 show the nutrient content of the products and ingredients used in each product category per 100 g by food price groups. The prevalence of products exceeding 200 mg/100 g Na was 17 % for dry meals, 20 % for soft meals, 41 % for snacks and sweets, and 2 % for drinks. The prevalence of products containing ≥ 1 added sugar was 16 % for dry meals, 52 % for soft meals, 84 % for snacks and sweets, and 74 % for drinks. In dry meals, low-priced products contained less starch; however, there was no significant difference in energy and nutrient content compared with those of high-priced products. Low-priced soft meals had less protein and more Na content than high-priced products; nonetheless, they contained less seaweeds and more green and yellow vegetables, other vegetables, meat, fat and oils, spices, seasonings, soup stocks, and sugars and sweeteners than high-priced products. The prevalence of products containing ≥ 1 added sugar was higher in low-priced soft meals (82 %) than in high-priced ones (23 %). Low-priced snacks and sweets had lower protein and Na content than high-priced products. In addition, they contained eggs more frequently. The prevalence of products containing ≥ 1 added sugar was higher in low-priced snacks and sweets (91 %) than in high-priced ones (77 %), although the prevalence was relatively high in both groups. Similarly, low-priced drinks contained less protein. The prevalence of products containing ≥ 1 added sugar was higher in high- (90 %) than in low-priced drinks (48 %).
Comparison of content weight, nutrient profile, and ingredients between low- and high-priced (based on price per 100 g) commercial complementary foods (dry meals and soft meals) sold in Japan for infants and young children (< 24 months)*
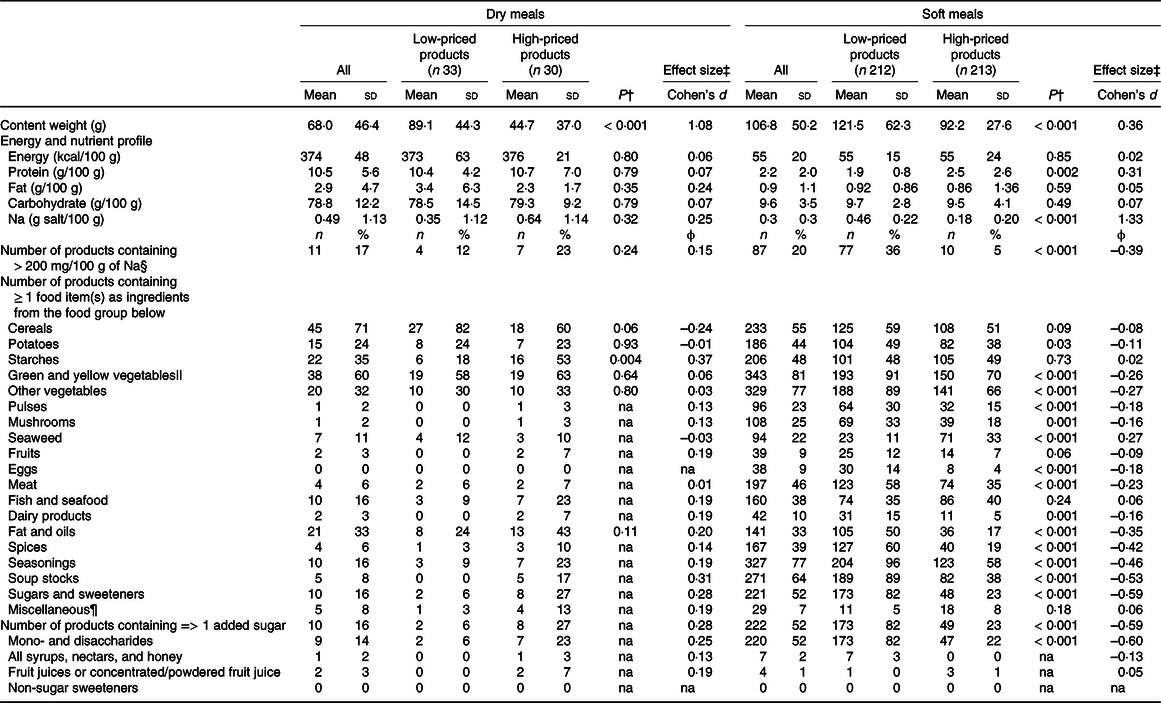
na, Not applicable to be tested by the χ 2 test due to the small number of expected frequencies.
* Products were divided into two groups by price (yen/100 g) separately by product-type subcategory and then combined by product-type categories for analysis. The median value of the price of products at the product-type subcategory level was used as the cut-off.
† P-value by the t test for continuous variables and χ 2 test for categorical variables.
‡ Cohen’s d and phi of 0·2, 0·5 and 0·8 were considered as a ‘small’, ‘medium’ and ‘large’ effect size, respectively.
§ Cited from the CODEX standard for canned baby foods formed by the WHO and FAO of the UN.
|| ‘Green and yellow vegetables’ include carrots, spinach, reek, tomatoes, green peppers, garland chrysanthemum (shungiku), mizuna, chives, Japanese mustard spinach (komatsuna), mitsuba, bok choy, broccoli, asparagus, pumpkin, green beans, peas, okra, kale and moroheiya.
¶ ‘Miscellaneous’ includes sesame seeds, wine and mirin (i.e. rice-based alcohol for cooking) used for sauce, vitamins or minerals for fortification, lactic acid bacteria, protein hydrolyzate, edible eggshell powder, and citric acid.
Comparison of content weight, nutrient profile, and ingredients between low- and high-priced (based on price per 100 g) commercial complementary foods (snacks and sweets and drinks) sold in Japan for infants and young children (< 24 months)*

na, Not applicable to be tested by χ 2 test due to the small number of expected frequency.
* Products were divided into two groups by price (yen/100 g) separately by product-type subcategory and then combined by product-type categories for analysis. The median value of the price of products at the product-type subcategory level was used as the cut-off.
† P-value by the t test for continuous variables and χ 2 test for categorical variables.
‡ Cohen’s d and phi of 0·2, 0·5 and 0·8 were considered as a ‘small’, ‘medium’ and ‘large’ effect size, respectively.
§ Cited from the CODEX standard for canned baby foods formed by the WHO and FAO of the UN.
|| ‘Green and yellow vegetables’ include carrots, spinach, reek, tomatoes, green peppers, garland chrysanthemum (shungiku), mizuna, chives, Japanese mustard spinach (komatsuna), mitsuba, bok choy, broccoli, asparagus, pumpkin, green beans, peas, okra, kale and moroheiya.
¶ ‘Miscellaneous’ includes sesame seeds, wine and mirin (i.e. rice-based alcohol for cooking) used for sauce, vitamins or minerals for fortification, lactic acid bacteria, protein hydrolyzate, edible eggshell powder, and citric acid.
In soft meals, 90 % and 69 % of low-priced products contained carrots and onions, respectively (online Supplementary Table 3); nonetheless, these vegetables were not as dominant in high-priced products (48 % and 55 %, respectively) as in low-priced products. The usage frequency of other sweet-tasting vegetables was also higher in low-priced products, namely pumpkin (25 % in low-priced and 15 % in high-priced products), tomato (29 % and 17 %) and sweet corn (34 % and 10 %) than in high-priced products.
Table 4 presents the number of products that provide information on nutrients non-mandated to be indicated on the package. In general, information regarding saturated fat, dietary fibre, and other micronutrients, except for Ca and Fe, was rarely provided in any product category. For dry products, there was no significant difference in the frequency of information provided on Ca and Fe content. In contrast, high-priced soft meals more frequently provided information about vitamin A, Ca and Fe than low-priced products. Similarly, high-priced snacks and sweets more frequently provided information on dietary fibre, Ca and Fe than low-priced products. Drinks rarely provided information regarding nutrients.
Comparison of the number of products providing content information of nutrients not mandated to show on the package between the low- and high-priced commercial complementary foods sold in Japan for infants and young children*

na, Not applicable to be tested by χ 2 test due to the small number of expected frequencies.
* Products were divided into two groups by price (yen/100 g) separately by product type subcategory and then combined by product-type categories for analysis. The median value of the price of products at the subcategory level was used as a cut-off.
† Cohen’s d and phi of 0·2, 0·5 and 0·8 were considered as a ‘small’, ‘medium’ and ‘large’ effect size, respectively.
The prevalences of products containing food additives are shown in Table 5. No food additives were used in more than half of the dry meals (63 %) and in nearly half of the soft meals (42 %). In contrast, more than half of all snacks and sweets (71 %) and drinks (90 %) contained one or more food additives. Low-priced dry meals and high-priced soft meals contained food additives less frequently than their counterparts. Regarding snacks, sweets and drinks, there was little difference in the frequency of food additive usage and types between low- and high-priced products.
Comparison of food additives between low and high priced (based on price per 100 g) commercial complementary foods sold in Japan for infants and young children (< 24 months)*

na, Not applicable to be tested by χ 2 test due to the small number of expected frequencies.
* Products were divided into two groups by price (yen/100 g) separately by product type subcategory and then combined by product-type categories for analysis. The median value of the price of products at the product-type subcategory level was used as a cut-off.
† Cohen’s d and phi of 0·2, 0·5 and 0·8 were considered as a ‘small’, ‘medium’ and ‘large’ effect size, respectively.
Discussion
To our knowledge, this is the first study to compare the nutrient content, ingredients and food additive usage between the price levels of commercial complementary foods. Additionally, it is the first study to describe the nutritional profile of commercial complementary foods in Japan. The study highlights the potential concerns of a high level of Na in soft meals (> 200 mg/100 g), and the frequency of using ≥ 1 added sugar in soft meals, snacks and sweets, and drinks, although the quantity of added sugar is unknown. Low-priced soft meals had a greater variety of ingredients but less protein, higher Na, and a higher proportion of added sugar than high-price soft meals.
High-priced products had more favourable Na and protein contents for soft meals and snacks and sweets. In addition, high-priced products less frequently used ≥ 1 added sugar and more frequently provided information about vitamin A, Ca, and Fe, less frequently used food additives, and more frequently fortified vitamins and minerals than low-priced products. Although it is unknown whether these high-priced products have on-pack claims about the content of vitamins and minerals, they might use that information as a marketing strategy. Further study is needed to investigate the difference in marketing strategy among products, including on-pack labels and claims among commercial complementary food products in Japan. Surprisingly, high-priced products were over three times more expensive than low-priced products. Large price disparities among products could cause diet disparities between children of different socio-economic statuses(Reference Darmon and Drewnowski23) due to the relatively higher dependence of diet on caregivers at home(32). However, differences in nutrient profiles between the high- and low-priced groups might be relatively small compared with differences between products in Japan and those in other countries. Additionally, the detailed nutritional profile of meals was unknown due to the limited availability of information for nutrients non-mandated to be indicated. In other countries, content information was provided for saturated fat(Reference Maalouf, Cogswell and Bates9,Reference Dunford, Louie and Byrne11,Reference McCann, Russell and Campbell12,Reference Antignani, Francavilla and Vania15) , fibre(Reference Moding, Ferrante and Bellows47) and sugar(Reference Maalouf, Cogswell and Bates9–Reference Dunford, Louie and Byrne11,Reference Antignani, Francavilla and Vania15,Reference Moding, Ferrante and Bellows47,Reference Moumin, Green and Golley48) , although it was rarely provided for other minerals and vitamins(Reference Dunford, Louie and Byrne11), which is similar to the findings of the present study. It is possible that parents choose products based on package claims and images(Reference Hall, Lazard and Grummon49,Reference Jensen, Choi and Fleming-Milici50) rather than nutritional characteristics due to their poor understanding of ingredients. Some parents might believe that higher-priced products are of better quality. Currently, there is no official recommendation in Japan from the Ministry of Health, Labour, and Welfare on how to read the food label for the population. A previous study reported that only 35·9 % of women with higher educational backgrounds ‘always’ or ‘sometimes’ read food labels while shopping(Reference Sugimoto, Asakura and Masayasu51). Although there is no study about the frequency of reading labels among Japanese parents to our knowledge, it is not expected that the proportion would be substantially higher than that for women with higher education. Thus, for appropriate food selection among parents, more detailed information on nutrient content and consumer education is required.
Soft meals formed the largest fraction of products included in this study, with the most substantial differences observed in nutrient profiles between price levels. The energy density (55 kcal/100 g) observed in this study was similar to or lower than that observed in previous studies conducted in other countries (60–99 kcal/100 g)(Reference García, Raza and Parrett8,Reference Dunford, Louie and Byrne11,Reference McCann, Russell and Campbell12,Reference Alexy, Dilger and Koch14,Reference Garcia, McLean and Wright20,Reference Moding, Ferrante and Bellows47,Reference Moumin, Green and Golley48,Reference Katiforis, Fleming and Haszard52) . In addition, soft meals in Japan had similar protein content (2·2 g/100 g) to those in the UK (2·6–3·1 g/100 g)(Reference García, Raza and Parrett8,Reference Garcia, McLean and Wright20) , Germany (1·4 g/100 g)(Reference Alexy, Dilger and Koch14) and South-East Asian countries (1·9–3·2 g/100 g)(Reference Bassetti, Zehner and Mayhew18); however, they had lower protein content than soft meals in Australia (2·2–4·4 g/100 g)(Reference Dunford, Louie and Byrne11,Reference McCann, Russell and Campbell12,Reference Moumin, Green and Golley48) and Italy (1·8–6·0 g/100 g)(Reference Antignani, Francavilla and Vania15). The total fat content in soft meals observed in this study (0·9 g/100 g) was also similar to or lower than that in previous studies(Reference García, Raza and Parrett8,Reference McCann, Russell and Campbell12,Reference Alexy, Dilger and Koch14,Reference Antignani, Francavilla and Vania15,Reference Bassetti, Zehner and Mayhew18,Reference Garcia, McLean and Wright20,Reference Moumin, Green and Golley48) (0·5–3·2 g/100 g). The WHO proposed the minimum energy density to be 60 kcal/100 g, minimum protein content, > 3·0 g/100 kcal, and maximum total fat content, 4·5 g /100 kcal for commercially available soft–wet spoonable, ready-to-eat foods(40). Although soft meals have acceptable fat content, improving their energy and protein levels may be required, considering the recommendation by the WHO and the content of products in other countries.
The Na content in commercial complementary foods in Japan is relatively high compared with other countries. A previous study in the USA also reported potential concerns about higher Na content(Reference Maalouf, Cogswell and Bates9): the mean Na content was 30 mg/100 g (0·076 g salt/100 g) in ‘dinners, soups, and vegetables, stages 2 and 3’ for infants, 174 mg/100 g (0·44 g salt/100 g) in ‘dinners or meals’ for toddlers, and 447 mg/100 g (1·13 g salt/100 g) in ‘savoury snacks’. Furthermore, the proportion of products exceeding a Na content of 200 mg/100 g was 0 % for products for infants, 5 % for ‘dinners or meals’ and 69 % for ‘savoury snacks’(Reference Maalouf, Cogswell and Bates9). In other studies, the Na content of soft meals was approximately 10–60 mg/100 g (0·02–0·15 g salt/100 g)(Reference García, Raza and Parrett8,Reference Alexy, Dilger and Koch14,Reference Antignani, Francavilla and Vania15,Reference Bassetti, Zehner and Mayhew18,Reference Moumin, Green and Golley48) . Although the association between early-life exposure to tastes and taste preference in later life is controversial(Reference Schwartz, Scholtens and Lalanne4,Reference Müller, Chabanet and Zeinstra53–Reference Yuan, Nicklaus and Forhan55) , it is possible that exposure to salty foods in early life is associated with easy acceptance of salty tastes in later life. Due to the higher Na intake in Japanese adults(Reference Asakura, Uechi and Sasaki26), infants and young children in Japan could be easily exposed to a higher Na diet both at their current age and in the future. The Dietary Reference Intakes for Japanese recommends < 3·0 g/d salt intake for children aged 1–2 years(Reference Foterek, Buyken and Bolzenius56). However, the adherence rate to this recommendation in this age group is unknown. Moreover, it is also unknown how commercial complementary food contributes to Na intake in this age group. A more dietary survey targeting infants and toddlers is warranted in Japan.
This study found frequent use of ≥ 1 added sugar in soft meals, snacks and sweets, and drinks. This is consistent with the findings of other studies that showed a higher proportion of snacks and sweets containing ≥ 1 added sugar. However, the proportion of meals with ≥ 1 added sugar in our study (16 % of dry products and 52 % of soft meals) was relatively higher than in other studies(Reference Cogswell, Gunn and Yuan10,Reference Hutchinson, Rippin and Threapleton13,Reference Bassetti, Zehner and Mayhew18) . For example, in the USA, the proportion of meals with ≥ 1 added sugar was only 4 % in those for infants and 32 % in those for toddlers(Reference Cogswell, Gunn and Yuan10). Manufacturers might use added sugar as seasoning due to preferences for sweet taste among children(Reference Schwartz, Scholtens and Lalanne4). These sweet tastes can mask the taste and flavour of individual ingredients. Additionally, exposure to added sugar during infancy might result in higher added sugar intake later in life(Reference Foterek, Buyken and Bolzenius56). Although the amount of added sugar is unknown in Japanese commercial complementary foods, manufacturers should avoid using added sugar in complementary foods as much as possible.
Surprisingly, low-priced soft meals contained a greater variety of ingredients than high-priced products. The proportion of products containing at least one food item from a specific food group was higher for low-priced than for high-priced products in thirteen food groups (excluding cereals, starches, fruits, fish and seafood). A previous study showed that a variety of flavours in early life might result in higher dietary quality in childhood(Reference Switkowski, Aris and Gingras1). Hence, lower-priced soft meals are favourable for food variety. We found that 90 % and 80 % of low-priced soft meals contained carrots and onions as ingredients, respectively. The frequent use of carrots and less use of bitter vegetables were consistently reported in the previous studies in Germany(Reference Alexy, Dilger and Koch14), the USA(Reference Moding, Ferrante and Bellows19) and the UK(Reference Garcia, McLean and Wright20). The carrot use frequency in this study (90 % of soft meals) was much higher than that in other studies from the USA(Reference Moding, Ferrante and Bellows19) (31·9 %) and the UK(Reference Garcia, McLean and Wright20) (19·4 %). The frequency of using bitter vegetables in this study (15 % for spinach and 15 % for broccoli) was much lower than that of carrots, although it was higher than that in studies from the USA (2·0 % for spinach and 2·4 % for broccoli)(Reference Moding, Ferrante and Bellows19) and the UK (13·5 % for spinach and 7·3 % for broccoli)(Reference Garcia, McLean and Wright20). The frequent use of sweet-tasting vegetables may reflect the innate preferences of infants for sweet tastes(Reference Schwartz, Scholtens and Lalanne4). The manufacturers probably mixed several vegetables and used sweet tastes to increase the acceptance of the products(Reference Caton, Ahern and Hetherington57). Similarly, serving mixed fruits and vegetables in one meal was a common dietary practice by parents in the UK(Reference Caton, Ahern and Hetherington57). Thus, although providing a variety of products in one meal is practical and convenient, children should be provided with single foods, including vegetables, and repeatedly exposed to the same food during the weaning process to increase food acceptability(Reference Spill, Johns and Callahan58).
In the present study, 37 % of dry meals, 58 % of soft meals, 71 % of snacks and sweets, and 90 % of drinks include one or more food additives. Some of them only include compounds of vitamins, Ca, and Fe as additives, and others contain additives exclusively used in ultra-processed foods, including flavours, colours, emulsifiers, artificial sweeteners and thickeners(Reference Monteiro, Geoffrey and Mark59). Thus, some of these products might be categorised as ultra-processed foods. In a previous study, 90·6 % of baby biscuits and rusks, 74·1 % of baby snacks, and 79·2 % of baby savoury meals and dishes were categorised as processed or ultra-processed products in European countries(Reference Grammatikaki, Wollgast and Caldeira16). The proportion of ultra-processed foods in snacks might be comparable between the current and previous studies. The association between ultra-processed foods and the nutritional and quality of national diets has been concerned. Further study is needed to investigate those association in infants and young children regarding usage of commercial complementary foods in Japan.
The contribution of commercial complementary foods to dietary intake has been increasing in young children(Reference Theurich, Zaragoza-Jordana and Luque5–7). For example, a study in five European countries showed that over 75 % of energy intake comes from commercial complementary foods at 4–6 months, which decreases to about 30–40 % at 7–12 months(Reference Theurich, Zaragoza-Jordana and Luque5). No previous study has shown the contribution of commercial complementary foods to diet among young children in the Japanese population. According to the guidelines for weaning by the Ministry of Health, Labour, and Welfare in Japan, preparing complementary food at home is recommended, but using commercial complementary foods is one of the ways to reduce the burden of preparation among parents(60). Additionally, the guide referred to some concerns about commercial complementary foods; however, their scientific evidence or supporting data were not shown(60). Further studies are needed to examine the intake amount and dietary contribution of commercially available foods and their influence on child development for evidence-based recommendations. A nutrient content database of commercially available food is needed for further studies.
This study has some limitations. First, we used the price per weight to compare the products. Previous studies have shown that using different units (price per energy and serving) can yield different results(Reference de Abreu, Charlton and Probst61). In addition, the price per unit weight may be difficult to interpret. However, it was difficult to calculate the price per energy and serving using the available data. Some products, such as drinks and vegetable-based meals, have low or no energy content. The serving size was not provided and could change with the children’s age. Therefore, the use of price per weight was more appropriate and feasible for this study. Second, comparing our results to those of other studies is challenging because the product-type categories used in this study were not identical to those used in previous studies. We initially attempted to classify products according to the categories proposed by the WHO(40) for standardisation. However, we had to modify it for application to Japanese products because the WHO categories, which were defined based on the products available in European countries, are not always applicable to products in non-European countries. Moreover, previous studies used their own classification methods. Hence, it is necessary to establish a global standard for the classification of commercial complementary foods and corresponding nutritional criteria for the healthy development of infants and young children. Third, we could not collect some products rarely sold online or only be available in physical stores in other areas than Tokyo. However, we intended to cover commercial complementary foods sold in Japan as much as possible, by including products from five leading manufacturers and those reached out from the physical and online stores. Thus, the representativeness of the sample in this study might be acceptable. Fourth, we used the median price value as the tentative cut-off value to dichotomise the products because there is no clear cut-off to identify high-priced products. It could be possible that some products were misclassified into high-priced products due to small weight content. Lastly, we could not describe the quantity of sugar content. Although we compared the proportion of products containing ≥ 1 added sugar according to the WHO guideline of ‘no added sugar or sweetening agent’(40), the results might differ when comparing added sugar content amount. Some products with only one added sugar may have a higher overall content of added sugar than one with ≥ 2 added sugars. Contrarily, it might not be a concern if a product only contains a tiny amount of added sugar. Thus, the results focusing on the proportion of products with ≥ 1 added sugar without sugar amount should be interpreted with caution.
In conclusion, there are concerns about the high salt content, frequent usage of added sugars and lack of information on micronutrients in commercial infant foods in Japan. There is little difference in energy, fat and carbohydrate content between low- and high-priced commercial complementary foods in Japan. Furthermore, although higher-priced soft meals may have less ingredient variety, they tend to be more nutritionally favourable in terms of protein, salt and added sugars. This study contributes to understanding the nutritional characteristics of commercial complementary foods in Japan. Further studies are needed to examine the contribution of commercial complementary foods to dietary intake among Japanese children and their association with household income.
Acknowledgements
The authors and their colleagues thank Editage (www.editage.jp) for English language editing and Ms. Riho Adachi for supporting the project.
This research received no specific grant from any funding agency, commercial or not-for-profit sectors.
Conteptualiaztion, M. S. and Y. X.; data curation, M. S. and Y. X.; formal analysis, M. S.; investigation, M. S. and Y. X.; methodology, M. S. and Y. X.; project administration, M. S.; software, M. S.; supervision, K. U. and S.S.; visualization, M. S.; writing – original draft preparation, M.S.; writing – review & editing, Y. X., U.K., and S.S. All authors contributed to the development of the manuscript.
There are no conflicts of interest.
Supplementary material
For supplementary material/s referred to in this article, please visit https://doi.org/10.1017/S0007114523000612


 Open access