Iodine deficiency disorders (IDD) are a group of diseases caused by long-term iodine deficiency among residents in iodine deficiency areas. Iodine deficiency induces endemic goitre, hypothyroidism and cretinism and even increases the risk of premature birth, miscarriage, stillbirth, congenital malformation and infant mortality(Reference Zimmermann1).
China is among the countries that most affected by IDD globally. Since China launched the policy of Universal Salt Iodisation (USI) in 1995, the iodine nutrition of Chinese residents has shown great improvement. In China, the iodine content in salt had been adjusted for three times to obtain the best effect of the USI policy. An upper limit for iodine content in iodised salt (no more than 60 mg/kg) was established in 1996(Reference Duan, Chen and Li2,3) . Due to the high median of urinary iodine concentration (MUIC) in children, the iodine content was modified into 35 ± 15 mg/kg in 2000. Then, in 2012, the new national iodised salt standard published has modified from one nationwide unified salt iodine content (SIC) to three recommended SIC of 30 ± 30 %, 25 ± 30 % or 20 ± 30 % mg/kg, and one or two of them could be selected by each province according to the local iodine nutrition situation(4). The success of USI could be evidenced by the fact that since 2005, China has been in a sustainable IDD elimination status, and by 2010, all provinces and 95 % of counties had eliminated IDD(Reference Sun, Codling and Chang5).
Thyroid goitre rate (TGR) can reflect the long-term iodine intake of the population. There is no prevalence of IDD when TGR of school-age children (aged 6–12 years) is below 5 %, recommended by the WHO(6). To evaluate the index of TGR, the thyroid volume (TVOL) of children measured by ultrasound was used. Although characterised by its objectivity and easy harvesting, the TVOL also has numerous influencing factors: iodine, for instance, and growth and development factors(Reference Hegedus7,Reference Zimmermann, Ito and Hess8) .
Meanwhile, the mean height and weight of Chinese children and adolescents had a steady increase during the period of 1975–2010(Reference Zong and Li9) and thereafter. A study conducted in China showed that from 1995 to 2014, the mean height increased by 3·2–4·5 cm for urban and rural children and the mean weight increased by 5·4–5·6 kg, respectively(Reference Dong, Jan and Ma10). The continuous growth of height and weight indicates that the overall developmental status of children has been significantly improved, which may also raise the TVOL accordingly.
Currently, under the policy of USI, the association between iodine supplementation, improved developmental levels of children and TVOL is still unclear. Therefore, the aim of this study was to analyse whether salt iodisation decreased TVOL; whether the TVOL increased as a result of raised height and weight and whether there was an interaction between them.
Materials and methods
Data sources
The TVOL-monitored data in school-age children from five national IDD surveys (2002, 2005, 2011, 2014 and 2019) in China were adopted in the research, which have not been published, but the results and monitoring reports have been published in book form already. The Probability Proportional to Size method of sampling at provincial level was used in 2005, 2011 and 2014 National IDD surveys: determining thirty counties in each province. According to the random sampling method, a primary school was selected from each county, with 40 (2005)/50 (2011, 2014) students aged 8–10 years were randomly selected from each school. As for 2002, all provinces were treated under the same conditions, without stratification. In 2019, all counties in China were incorporated in survey and five primary schools were randomly selected from each side of the county’s East, South, West, North and Central. Each school stratifies children by age and ensures that the final numbers of 8, 9 and 10 years old obtained are close to 1:1:1.
Evaluation standards
The operators of thyroid ultrasound were trained by national experts or trained by nationally accredited provincial professionals. For thyroid detection, both sides of thyroid were measured by ultrasonic machine with frequency of probe 7·5 MHz or above, without taking isthmus into account. The volume was calculated by the WHO criteria using formula of ellipsoid correction as follows: $volume of each side=0{\cdot} 479\times {\rm L} \times {\rm W} \times {\rm D} /1000$
, where L, W and D represent the maximum length, width and thickness of thyroid lateral lobe, respectively. The total TVOL was compared with the reference value of TVOL stipulated by China according to children’s age. Thyroid with volume > 4·5 ml at age of 8 years, > 5 ml at 9 years or > 6 ml at 10 years was considered to be enlarged. Body surface area in m2 was calculated using the formula: weight0·425 × height0·725 × 71·84 × 10−4. The height for age Z-score and weight for age Z-score (WAZ) were calculated for children of different ages and sexes using 2019 national IDD survey children as the reference population.
$volume of each side=0{\cdot} 479\times {\rm L} \times {\rm W} \times {\rm D} /1000$
, where L, W and D represent the maximum length, width and thickness of thyroid lateral lobe, respectively. The total TVOL was compared with the reference value of TVOL stipulated by China according to children’s age. Thyroid with volume > 4·5 ml at age of 8 years, > 5 ml at 9 years or > 6 ml at 10 years was considered to be enlarged. Body surface area in m2 was calculated using the formula: weight0·425 × height0·725 × 71·84 × 10−4. The height for age Z-score and weight for age Z-score (WAZ) were calculated for children of different ages and sexes using 2019 national IDD survey children as the reference population.
SIC was determined by direct titration. SIC <5 mg/kg is considered to be non-iodised salt. The iodised salt is considered to be qualified iodised salt when its SIC is within the standard permitted range. Coverage rate of iodised salt (CRIS) and consumption rate of qualified iodised salt (CRQIS) were the ratio of iodised salt or qualified iodised salt to the total number of salts tested.
Statistical analysis
Figure 1 describes the flow of data processing and analyses. The first step is to pair the data according to the purpose of analysis, whereby four pairs were established; Pair 1 (2002 and 2019) with data includes height and weight; Pair 2 (2011 and 2014) contained data before and after the reduction of SIC; Pair 3 (2005 and 2011) included data under the same SIC, but different CRIS and CRQIS level; Pair 4 (2019) divided data of same iodine supplement measures into children with goitre or not.
Flow chart of paired data analysis.

In the second step, the county-level data of each pair were matched based on county names, those surveyed in both two different years for pairs 1, 2 and 3 were included, separately, otherwise, it was excluded. Among the included counties, for the same county, 1:1 random pairing method was used to match survey subjects according to the same age and sex. When influences of height and weight between subjects need to be excluded, similar height and weight were added to the matching condition (the difference of height and weight between two subjects is <10 cm and 5 kg, separately); when differences in SIC between subjects needed to be excluded, similar SIC were added (the difference of SIC is <5 mg/kg between two subjects). The redundant unmatched data and counties with subject’s sample size < 10 in each pair were deleted.
SPSS 22 (Polar Engineering and Consulting) was used to calculate the data difference and establish the scatter plot. Scatter plot was created to analyse the trend of TVOL with different influencing factors. Continuous variables with normal distribution were presented as mean values and standard deviation (such as height and weight), while median and interquartile range were used to describe skewed distribution (such as TVOL). For data obtained after pairing and matching, paired-samples t test or Wilcoxon signed-rank test was used to compare the difference of data with normal or skewed distribution. Pearson correlation and multiple linear regression analyses were conducted for each county as a sample in 2019 to test the relationship between mean height, mean weight, MUIC, mean salt iodine (MSI), CRIS, CRQIS and mean TVOL for children of different ages. The same correlation and multiple linear regressions were then performed again using mean height for age Z-score and mean WAZ for each county instead of mean H and mean W. The 3D colour map with surface projection was used to analyse the influence of height and weight on TVOL after excluding the influence of iodine supplement measures, drawn by the data with county CRIS > 95 % and CRQIS > 90 %. The P value of test < 0·05 indicates the statistically significant.
This study was conducted according to the guidelines laid down in the Declaration of Helsinki, and all surveys were approved by the National Health Commission of the People’s Republic of China and the Harbin Medical University. Written informed consent was obtained from guardians of children.
Results
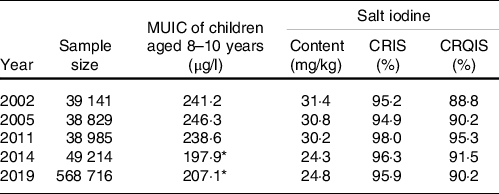
The basic information of sample size, urine iodine and salt iodine for IDD surveillance of 2002, 2005, 2011, 2014 and 2019 is presented in Table 1. Table 2 summarises the sample size, TVOL and TGR of children in 2002, 2005, 2011, 2014 and 2019.
Basic information of sample size, urine iodine and salt iodine for iodine deficiency disorders (IDD) surveillance of 2002, 2005, 2011, 2014 and 2019 (Percentages)

MUIC, median of urinary iodine concentration; CRIS, coverage rate of iodized salt; CRQIS, consumption rate of qualified iodized salt.
* P < 0·01 compared with all other four groups.
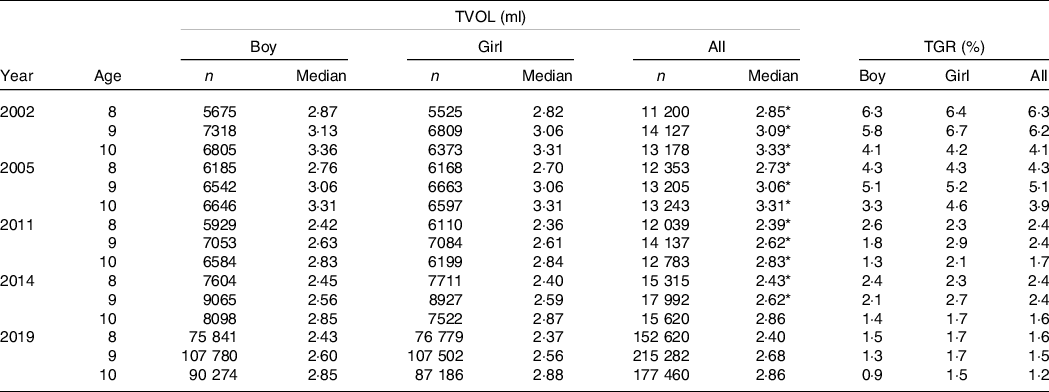
Thyroid volume (TVOL) of 8–10-year-old children of different sexes in 2002, 2005, 2011, 2014 and 2019 surveys
(Numbers and percentages; median values)

TGR, thyroid goitre rate.
* P < 0·05, compared with children of the same age in 2019.
Changes of height, weight and thyroid volume in children
In Pair 1 (data of 2002 and 2019), a total of 6769 pairs with the same sex and age were finally matched in 2 years. The mean of height and weight in 2019 (136·2 ± 8·5 cm and 32·1 ± 8·9 kg) was significantly higher than those in 2002 (129·9 ± 7·6 cm and 26·9 ± 5·7 kg), P < 0·001. The median of TVOL in 2019 (2·64 ml, Q1–Q3:2·042–3·414 ml) was significantly lower than those in 2002 (2·86 ml, Q1–Q3:2·14–3·67 ml), P < 0·001 (This part is not represented in the table).
Changes of thyroid volume with similar height and weight conditions
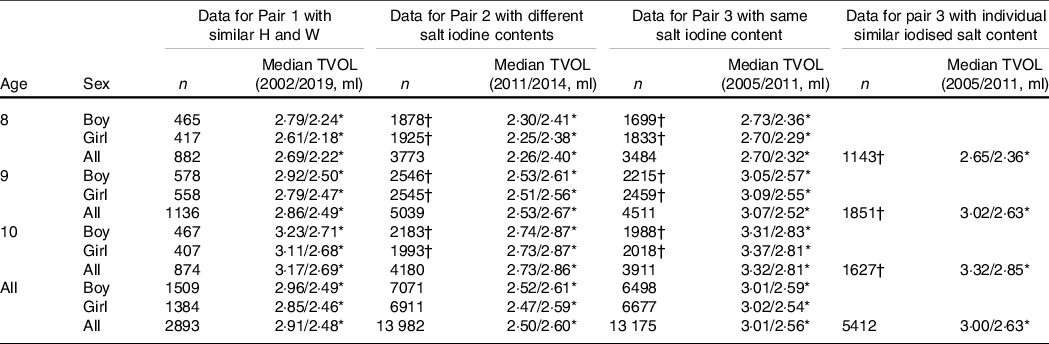
In Pair 1 (2002 and 2019), the association between height, weight and TVOL was analysed. The mean and median of TVOL in different height, weight and salt iodine groups are shown in Fig. 2. The mean and median of TVOL increased significantly with the increase of weight in both 2002 and 2019 (P trend < 0·05). Similar trend was also found in height (P trend < 0·05). On the other side, in order to exclude the influence of height and weight on TVOL, pairwise conditions of height and weight were added to the Pair 1 data. After being paired by same county, age, sex and similar height and weight, the median TVOL of all children in 2002 and 2019 was 2·91 (Q1–Q3:2·12–3·76 ml) and 2·48 (Q1–Q3:1·89–3·18 ml), respectively, and there were significantly differences (P < 0·001) between them. Such a difference was found in different age and sex groups (Table 3).
Mean and median thyroid volume (TVOL) of height, weight and salt iodine groups in 2002 and 2019. (a) Mean and median TVOL for each group stratified by height range of 5 cm; (b) mean and median TVOL for each group stratified by weight range of 5 kg; (c) mean and median TVOL for each group stratified by salt iodine; groups of salt iodine were divided by 3 mg/kg based on the latest iodised salt content range of 18˜39 mg/kg; (d) mean and median TVOL for each group stratified by age; (e) mean and median TVOL for each group stratified by body surface area (BSA); H, height; W, weight; SI, salt iodine; ○, median TVOL of 2019; ●, mean TVOL of 2019; Δ, median TVOL of 2002; ▲, mean TVOL of 2002.

Median thyroid volume (TVOL) of children in pairs of 2002 and 2019, 2011 and 2014, and 2005 and 2011
(Numbers and median values)

H, height; W, weight.
* P < 0·05.
† Counties with subject’s sample size < 5 in each pair were deleted.
Association between different salt iodine content and thyroid volume
In Pair 2 (data of 2011 and 2014), 13 982 pairs were ultimately matched of the same age and sex simultaneously in each year.
As shown in Table 3, the median TVOL of 2014 (2·60 ml, Q1–Q3:2·03–3·26 ml) after the reduction of SIC was higher than that of 2011 (2·50 ml, Q1–Q3:1·83–3·22 ml) with higher SIC (P < 0·001). Such differences were also found in different age and sex groups.
Thyroid volume changes under the same salt iodine standard and different coverage rate of iodised salt and consumption rate of qualified iodised salt
Using data from Pair 3 (2005 and 2011, with same salt iodine standard), 13 175 paired children were eventually obtained of the same age and sex from each year. The median TVOL of all children in 2011 (2·56 ml, Q1–Q3:1·85–3·29 ml) was significantly lower than in 2005 (3·01 ml, Q1–Q3:2·375–3·798 ml) (P < 0·001); the same differences were found across age and sex groups (Table 3).
An additional matching condition for similar SIC for each paired subject was added to the Pair 3 data to exclude the influence of individual SIC on TVOL. Among all 5412 matched pairs of children, the median TVOL for all children in 2011 (2·63 ml, Q1–Q3:1·92–3·36 ml) was significantly lower than in 2005 (3·00 ml, Q1–Q3:2·34–3·80 ml) (P < 0·001). Comparisons by age group rather than sex group were made due to insufficient matched data, but differences were also found in the median TVOL between years (Table 3).
Beside the SIC, the CRIS and CRQIS may also influence the TVOL. As shown in Fig. 3, the correlation of the fitting curve of each scatter plot is negative; the determination coefficients of the mean TVOL with CRIS and CRQIS were 0·67 and 0·73, whereas median TVOL were 0·27 and 0·63, respectively.
Mean and median thyroid volume (TVOL) of Coverage Rate of Iodized Salt (CRIS) and Consumption Rate of Qualified Iodized Salt (CRQIS) groups in 2005. (a) Mean and median TVOL for each group stratified by provincial CRIS; (b) mean and median TVOL for each group stratified by provincial CRQIS; ●, mean TVOL in 2005; Δ, median TVOL in 2005.

Association between height, weight and thyroid volume under the same coverage rate of iodised salt and consumption rate of qualified iodised salt
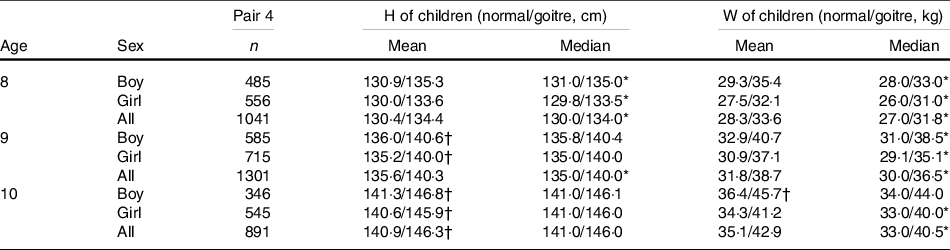
In Pair 4, children of areas where CRIS > 95 % and CRQIS > 90 % in 2019 were divided into two groups, based on whether each child was goitre or not. Group of children with goitre has higher mean or median of height and weight than group of children with normal thyroid (P < 0·001) (Table 4). This difference remained significant when compared between areas with goitre rates >5 % or not.
Comparison of height (H) and weight (W) between normal and goitre children in 2019
(Numbers; mean and median values)

* If the difference between normal and goitre children conforms to abnormal distribution, the non-parametric test was used to compare the median value. P < 0·05.
† If the difference between normal and goitre children conforms to normal distribution, the Paired t test was used to compare the mean value. P < 0·05.
The median TVOL showed an upward trend with increasing height and weight in the 3D plot. The median TVOL peaked in the maximum height and weight group (Fig. 4).
3D colour map surface with projection of median thyroid volume (TVOL) for height and weight groups in 2019; the X-axis is the mean value of each height grouping, the Y-axis is the mean value of different weight groupings corresponding to each height grouping, and the Z-axis is the median TVOL corresponding to each height and weight grouping; (a) median TVOL for height and weight group of children aged 8–10 years; (b) median TVOL for height and weight group of 8-year-old children; (c) median TVOL for height and weight group of 9-year-old children; (d) median TVOL for height and weight group of 10-year-old children.

Association of height, weight and various iodine supplementation measures with thyroid volume
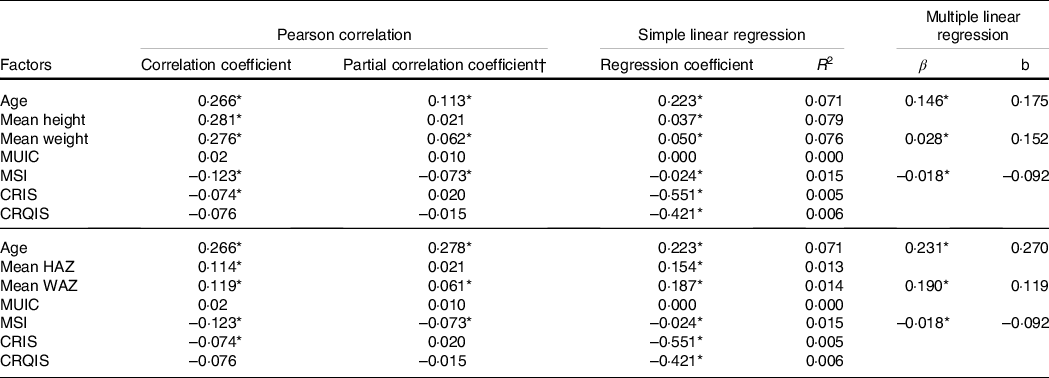
The Pearson correlation analysis showed that TVOL was significantly correlated with age (Pearson correlation coefficient, PCC = 0·266, P < 0·001), mean height (PCC = 0·281, P < 0·001), mean weight (PCC = 0·276, P < 0·001), MSI (PCC = –0·123, P < 0·001) and CRIS (PCC = –0·074, P < 0·001), and the results are shown in Table 5. However, TVOL did not show a significant correlation with MUIC and CRQIS.
Correlation and regression analysis between various factors and mean thyroid volume (TVOL) of children aged 8–10 years by county
(Coefficient values, n 3272)

MUIC, median of urinary iodine concentration; MSI, mean salt iodine; CRIS, coverage rate of iodised salt; CRQIS, consumption rate of qualified iodised salt; HAZ, height for age Z-score; WAZ, weight for age Z-score; R 2, coefficient of determination; β, partial regression coefficient; b, standardised partial regression coefficient.
Simple linear regression was used to screen the baseline factors for the multiple linear regression, and the stepwise selection method was used to select the baseline factors.
* P < 0·05.
† All other factors were used as control variables in the analysis of the partial correlation between a factor and mean TVOL.
After excluding the interference of other factors, the correlations between mean height, CRIS and TVOL were disappeared, while the correlations between age, mean weight, MSI and TVOL remained significant. The standardised partial regression coefficients for mean weight and MSI were low in the multiple linear regression analysis (b = 0·028 and −0·018, respectively, P < 0·001), whereas age was relatively stronger (b = 0·146, P < 0·001). After using mean height for age Z-score and mean WAZ instead of mean H and mean W, similarly only AGE, mean WAZ and MSI were statistically significant in partial correlation and multiple linear regression with mean TVOL.
In the non-linear fit, goodness of fit between median or mean TVOL and mean height or mean weight was better than the linear fit (median TVOL in height group, y = 0·5684e0·0112x , R 2 = 0·9926; in weight, y = 1·0947ln(x) – 1·1452, R 2 = 0·9846; mean TVOL in height group, y = 0·5979e0·0112x , R 2 = 0·9905; in weight group, y = 1·1673ln(x) – 1·276, R 2 = 0·9895). But, linear fitting was more suitable to describe the relationship between TVOL and SI (median TVOL in SI group, y = −0·0083x + 2·7832, R 2 = 0·974; mean TVOL, y = −0·0092x + 2·9343, R 2 = 0·9701) (Fig. 2).
Discussion
USI can improve the iodine nutritional status of the population as well as reduce TGR(Reference Azizi, Mehran and Sheikholeslam11,Reference Bonofiglio, Catalano and Perri12) , while the SIC plays a crucial role in the process. Previous studies have shown that UIC of children in Shanghai has been optimal before and after the reduction of SIC in 2012, and the TVOL showed a negative correlation with SIC(Reference Wang, Liu and Su13). In this study, the multiple linear regression showed a significant negative correlation between the mean salt iodine and the mean TVOL in each unit of county. Furthermore, it is also found that after down-regulated SIC in 2012, the median TVOL in 2014 was slightly higher than in 2011; the difference between two researches is that the MUIC of children was decreased into 197·9 μg/l in 2014 from 238·6 μg/l in 2011. However, according to ChaoHong’s study, TVOL was reduced by decreasing the SIC when MUIC of children located in the 200–299 μg/l(Reference Chao, Zhang and Liu14). As a result, the iodine content in salt might not be the main reason of why TVOL and TGR were greater in 2014 than in 2011. Conversely, the declined CRIS and CRQIS from 2011 to 2014 may be a possible explanation. For further excluding the influence of SIC, data of 2011 and 2005 were compared and found that the median TVOL in 2011 was significantly smaller than that in 2005, suggesting that excluding SIC, the implementation of iodine supplementation measures (such as CRIS and CRQIS) may also affect TVOL. After analysis, the negative growth trend of TVOL with increase CRIS or CRQIS indicates that strengthen on iodine supplementation did lead to the decrease of TVOL.
CRIS showed relatively weak correlations with mean TVOL across counties, probably because environmental and customary factors differed from region to region, such as water iodine concentration and dietary habits. Since salt can only be judged to be qualified iodised if it contains iodine and its iodine content is in certain limit, it is more likely that high CRQIS and high CRIS in an area may occur at the same time. This may be the reason why the significant negative correlation between CRIS and mean TVOL disappears when controlling for other variables such as CRQIS.
As the evaluation indicator for public health, physical development reflects the long-term environmental effects on the population, reveals the public nutritional status, as well as provides numerous references for disease diagnosis(Reference Tanner15,Reference Cole16) . The results of this paper and many other studies show that height and weight are still in the stage of continuous growth in China(Reference Zong, Li and Wu17,Reference Zhang, Li and Wu18) .
Studies have found that both height and weight were correlated with TVOL and the TVOL can be well predicted by them(Reference Mo, Lou and Mao19–Reference Xu, Sullivan and Houston22), especially weight on TVOL(Reference Hegedus, Perrild and Poulsen23). In this study, TVOL increased significantly with the increase of weight and height, and both height and weight were significantly correlated with TVOL in simple linear regression. However, after excluding the influences of other factors, the correlation between TVOL and height was no longer significant, which indicates that the effect of height on TVOL may be expressed through factors such as age and weight. TVOL in obese and overweight people was also positively correlated with physical developmental indicators such as height and weight(Reference Lass, Barth and Reinehr24), and Sari et al. found a significant reduction of TVOL in women who lost more than 10 % of their body weight(Reference Sari, Balci and Altunbas25); Licenziati et al. also concluded that TVOL in children and adolescents showed a reversible reduction after weight loss(Reference Licenziati, Valerio and Vetrani26,Reference Eray, Sari and Ozdem27) . A recent study on BMI and iodine nutritional status showed that the relationship between BMI and urinary iodine in children was unclear, but those children who were overweight or obese had greater TVOL(Reference De Angelis, Bagnasco and Moleti28).
The above findings on the association between height, weight and TVOL were sufficient to show that the policy of USI could decrease population’s TVOL; the TVOL of Chinese children has increased along with growth and development. The present study indicating that the measure of iodine supplementation can conceal or even reverse the effects of increased TVOL caused by the long-term growth of height and weight.
Conversely, in this study, a greater height and weight of goitre children than normal children were found in areas where the rate of goitre in children was >5 %. Studies on goitre and child growth report conflict results. In northern Zaire(Reference Van den Broeck, Eeckels and Van Loon29), children with goitre are taller and heavier than children with normal TVOL; however, this difference was only seen between children aged 2 and 4 years. In Greece(Reference Koutras, Christakis and Trichopoulos30), school-age children in endemic goitre areas showed decreased height and weight compared with children in non-endemic areas. Those studies above are not well explained as the unknown iodine intake and excretion. In this study, the median urinary iodine was between 100 μg/l and 200 μg/l in both children with goitre or not, and the influence of iodised salt was also excluded. The results indicate that children of the same age were more likely to be determined as goitre if they were taller or heavier, so it makes sense to establish a reference standard based on height and weight. A reference standard based on body surface area can combine H and W, but this requires measuring both H and W, which may increase the workload during the IDD survey. And, the body surface area will change dramatically when either H or W is not measured accurately. In addition, a reference value for TVOL based on body surface area is recommended in countries with a high prevalence of child growth retardation due to malnutrition(6), but this may be misleading for countries with a high prevalence of overweight and obese children(Reference De Angelis, Bagnasco and Moleti28).
As multiple linear regression analysis revealed that age, mean weight and mean salt iodine had an effect on TVOL. Comparison of standardised partial regression coefficients revealed that age had the greatest effect on TVOL, followed by weight and salt iodine. Using height for age Z-score and WAZ instead of H and W, a multiple regression analysis was performed again, since both height and weight are related to age and sex. The results were similar which demonstrate that our judgement of the association between age, weight, MSI and TVOL was correct.
The strength of this study is that a matching approach for data across years was used to eliminate the differences of region, age, sex and even height, weight and salt iodine. The large sample size of the Chinese national IDD surveys supports the matching approach used in this study, which is the other strength of this study. Whereas, our study has two limitations. First, only children aged 8–10 years were analysed in this study; other age groups are expected in future studies. Second, our study did not provide an exhaustive analysis of TVOL correction methods because the use of H and W for TVOL correction has not been well studied internationally.
In conclusion, the development of height and weight in children is evidence of improved nutrition and also indicates a long-term increase in TVOL with growth and development. The decreased TVOL caused by iodised salt measures (including iodised salt content, CRIS and CRQIS) conceals the increase effect of height and weight on TVOL. Among the factors influencing TVOL, age, weight and salt iodine had the most significant effects. A reference standard based on height and weight is needed to prevent error diagnosed by the current standard from identifying children of the same age who are taller or heavier as children with goitre.
Acknowledgements
We thank the participants of this study. We also thank the provincial Centres for Disease Control and Prevention and the Centres for Endemic Disease Control in thirty-one provinces and Xinjiang construction corps.
This research was supported by the National natural science foundation, NSFC81337730.
L. L. and P. L. conceived and designed the study. L. L., F. M., X. L., M. L. and Y. D. did the statistical analysis. L. L., P. L. and L. F. drafted the manuscript. All authors revised the report and approved the final version before submission.
No competing financial interests exist.