


Iodine-deficiency disorders (IDD) constitute the single most important cause of preventable brain damage worldwide( 1 ). Globally an estimated 1·8 billion people are at risk of IDD due to insufficient iodine intake( Reference Andersson, Karumbunathan and Zimmermann 2 ). In India about 350 million people are at risk of IDD and 303 districts out of 365 districts surveyed were reported to be IDD endemic (total goitre rate greater than 10 %)( 3 ). Universal salt iodization (USI) is globally accepted as the primary strategy to control IDD and was endorsed by WHO/UNICEF/International Council for the Control of Iodine Deficiency Disorders (ICCIDD) in 1992( 4 ). In India, 71 % of households consume adequately iodized salt (≥15 ppm) and another 20 % of households consume salt with some iodine (>0 but <15 ppm)( 5 ).
Quality (in terms of the level of iodization) of iodized salt at the production end is one of the critical areas to ensure success of USI. Monitoring of salt iodization at production level is the most efficient method for ensuring USI. An inadequate monitoring system has been the major cause of failure of IDD control programmes in the past( Reference Mannar and Dunn 6 ). Especially critical is the need to improve salt iodization at small-scale salt-producing facilities( Reference Haxton and Mannar 7 , Reference Sankar and Pandav 8 ).
Small-scale salt producers constitute nearly 30 % of the total salt production in India( 9 ). There is a need to engage small-scale salt producers to promote adequate salt iodization in the country and achieve USI. However, due to a combination of various factors including logistical constraints, limited access to technical know-how and financial constraints, small-scale salt producers are more likely not to iodize or suboptimally iodize their products. For the same reasons, they are also not likely to have a laboratory facility to monitor the iodine content of their salt.
Iodine-monitoring laboratories are essential to ensure adequate iodization( 10 ). To standardize and establish a coordinated system of laboratories, quality assurance (QA) and quality control (QC) protocols are required( 10 ). Establishing a QA system in these laboratories which supports monitoring of salt iodization in small-scale salt producers presents its own unique set of challenges. In the current paper we present our experience of implementing a laboratory iodization QA system in laboratories monitoring salt iodization in small-scale salt production facilities in India.
QA is a proactive and continuous process of monitoring a system for reproducibility and reliability, by setting standards of performance and designating responsibility, ensuring definitive corrective actions are taken when the criteria not met, and performing measurements within a stated level of confidence( 11 ). A QA system needs to have an inventory agency responsible for coordinating QA/QC activities; a QA/QC plan; general QC procedures; defined functions of the participants; and reporting, documentation and archiving procedures.
Materials and methods
Study setting
The small-scale sector (salt production area less than 4 ha (10 acres)) accounts for nearly 30 % of the total salt production in India( 9 ).
Study subjects
Three hundred small-scale salt producers in the states of Andhra Pradesh, Gujarat, Rajasthan, Tamil Nadu, Odisha and Karnataka were enrolled in the programme to receive support for monitoring salt iodization level. Seventeen ‘field laboratories’ were established by the Micronutrient Initiative to monitor the iodine content of salt produced by small-scale salt producers.
Study period
The study was conducted from April 2008 to March 2012.
Methodology
The QA protocol involves two mechanisms: internal quality assurance (IQA) and external quality assurance (EQA). A flowchart outlining the IQA and EQA protocols is presented in Fig. 1. IQA comprises steps taken by the implementing/participating laboratory (field laboratory) to ensure that the process/system it uses to estimate salt iodine content is consistent and operates within a specified level of confidence. EQA consists of steps taken by an external ‘reference laboratory’ to ensure that the process/system used by the implementing laboratory is consistent and operates within a specified level of confidence. The detailed steps involved in IQA and EQA are outlined in Box 1.
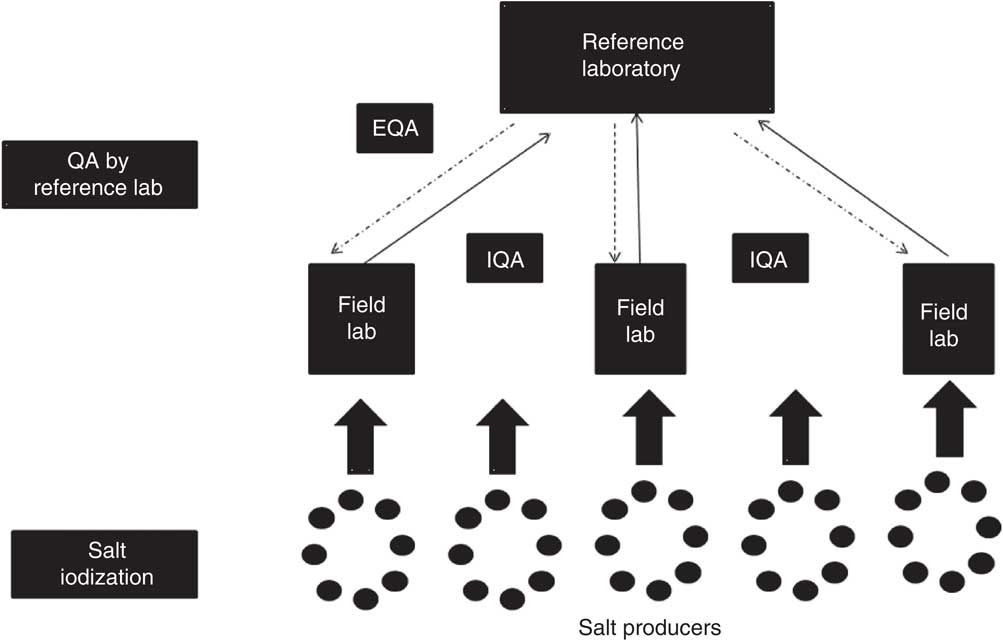
Fig. 1 Flowchart depicting quality assurance (QA) between field laboratories and the reference laboratory in reporting of salt iodine content (IQA, internal quality assurance; EQA, external quality assurance)
Box 1 Quality assurance process
Steps in internal quality assurance (IQA)
1. Preparation of known-value samples.
2. Analysis of known-value sample with every batch of salt to be tested.
3. Plotting Levy–Jenning (LJ) plot.
4. Monitoring and feedback based on results of LJ plot.
5. Fixed number of samples to be collected randomly on different days and analysed in duplicate.
6. Salt samples along with the results to be sent to the reference laboratory each month (at least 50 g for each sample).
7. Reference laboratory will analyse these salt samples in duplicate and then compare the results with the values obtained by the laboratory which sent the samples.
Steps in external quality assurance (EQA)
1. Reference laboratory will analyse six salt samples (different brands) purchased from the market, six times each.
2. Find the mean and the standard deviation for each salt sample.
3. Reference laboratory will send 50 g of each salt sample to the field laboratory each month.
4. Field laboratory will analyse these salt samples in duplicate and send the results to the reference laboratory.
5. Reference laboratory then will compile the results, compare the values and advise any remedial measures.
As part of the QA programme, seventeen ‘field laboratories’ were set up across all major salt-processing areas in the salt-producing states of Andhra Pradesh, Gujarat, Rajasthan, Tamil Nadu, Odisha and Karnataka. Five laboratories were established in each of Andhra Pradesh and Odisha, Gujarat, and Tamil Nadu and Karnataka, and two laboratories were established in Rajasthan. Each field laboratory had a trained chemist and salt extenders. The salt extenders were responsible for collecting salt samples from the small-scale salt production facilities as per a standardized protocol. Each salt production facility was visited at an interval of 2–3 d and composite salt samples were collected prior to packaging of salt. It was ensured that a minimum of ten salt samples were collected from each salt production facility each month. The iodine content of collected salt samples was assessed by the field laboratory chemist by iodometric titration. The results on iodine content were shared with the respective salt producers through telephone calls or mobile phone text messages for faster communication; results were later sent by post or delivered by hand. The field laboratories were supervised by three Program Units located in Gandhidham, Nawa and Tuticorin. The ICCIDD laboratory in New Delhi was designated as the ‘reference laboratory’ for the QA programme. A rigorous, blinded, monthly salt sample exchange system was established between field laboratories and the reference laboratory. Five to ten randomly selected samples were sent from each field laboratory to the reference laboratory every month. The exchange of results on iodine content between field and reference laboratories was done through email and post every month.
Laboratory analysis
Salt iodometric titration was carried out as per the standard guidelines to estimate iodine content of salt( 1 ). Sulfuric acid (1·0 m) and potassium iodide (1 ml of a 10 % w/v solution) were added to the salt solution (10 g salt in 50 ml water), which was titrated against sodium thiosulfate (0·005 m). All salt samples were analysed in duplicate as part of the IQA protocol (except for the year 2008–09, when each sample was analysed only once). In the EQA protocol, the reference laboratory tested each sample six times, while field laboratories tested each sample in duplicate. An extensive 3–5 d training of all laboratory personnel involved in the project was conducted at the start of the project by resource persons from the reference laboratory. Periodic refresher trainings were also held to ensure greater standardization of the laboratory methods being followed. In addition, a detailed manual incorporating guidelines and steps for both laboratory and QA protocols was developed and shared with the study participants.
Statistical analysis
Data were entered into a Microsoft® Excel spreadsheet and analysed using the statistical software package SPSS for Windows version 16. ‘Within-laboratory’ (between results of salt sample analysis carried out in duplicate in the same laboratory) and ‘between-laboratory’ (between results of the reference laboratory and field laboratories) agreement of iodine content of salt samples was assessed. A cut-off value of 3 ppm was used to assess the within-laboratory and between-laboratory percentage agreement for the IQA and EQA protocols. The 3 ppm value corresponds to 10 % of 30 ppm (the prescribed production-level iodine content of salt in India) and was considered an acceptable cut-off value for both within- and between-laboratory comparisons( 11 ). For EQA, the percentage agreement between field laboratories and the reference laboratory was also assessed using a cut-off of 2 sd. Kappa statistics were used to assess the agreement within and between laboratories with salt iodine content categorized as a dichotomous variable, adequate (≥30 ppm) and inadequate (<30 ppm). A Bland–Altman plot was constructed to assess the agreement between laboratories with iodine content of salt as a continuous variable. The Wilcoxon rank-sum test was used to assess the significance of the difference in median salt iodine content between the reference and field laboratories. The χ 2 test was used to assess the level of significance for percentage agreement between field laboratories and the reference laboratory for the IQA and EQA protocols. When the overall difference was significant, the χ 2 test was used to assess the year-wise significance of difference and Bonferroni correction was used to adjust the P values for multiple comparisons.
Results
Internal quality assurance
The IQA programme was started in March 2008. A total of 6573 salt samples were exchanged as part of IQA over the study period. A total of 578 samples were exchanged from April 2008 to March 2009, 2411 samples were exchanged from April 2009 to March 2010, 1928 samples were from April 2010 to March 2011 and 1656 samples were exchanged from April 2011 to March 2012. Out of the total salt sample exchanges, 527 were from Andhra Pradesh and Odisha, 2343 from Gujarat, 2016 from Rajasthan and 1677 from Tamil Nadu and Karnataka. Out of 6573 samples analysed by the reference laboratory for IQA, 20·3 % of the salt samples had iodine content of less than 15 ppm, 40·4 % of salt samples had iodine content between 15 ppm and 30 ppm, and 39·3 % had iodine content of more than 30 ppm. The median iodine content of salt samples analysed for IQA by the reference laboratory was 23·8 ppm (interquartile range (IQR) 15·3–33·3 ppm).
The median iodine content in the salt samples as assessed by the field laboratories was 24·0 ppm (IQR 16·2–33·0 ppm). The difference in the median value of iodine content by field laboratories and the reference laboratory was not statistically significant (P = 0·634). A Levy–Jenning plot was plotted as part of the IQA protocol. Frequency of out-of-range values in both reference and field laboratories was less than 1 %. Overall within-laboratory percentage agreement (using cut-off value of less than 3 ppm) for field laboratories was 92·8 %; 92·7 % for the period 2009–10, 93·0 % for the period 2010–11 and 92·9 % for the period 2011–12 (P = 0·899). Overall within-laboratory percentage agreement (using cut-off value of less than 3 ppm) for the reference laboratory was 99·4 %; 98·8 % for the period 2009–10, 99·8 % for the period 2010–11 and 99·8 % for the period 2011–12 (P = 0·921). Within-laboratory agreement for the period 2008–09 could not be assessed as all salt samples were analysed only once (not done in duplicate) during that year.
Overall between-laboratory percentage agreement (using cut-off value of less than 3 ppm) for field laboratories and the reference laboratory was 61·6 %; 36·9 % for the period 2008–09, 63·1 % for the period 2009–10, 63·6 % for the period 2010–11 and 65·4 % for the period 2011–12 (P ≤ 0·001). There was a significant difference in the between-laboratory agreement for the time periods 2008–09 and 2009–10 (P < 0·001). However, the difference between the time periods 2009–10 and 2010–11 (P = 0·13) and between 2010–11 and 2011–12 (P = 0·18) was not significant.
The overall between-laboratory percentage agreement (by categorizing iodine content of salt samples as <30 ppm and ≥30 ppm) for field laboratories and the reference laboratory was 87·6 %; 79·9 % for the period 2008–09, 87·5 % for the period 2009–10, 84·6 % for the period 2010–11 and 92·5 % for the period 2011–12 (P < 0·001; Table 1). There was a significant difference in the between-laboratory agreement for the time periods 2008–09 and 2009–10 (P < 0·001), 2009–10 and 2010–11 (P = 0·008) and 2010–11 and 2011–12 (P < 0·001). The overall κ statistic (by categorizing iodine content of salt samples as <30 ppm and ≥30 ppm) for agreement between the field laboratories and reference laboratory was 0·720 (se 0·009); 0·598 (se 0·033) for the period 2008–09, 0·689 (se 0·017) for the period 2009–10, 0·637 (se 0·021) for the period 2010–11 and 0·839 (se 0·013) for the period 2011–12. The Bland–Altman plot for agreement between field laboratories and the reference laboratory is presented in Fig. 2. The mean difference in iodine content estimation by the field laboratories and reference laboratory was 0·3 ppm (95 % limit of agreement −15·9, 16·5 ppm).
Table 1 Agreement between field laboratories and the reference laboratory for the internal quality assurance protocol in reporting of salt iodine content (in ppm) in samples from small-scale salt producers (n 300) in the states of Andhra Pradesh, Gujarat, Rajasthan, Tamil Nadu, Odisha and Karnataka, India

n, number of salt samples.
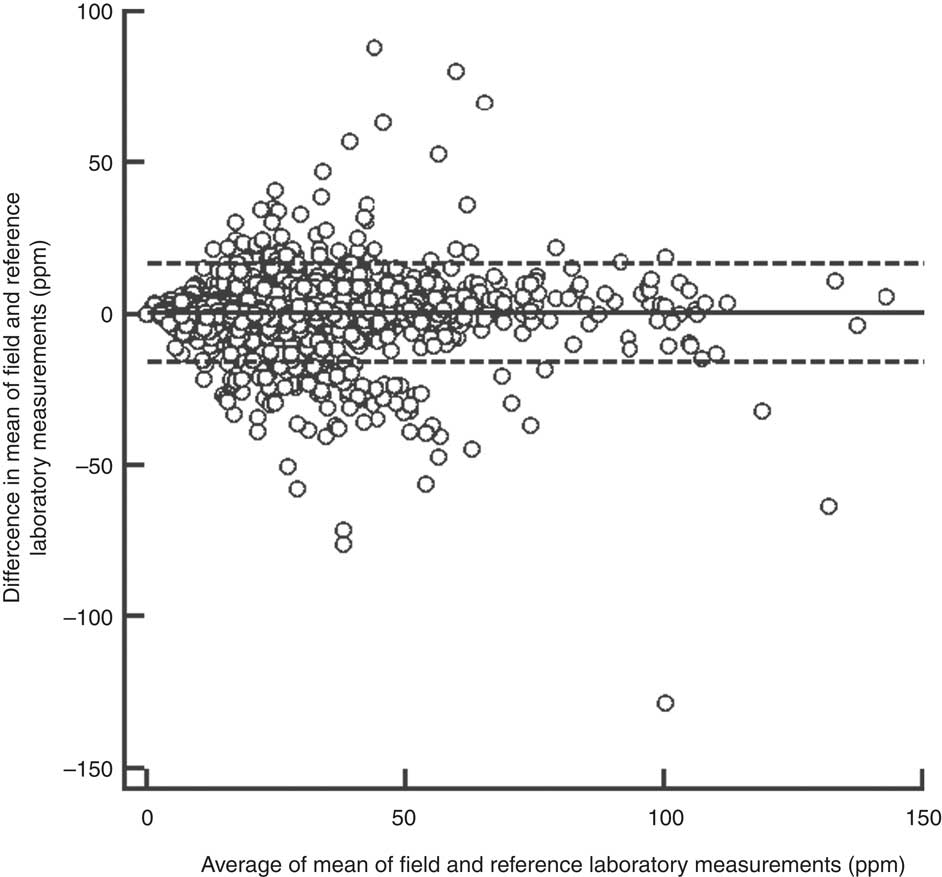
Fig. 2 Bland–Altman plot of agreement between field and reference laboratory measurements for internal quality assurance in reporting of salt iodine content (in ppm) in samples from small-scale salt producers (n 300) in the states of Andhra Pradesh, Gujarat, Rajasthan, Tamil Nadu, Odisha and Karnataka, India (———, mean difference; – – – – –, 95 % limits of agreement)
External quality assurance
The EQA programme was introduced in the year 2009–10, i.e. in the second year of the QA programme. A total of 347 samples were exchanged between the field laboratories and the reference laboratory as part of the EQA programme. Of the total 347 samples analysed for EQA by the reference laboratory, 0·9 % of the salt samples had iodine content of less than 15 ppm, 15·0 % had iodine content between 15 ppm and 30 ppm, and 84·1 % had iodine content of more than 30 ppm. The median iodine content of EQA salt samples assessed by the reference laboratory was 36·5 ppm (IQR 31·0–42·5 ppm).
The median iodine content in the EQA salt samples assessed by field laboratories was 36·5 ppm (IQR 31·2–43·4 ppm). The difference between the results by the reference and field laboratories was not significant (P = 0·575). The overall within-laboratory percentage agreement (using cut-off value of less than 3 ppm) for field laboratories was 88·5 %; 81·5 % in 2009–10, 83·3 % in 2010–11 and 96·6 % in 2011–12 (P < 0·001). The within-laboratory percentage agreement for field laboratories was significantly different only between the periods 2010–11 and 2011–12 (P < 0·001) and not for the periods the 2009–10 and 2010–11 (P = 0·734). Overall between-laboratory percentage agreement (using cut-off value of less than 3 ppm) for field laboratories and the reference laboratory was 64·8 %; 51·9 % in 2009–10, 65·6 % in 2010–11 and 73·8 % in 2011–12 (P = 0·001). The between-laboratory percentage agreement was significantly different for the periods 2009–10 and 2010–11 (P = 0·050). However, the difference was not significant for the periods 2010–11 and 2011–12 (P = 0·173).
When 2 sd was used as the cut-off value for agreement, the between-laboratory percentage agreement for field laboratories and the reference laboratory was 31·0 %; 27·7 % for the period 2009–10, 12·2 % for the period 2010–11 and 45·0 % for the period 2011–12 (P < 0·001). There was a significant decline in between-laboratory agreement from the period 2009–10 to 2010–11 (P = 0·007). However, the agreement improved significantly from the period 2010–11 to 2011–12 (P < 0·001). However, when 3 sd was taken as cut-off, the between-laboratory agreement for field laboratories and the reference laboratory was 53·6 %; 40·7 % for the period 2009–10, 63·3 % for the period 2010–11 and 57·0 % for the period 2011–12 (P = 0·003). The difference between 2009–10 and 2010–11 was statistically significant (P = 0·002), while the difference between the periods 2010–11 and 2011–12 was not significant (P = 0·338). The difference in agreement by taking 2 sd and 3 sd as cut-off could be because of marginal error in results by field laboratories, keeping in view low variance in results by the reference laboratory. When the iodine content of salt was categorized as a dichotomous variable (<30 ppm and ≥30 ppm), overall between-laboratory percentage agreement was 95·7 % (Table 2); 87·9 % for the period 2009–10, 94·4 % for the period 2010–11 and 89·2 % for the period 2011–12 (P = 0·200). Overall κ statistic (by categorizing the iodine content of salt samples as <30 ppm and ≥30 ppm) for the EQA programme was 0·678 (se 0·05); 0·485 (se 0·122) for the period 2009–10, 0·272 (se 0·217) for the period 2010–11 and 0·707 (se 0·068) for the period 2011–12. The Bland–Altman plot for between-laboratory agreement for field laboratories and the reference laboratory is presented in Fig. 3. The mean difference in iodine content estimation for EQA samples by field laboratories and the reference laboratory was −0·3 ppm (95 % limit of agreement −7·3, 6·7 ppm).
Table 2 Agreement between field laboratories and the reference laboratory for the external quality assurance protocol in reporting of salt iodine content (in ppm) in samples from small-scale salt producers (n 300) in the states of Andhra Pradesh, Gujarat, Rajasthan, Tamil Nadu, Odisha and Karnataka, India
n, number of salt samples.
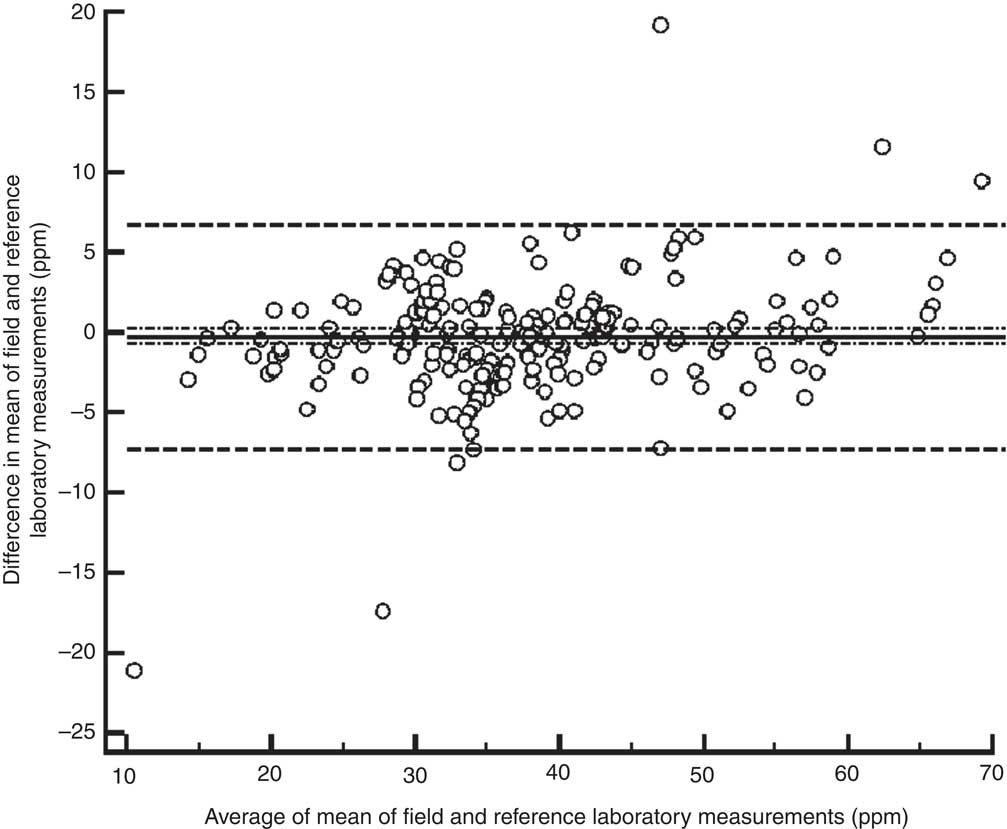
Fig. 3 Bland–Altman plot of agreement between field and reference laboratory measurements for external quality assurance in reporting of salt iodine content (in ppm) in samples from small-scale salt producers (n 300) in the states of Andhra Pradesh, Gujarat, Rajasthan, Tamil Nadu, Odisha and Karnataka, India (———, mean difference; – – – – –, 95 % limits of agreement; – · – · –, 95 % confidence interval of the mean difference)
Refresher training for laboratory personnel of field laboratories
A resource person from the reference laboratory conducted three on-site refresher trainings for the laboratory personnel of the field laboratories every year during the study duration. The trainings, held in three batches, were attended by the laboratory personnel of all seventeen field laboratories. Refresher trainings involved hands-on training on the laboratory procedure for iodometric titration and detailed discussions on QA protocols. Queries raised by the laboratory personnel pertaining to laboratory procedures and the QA protocol were addressed during the trainings. The annual analysis and results of the QA programme were shared and discussed during the training. In addition to the on-site refresher trainings, a centralized training was organized in the year 2010 in New Delhi at the reference laboratory.
Discussion
The present study successfully demonstrates establishment of a QA system in laboratories supporting monitoring of salt iodization in small-scale salt producers in India. Over the 4-year duration of the study, a satisfactory level of performance of laboratory QA in laboratories supporting monitoring of salt iodization in small-scale salt-producing facilities was attained. The difference between median salt iodine contents by reference and field laboratories was statistically non-significant for both IQA and EQA protocols. Overall within-laboratory agreement for the IQA programme was 92·8 % (field laboratories) and between-laboratory agreement was 61·6 %. In the EQA programme, 64·8 % of the samples analysed by the field laboratories were within the acceptable range (within 3 ppm) as compared with the reference laboratory. There was significant improvement in the performance of field laboratories from the period 2008–09 to 2011–12. However, there is scope for further improvement of the performance of field laboratories.
At global level, the USI programme is in the proverbial ‘home stretch’ with the goal of greater than 90 % of household-level coverage being within reach. Strengthening of the monitoring and evaluation of salt iodization with appropriate laboratory support is critical to the success of USI. QA of laboratory procedures for monitoring of the USI programme is essential to ensure sustainable elimination of IDD at global level. The laboratory QA protocol is even more critical for small-scale salt producers who, because of logistical constraints, use primitive methods of iodization which are more susceptible to errors.
The huge amount of data generated by our study served as a complementary system to the existing government monitoring system in India. The Salt Commissioner of India monitors product-end salt iodization with help of an extensive laboratory network( 12 ). However, the government system is more focused on large- and medium-scale producers and the salt transported by railways. The small-scale salt producers who primarily transport their salt by road are not optimally covered by the government monitoring system. By focusing on these small-scale producers the current project addressed the critical gaps in the system.
The partnership between non-governmental organizations and small-scale salt producers to maintain QA is a successful example of collaboration to achieve USI. The project helped private salt producers in capacity building for laboratory procedures and ensuring attainment of an adequate level of iodine in the salt produced. The current model has immense potential for being replicated in similar settings in different countries across globe.
At global level, with renewed focus on the quality of iodized salt and the importance of laboratory QA in the promotion of USI, several large projects addressing QA have been launched in recent years. The Global Alliance for Improved Nutrition (GAIN) in partnership with Intertrek and ICCIDD has recently undertaken a QA project in thirteen countries across the globe( 13 ). The main focus of the GAIN–Intertrek–ICCIDD project is to establish QA protocols at both salt production facilities and laboratories of government regulators in each of the thirteen high-priority countries.
The establishment of QA protocols in laboratories supporting small-scale salt production facilities has its own unique set of challenges. In India, most of the small-scale producers do not have a laboratory or full-time laboratory personnel, and four or five facilities share a laboratory facility and engage one qualified laboratory person on a shared basis. In the absence of any mandatory requirements for QA protocols, QA is perceived as an additional burden by the laboratory personnel. However, the unique model developed by us, where field laboratories were established by a non-governmental organization and technical expertise for the QA system provided by another non-governmental organization, helped in resource pooling and greater ‘buy-in’ by the private small-scale salt producers.
Although we have managed to achieve a satisfactory level of performance of the QA system in laboratories supporting small-scale salt production facilities, still there is considerable scope for improvement. The QA programme has to evolve towards a stage where it is fully owned and managed by the small-scale producers without any external logistics or technical support. Continuous reinforcement of the importance of QA in laboratories needs to be provided to the small-scale salt producers. Also, a mechanism needs to be explored to ensure greater and effective coverage of small-scale salt production facilities by the laboratory monitoring network of the Salt Commissioner's Office.
Conclusion
Laboratory QA is essential to attain the goal of USI both at national and global levels. Our study successfully documents implementation of a laboratory iodization QA protocol in laboratories established to support small-scale salt production facilities in India.
Acknowledgements
Sources of funding: This work was carried out with the aid of a grant from the Micronutrient Initiative, Ottawa, Canada through the financial assistance of the Government of Canada via the Canadian International Development Agency (CIDA). The Micronutrient Initiative and CIDA had no role in the design, analysis or writing of this article. Conflicts of interest: None to declare. Ethical approval: Not required. Authors’ contributions: K.Y., R.K., C.S.P. and M.G.K. all contributed to conception of the study, preparation of the protocol, data analysis, and preparation and approval of the manuscript. Acknowledgements: The authors wish to acknowledge the help of Ms Melanie Galvin, Mr Mathew Joseph, and the entire salt iodization programme team, especially all the chemists and senior chemists located at various field laboratories of the Micronutrient Initiative India, in implementation of the QA protocol as well as in the conduct of the study.


