Obesity, as a serious risk factor for non-communicable diseases, is the fifth leading cause of death worldwide(1), with statistics dramatically increasing globally(Reference Gill2), emphasising the urgency in the development of strategies for obesity prevention in recent years(Reference Aranceta, Moreno and Moya3).
In order to develop an appropriate strategy to prevent obesity, factors contributing to obesity should be first considered. It is well recognised that both genetic and environmental factors contribute to the development of obesity(Reference Ghalandari, Hosseini-Esfahani and Mirmiran4). Changes in lifestyle factors such as improving dietary patterns are key elements of obesity prevention policies; however, the success of their implementation may be affected by genetic susceptibility(Reference Smemo, Tena and Kim5, Reference Corella, Ortega-Azorin and Sorli6). Therefore, understanding the interactions between genetic background and nutritional factors could be helpful in developing a cost-effective strategy for the prevention of obesity.
Polymorphisms of the fat mass and obesity-associated (FTO) gene, as the strongest genetic determinant of obesity, increase appetite and consequently increase the risk of obesity (1⋅67 fold)(Reference Hardy, Wills and Wong7). Interactions between polymorphisms of the FTO gene and nutrient intake in relation to obesity have only been examined in few studies(Reference Labayen, Ruiz and Huybrechts8, Reference Moleres, Ochoa and Rendo-Urteaga9), none of which specifically examined the modulatory effect of dietary patterns on the associations of the FTO risk alleles with obesity. Single foods or nutrients cannot predict obesity development, while dietary patterns are significantly related to obesity over time(Reference Nicklas, Baranowski and Cullen10, Reference Togo, Osler and Sorensen11), so the measurement of dietary patterns has been recommended to investigate the links between dietary factors and obesity. The aim of the current study was to evaluate whether the relationship between different dietary patterns and changes in BMI and waist circumference (WC) differed according to FTO genotypes of adult individuals. Identifying these environmental interactions is essential for implementing appropriate preventive approaches in individuals with greater genetic susceptibility to obesity.
Materials and Methods
Subjects
Subjects of this cohort study were selected from among Tehran Lipid and Glucose Study participants(Reference Azizi, Rahmani and Emami12, Reference Azizi, Ghanbarian and Momenan13), a population-based prospective study performed to determine risk factors for non-communicable diseases in a sample of residents of District 13 of Tehran, the capital of Iran. The first examination survey was performed from 1999 to 2001 on 15 005 individuals, aged ≥3 years, and follow-up examinations were conducted every 3 years (2002–2005; 2005–2008; 2008–2011 and 2011–2014) to identify recently developed diseases.
For the present study, of 12 823 participants who entered in the fourth survey (2008–2011), 7812 were randomly selected for dietary assessment based on age and sex; of these, 6874 adult participants aged ≥18 years were included and followed. Subjects who did not complete anthropometric data at baseline and follow-up survey (n 920), were without DNA sample or lacking DNA purification (n 1182), were without accurate report of energy intake (whose reported energy intake divided by the predicted energy intake did not meet the ±3 sd range), were pregnant or breast-feeding women and those taking drugs that affect weight were excluded (n 480). Finally, 4292 individuals, with a mean 3⋅6 years of follow-up, remained in the study.
Measurements
Usual dietary intake was assessed using a valid and reliable 168-item semi-quantitative FFQ(Reference Esfahani, Asghari and Mirmiran14, Reference Mirmiran, Esfahani and Mehrabi15), which comprised a list of foods with standard serving sizes; the portion sizes were converted to g/d using household measures. Based on the nutrient composition of food items and available literature, eighteen food groups were classified. Since the Iranian food composition table (FCT) is incomplete(Reference Azar and Sarkisian16), the United States Department of Agriculture FCT was used to analyse foods(17). However for some national foods and beverages which were not listed in the United States Department of Agriculture FCT, the Iranian FCT was used.
Body weight was measured to the nearest 100 g using digital scales (model 707; Seca). Height was measured to the nearest 0⋅5 cm using stadiometer (model 208 Portable Body Meter Measuring Device; Seca). WC was measured and recorded to the nearest 0⋅1 cm using a non-stretch tape measure. BMI (kg/m2) and WC (cm) change were calculated by subtracting the BMI and WC at baseline from their measurements at follow-up; increases in BMI and WC were defined if BMI or WC change was positive or >0.
The physical activity level was assessed with high reliability and relatively moderate validity using the Persian translated modifiable activity questionnaire(Reference Momenan, Delshad and Sarbazi18). Frequency and time spent on light, moderate, hard and very hard intensity activities, according to the list of common activities of daily life over the past year, were obtained, and these activity data were converted into metabolic equivalent/hours/week.
Genotyping
Six SNP were selected (rs1421085, rs1121980, rs17817449, rs8050136, rs9939973 and rs3751812) within the region of the FTO gene, based on the literature available and on the validated catalogue of published genome-wide association studies and the Phenotype-Genotype Integrator(19, 20), taking into account minor allele frequency >0⋅2 and P values <10−7. The selected SNP were associated with dietary intake or obesity phenotypes(Reference Lee, Kim and Kang21–Reference Wing, Ziegler and Langefeld26). Genomic DNA was extracted from peripheral blood(Reference Miller, Dykes and Polesky27). Portions of DNA samples were genotyped with HumanOmniExpress-24-v1-0 bead chips, containing 649 932 SNP loci, with an average mean distance of 4 kb at the deCODE genetics company (Reykjavik, Iceland) according the manufacturer’s specifications (Illumina Inc.). For quality control procedures, PLINK programme (v. 1.07) and R statistic (v. 3.2) were used with the total genotyping rate of 0⋅9774. After quality control procedures, the genotyping data of FTO polymorphisms were used for data analysis(Reference Daneshpour, Fallah and Sedaghati-Khayat28).
Obesity genetic risk score calculation
Genetic risk score (GRS) was calculated based on the six SNP using the weighted method(Reference Qi, Chu and Kang29, Reference Qi, Chu and Kang30). Each SNP was reported as 0, 1 or 2 based on the number of risk alleles (BMI-increasing alleles)(19, 20), and each SNP was weighted by its relative effect size (OR), derived from previously reported meta-analyses or original data (Table 1)(Reference Lee, Kim and Kang21, Reference Peng, Zhu and Xu24, Reference Alharbi, Richardson and Khan31). We then calculated the GRS using the following equation:
Table 1. Genotype information of fat mass and obesity-associated (FTO) polymorphisms among the population of the Tehran Lipid and Glucose StudyFootnote *
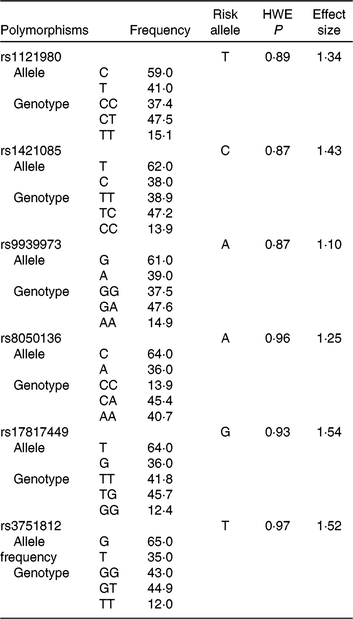
HWE, Hardy–Weinberg equilibrium.
* Risk alleles were based on data from the GWAS Catalog (the NHGRI-EBI Catalog of published genome-wide association studies(19)) and the Phenotype-Genotype Integrator. Effect sizes were derived from previous literature and reported meta-analyses.
OR is the OR of each individual SNP on BMI, n is 6 and sum of the OR is 8⋅18 in the current analysis. The GRS ranged from 0 to 12, and each point of the GRS conformed to each single risk allele.
Statistical analysis
Statistical analyses were carried out using the Statistical Package for Social Sciences (version 21.0). A P value <0⋅05 was used to determine statistical significance. The descriptive analysis consisted of a comparison of qualitative and quantitative variables across quartiles of dietary pattern scores using the chi square and ANOVA test, respectively; genotype and allele frequencies for the analysed polymorphisms were calculated. Pearson’s χ 2 statistic test was used to calculate the Hardy–Weinberg equilibrium.
Dietary patterns were determined using principal component analysis with varimax rotation based on eighteen energy-adjusted food groups (g/d). Two factors were maintained based on the interpretability of the factors and the scree plot. Factor loadings below ±0⋅2 are not reported because of the low contribution of their food groups explained by the factor and for the easy explanation of these dietary patterns. Factor scores of each subject were computed by the sum of multiplying the consumption of food groups by their factor loadings on each pattern. Each subject with a higher score on a particular factor had a higher comparative adherence to this pattern compared with others. Participants were separated into two groups based on the median GRS (≥median and <median).
To test the interaction between dietary patterns and FTO gene variants or their GRS in relation to changes in BMI and WC, general linear models, including the corresponding main effects and interaction terms, were used. Subjects were divided into eight groups based on their combined role of quartiles of dietary patterns and dominant model of FTO SNP genotypes or ≥median and <median GRS in estimating mean and standard error changes of BMI and WC. Models were adjusted for sex, age, education levels (>14 and ≤14 years), smoking (never smoked, ex-smoker and current smoker), baseline physical activity (light, moderate, high), BMI and energy intake. The P value for trend across the quartiles of dietary patterns was determined using logistic regression, with the median of each quartile of dietary patterns as a continuous variable.
Results
Genotype information of study participants
Mean ages of 4608 participants (56⋅8 % women) were 42⋅6 (sd 14) and 40⋅4 (sd 13) years in men and women, respectively. Frequency of genotypes or alleles, the effect size and risk allele of each SNP for obesity traits are shown in Table 1. Genotype frequencies did not deviate from Hardy–Weinberg equilibrium.
Identified dietary patterns
Two major dietary patterns were identified; the healthy dietary pattern included high levels of vegetables, fruits and fruit juices, fish and poultry, legumes, nuts and seeds, low-fat dairy products, whole grains and liquid oil, whereas the Western dietary pattern included high intake of soft drinks, fast foods, sweets and sugar, solid oil, red meat, organ meat, salty snacks, refined grains and high-fat dairy products (Table 2).
Table 2. Factor loadings for the two dietary patterns identified in study participants
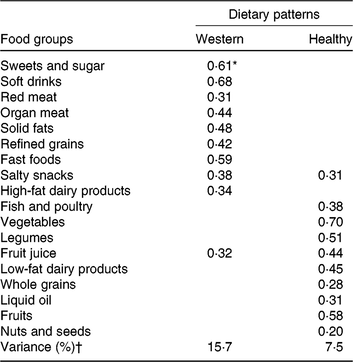
* Values are factor loadings of dietary patterns measured by factor analysis. Factor loadings below ±0⋅2 are not shown in the table for simplicity.
† Eigenvalues >1, Kaiser–Meyer–Olkin (KMO): 0⋅77.
Characteristics of participants based on dietary pattern scores
Table 3 shows baseline general characteristics and dietary intake of participants across dietary pattern scores. Individuals with higher adherence to the Western dietary pattern were younger, while with increasing adherence to the healthy dietary pattern, the age of participants significantly increased.
Table 3. Characteristics of the study population according to dietary pattern scores among adult participants of the Tehran Lipid and Glucose Study (n 4292) (Mean values and standard deviations; percentages)
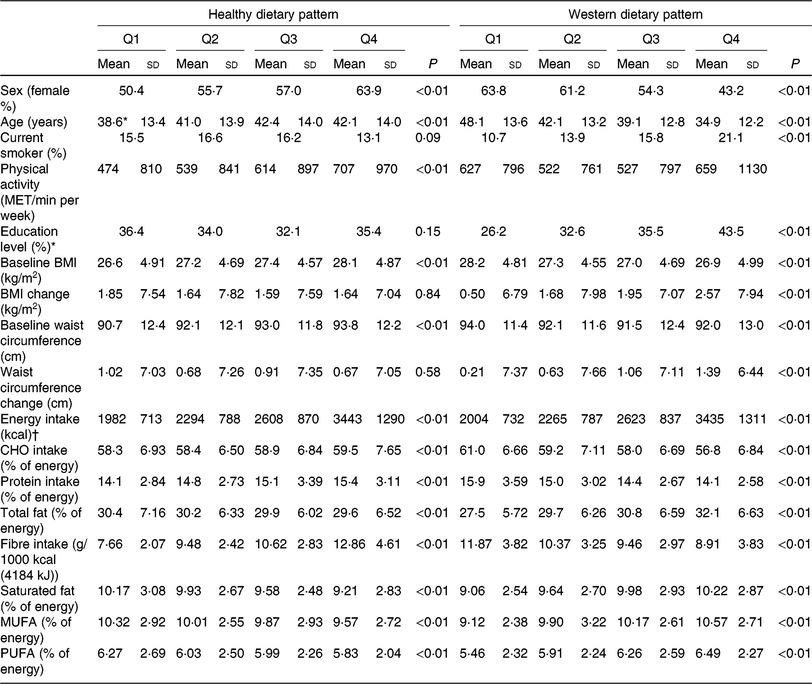
Q, quartiles of dietary pattern scores, MET, metabolic equivalent, CHO, carbohydrate.
* Educational level ≥14 years.
† To convert energy in kcal to kJ, multiply by 4⋅184.
Subjects with higher score of the Western dietary pattern were more likely to be men and current smokers and have an education level ≥14 years, compared with subjects with higher score of the healthy dietary pattern who were more likely to be women and were more physically active. Individuals with higher adherence to the Western dietary pattern had lower BMI and WC at baseline, compared with participants with lower adherence. Higher adherence to the Western dietary pattern was associated with greater increments in BMI and WC after follow-up years, which is in contrary to subjects with higher adherence to the healthy dietary patterns.
Energy intake was higher in the highest quartile of both dietary pattern scores. There were significantly higher percentages of energy from all kinds of fats in higher categories of the Western dietary pattern. In addition, the percentage of energy from carbohydrate and fibre intake dropped significantly moving from the first to the last category of the Western dietary pattern. Fibre, carbohydrate and protein intake increased across quartiles of the healthy dietary pattern. The percentage of energy from all kinds of fats decreased in higher categories of the healthy dietary pattern.
Changes in BMI according to quartiles of dietary pattern scores by fat mass and obesity-associated genotypes and genetic risk score
Changes in BMI according to quartiles of dietary pattern scores by FTO genotypes are shown in Table 4. The interaction term did not reach statistical significance between FTO polymorphisms or their GRS and the healthy dietary pattern score in relation to BMI change. However, bigger changes (approximately2fold increase) in BMI were observed for risk allele carriers of rs1121980, rs1421085, rs8050136, rs1781799 and rs3751812 with increasing quartiles of the Western dietary pattern (P < 0⋅05). The increase in the Western dietary pattern score was associated with the increase in BMI, an association more noticeable in subjects with high GRS, compared with subjects with low GRS (P interaction = 0⋅01).
Table 4. Changes in BMI (kg/m2) according to quartiles of dietary pattern scores (Q) by fat mass and obesity-associated (FTO) genotypes and genetic risk score (GRS) in adult participants of the Tehran Lipid and Glucose StudyFootnote * (Mean values with their standard errors)
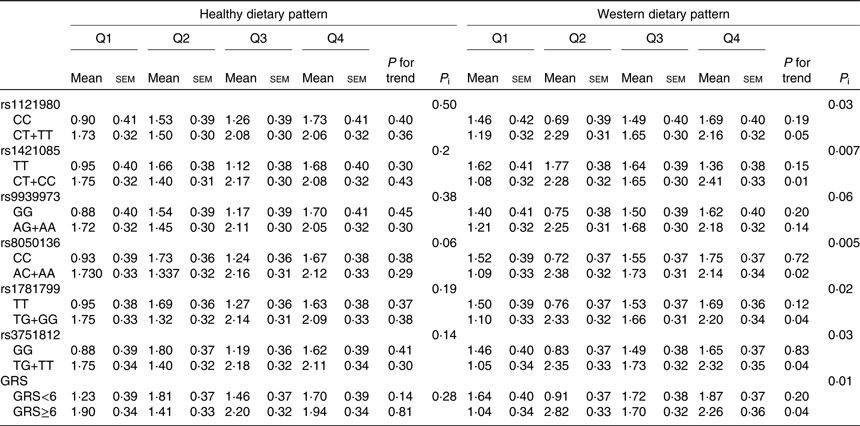
P i, P interaction.
* BMI changes were calculated by subtracting the BMI at baseline from their measurements over a mean of 3-year follow-up; increases in BMI were defined if BMI changes were positive or >0. Participants were jointly classified (eight groups) according to quartiles of dietary pattern scores and dominant model of FTO polymorphism genotypes or GRS ≥median and <median. Models were adjusted for age, sex, baseline BMI, educational level, smoking status, physical activity and energy intake.
Changes in waist circumference according to quartiles of dietary pattern scores by fat mass and obesity-associated genotypes and genetic risk score
Changes in WC according to quartiles of dietary pattern scores by FTO genotypes or their GRS are shown in Table 5. There were statistically significant interaction between rs1421085, rs3751812 and the Western dietary pattern score in relation to WC change (P interaction = 0⋅04).
Table 5. Changes in waist circumference (cm) according to quartiles of dietary pattern scores (Q) by fat mass and obesity-associated (FTO) genotypes and genetic risk score (GRS) in adult participants of the Tehran Lipid and Glucose StudyFootnote * (Mean values with their standard errors)
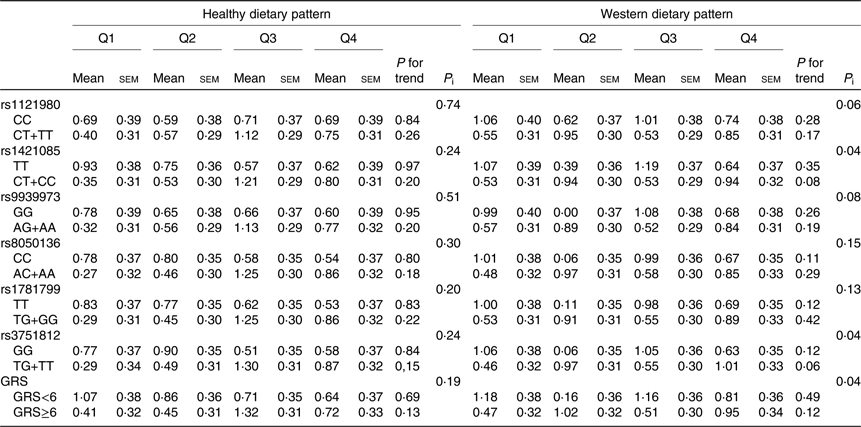
P i, P interaction.
* Waist circumference changes were calculated by subtracting the waist circumference at baseline from their measurements over a mean of 3-year follow-up; increases in waist circumference were defined if their changes were positive or >0. Participants were jointly classified (eight groups) according to quartiles of dietary pattern scores and dominant model of FTO polymorphism genotypes or GRS ≥median and <median. Models were adjusted for age, sex, baseline waist circumference, educational level, smoking status, physical activity and energy intake.
There was a statistically significant interaction between the GRS and Western dietary pattern score in relation to change in WC. WC increased to a greater extent in high GRS group while increasing quartiles of the Western dietary pattern score, compared with the low GRS group (WC change; Q1: 0⋅47 (se 0⋅32) v. Q4: 0⋅95 (se 0⋅34)) (P interaction < 0⋅05). On analysing healthy dietary pattern score, there was no significant interaction with GRS on WC change.
Discussion
Two major dietary patterns were identified in our study, the healthy and the Western. The Western or unhealthy dietary pattern could modify the association of FTO SNP or their GRS with general and abdominal obesity in a prospective cohort study of a Tehranian population. Higher adherence to Western dietary pattern was associated with about 2-fold increase in BMI and WC change among adult subjects having FTO risk alleles. Also the healthy dietary pattern did not have any interaction with FTO SNP singly or in combination in relation to changes in obesity phenotypes.
This is the first study to examine available FTO SNP and posteriori-dietary pattern (extracted through principal component analysis) interaction in relation to changes in obesity phenotypes in a Middle Eastern population. Defining dietary patterns considers the combined effect of food groups and nutrients, which clearly explains details of dietary intake(Reference Hosseini-Esfahani, Djazaieri and Mirmiran32). In the present study sweetened fruit juices and salty snacks were included in the healthy dietary pattern; these findings indicate that our participants had not considered the added sugar and salt content of these foods and they consumed these foods in the same frequency with the healthy foods. This point should be emphasised in nutrition education planning.
Previous studies often focused on the effect of interaction of different dietary macronutrients with FTO polymorphisms in relation to obesity(Reference Corella, Arnett and Tucker33, Reference Lappalainen, Lindstrom and Paananen34). Dietary protein intake attenuated the effect of FTO risk variant rs1558902 in relation to BMI or WC(Reference Merritt, Jamnik and El-Sohemy35); however, a meta-analysis found no interaction between FTO SNP rs9939609 and dietary protein, carbohydrate, fat or energy intake in relation to BMI(Reference Qi, Kilpelainen and Downer36). Higher intake of dietary fibre attenuated the association of FTO SNP with general obesity particularly in subjects with high GRS(Reference Hosseini-Esfahani, Koochakpoor and Daneshpour37). Previous studies showed that some food groups such as sugar-sweetened beverages(Reference Qi, Chu and Kang30) and fried foods(Reference Qi, Chu and Kang29) (top-ranked food groups in the Western dietary pattern) had interaction with FTO genotypes rs9939609 in relation to risk of obesity, results in line with our findings. In the HUNT study, an interaction effect of FTO rs9939609 with artificially sweetened beverages in relation to obesity was found only in men aged 20–60 years, indicating that the interaction term may be affected under some conditions such as age groups and sex(Reference Bjornland, Langaas and Grill38).
Moreover, the GRS of combined SNP is established to describe more variations in BMI and gaining statistical power in comparison with single SNP(Reference Rask-Andersen, Karlsson and Ek39). The linkage disequilibrium between rs9939609 and the three SNP (rs8050136, rs3751812, rs17817449) is high (r 2 1) based on data from South and East Asians(Reference Alharbi, Richardson and Khan31, Reference Li, Kilpelainen and Liu40); therefore the rs9939609 was not entered in GRS calculation and analysis. Also due to limited resources available, the most reproducible associated SNP with obesity and dietary intake were selected.
Unlike our findings, the Wang et al. study described that higher adherence to predefined dietary patterns, including the alternate healthy eating index-2010 and the dietary approach to stop hypertension diet, could decrease the association of genetic predisposition score with weight gain; also improving diet quality had a beneficial effect on weight management particularly in people with high genetic risk for obesity in two cohorts from the USA(Reference Wang, Heianza and Sun41). The alternate healthy eating index-2010 score was scaled based on eleven food groups and nutrients with an extremely wide range and high sensitivity for differentiating between individuals with different dietary patterns.
A higher adherence to the Mediterranean dietary pattern was associated with lower obesity risk in subjects with high GRS, compared with individuals with low GRS and lower adherence to the Mediterranean dietary pattern(Reference Hosseini-Esfahani, Koochakpoor and Daneshpour42). In our study, salty snacks and sweetened fruit juices were included in the healthy dietary pattern which indicated that participants consumed these food groups along with other healthy food items with a median correlation. Also subjects in the upper quartiles of the healthy dietary pattern score had higher energy intake than individuals in lower quartiles due to overconsumption of foods; this observation can be explained by the fact that total energy intake is more relevant than dietary fat intake, and people merely replace energy from fat with energy from carbohydrates. Also, variations in food group intake and overconsumption of foods may restrict the sensitivity of the healthy dietary pattern and contribute to the lack of the interaction term between this pattern and FTO GRS in relation to obesity traits.
In a meta-analysis of weight loss trial, individuals carrying the homozygous risk allele of FTO variant rs9939609 (or proxy SNP) had greater weight loss than non-carriers after diet/lifestyle trials; the effect size was greater with diet intervention than other lifestyle interventions, considering adjustment for baseline BMI(Reference Xiang, Wu and Pan43). In another meta-analysis of 9563 participants of eight randomised clinical trials, subjects carrying the FTO genotypes respond equally to adiposity measure after weight loss interventions(Reference Livingstone, Celis-Morales and Papandonatos44).
Higher adherence to the Western dietary pattern was inversely associated with obesity at baseline, in spite of more increments in BMI and WC after follow-up years, in contrary to subjects with higher adherence to the healthy dietary pattern; this may suggest that obese subjects had a lower rate of increase in BMI than normal-weight subjects(Reference Akbarzadeh, Moghimbeigi and Mahjub45).
The prospective design and broad adjustment for potential confounding factors are the strengths of our study. Its results come from an approximately homogeneous population. Data measurements were not self-reported and gathered by trained questioners.
The present study has limitations that need to be considered. There are confounding factors such as mental health and sleeping patterns that were not entered in the model. Lack of availability of a complete and standardised Iranian FCT is another limitation of our study. However, nutrient contents of specific foods are relatively consistent, and deviations may not be large enough to alter dietary intake. Also the estimation of usual nutrient intake from FFQ during the previous year reduces much error due to variations in nutrient compositions. Assessing dietary intake at only one time point is the other limitation of the present study.
Extracting dietary patterns through principal component analysis is subjective(Reference Hosseini-Esfahani, Djazaieri and Mirmiran32), although eigenvalues, scree-plots and interpretability lead the researcher to determine the best factor solution.
Considering the diminished effect of FTO minor alleles on obesity at older ages(Reference Corella, Arnett and Tucker33, Reference Bjornland, Langaas and Grill38), it is suggested to design future studies with large enough sample sizes to cover statistical power for analysing the effect of interaction of FTO GRS with dietary factors regarding obesity traits in an age- and sex-dependent manner.
Conclusion
Our findings demonstrated that the unhealthy or Western dietary pattern could increase the association of genetic susceptibility of FTO SNP with BMI or WC change. These results support dietary recommendations to reduce the consumption of unhealthy dietary pattern, including sweetened beverages, sweets, high-fat red meat, solid fats, refined grains, fast foods, salty snacks and high-fat dairy products for the prevention of obesity, namely, in subjects with more genetic predisposition to obesity.
Acknowledgements
The authors wish to acknowledge Ms Niloofar Shiva for critical editing of English grammar and syntax of the manuscript.
The present study was supported by the Research Institute for Endocrine Sciences, Shahid Beheshti University of Medical Sciences, Tehran, Iran (grant no. 840).
Authors’ contributions are as follows: F. H. E., G. K. and M. S. D. designed the study, analysed and interpreted the data and drafted the manuscript; M. S. D. and P. M. supervised the study, F. A. revised the manuscript for important intellectual content and final approval of the version to be published. All authors approved the final version of manuscript.
The authors declare that they have no conflict of interest.


