


A poor diet is responsible for more deaths globally than any other health risk factor(1,Reference Afshin, Sur and Fay2) . One aspect of dietary risk is the consumption of energy-dense, nutrient-poor (EDNP) foods and beverages: foods and beverages that contain added salt and/or saturated fat and/or added sugar(Reference Monteiro, Moubarac and Cannon3). This includes foods such as ice cream, cakes and confectionery, and beverages such as energy drinks, sports drinks and soft drinks. These are also known as unhealthy foods or junk foods. In the Australian context, despite recommendations that EDNP foods and beverages be consumed only sometimes and in small amounts(4), they currently account for approximately 35 % of daily energy intake for Australians over 2 years of age(Reference Johnson, Bell and Zarnowiecki5,6) .
The majority of food purchasing in high-income countries occurs in grocery stores, with a smaller percentage of sales occurring in convenience stores(Reference Backholer, Sacks and Cameron7). Sales data for foods and beverages represent a rarely used and potentially continuous source of information for estimating dietary intake at a population level. Such data can be analysed and monitored over time to support the development, implementation and evaluation of public health policies aiming to improve population diets(Reference Bandy, Adhikari and Jebb8). In Australia, sales of EDNP foods and beverages have not previously been assessed from a public health perspective.
The primary aim of the current study was to quantify changes in sales of selected EDNP food and beverage categories over 5 years across all major Australian food retail outlets. The secondary aims were to quantify the proportion of EDNP foods and beverages sold in different retail settings (i.e., supermarkets/grocery stores and convenience stores) and to examine seasonal trends in sales of EDNP foods and beverages in these settings.
Methodology
Data description
For the primary aim, country reports produced by the Euromonitor Global Market Information Database were used(9–18). These reports contain qualitative and quantitative information on sales of EDNP foods and beverages across major retail outlets in Australia – including grocery retailers (grocery stores, convenience stores and independent grocers) as well as non-grocery retailers (such as department stores) and internet sales. Quantitative information is presented as sales volume (‘000 tonnes per annum) and sales value (retail selling price $AU’000 000 per annum). Euromonitor estimates sales by collating data from primary and secondary sources, including trade interviews with relevant industry stakeholders, and reports from governments, companies, industries and trade associations.
For the secondary aims, information from Euromonitor country reports as well as information from the Nielsen Market Information Digest for grocery stores (Nielsen grocery store data), and Nielsen Convenience Market Information Digest for convenience stores (Nielsen convenience store data) were used. Nielsen grocery store data and convenience store data contain quantitative information on sales volume (‘000 items) and sales value (retail selling price $AU’000) per annum and per quarter for the period November 2014–2017 (grocery store data) and June 2014–2017 (convenience store data). Nielsen grocery store data comprise all sales that occur in three major Australian supermarkets: Woolworths, Coles and Metcash (IGA), and Nielsen convenience store data comprise all sales that occur in Australian convenience stores and fuel retail chains (such as 7–11, BP, Caltex Star Mart, Coles Express, Gull, Nightowl and Puma), except Woolworths petrol. Supermarkets that are excluded from the Nielsen grocery store data include sales in SPAR, Foodworks and independent retailers like Aldi, Costco and Freshplus.
To ensure variation in the price of EDNP food and beverage products over time or between retail settings did not confound results, all analyses utilised data on sales volume.
All datasets produced by Nielsen and Euromonitor relate to those EDNP foods that are sold off-trade. Off-trade sales refer to the sale of foods and beverages from retail outlets. On-trade sales (not analysed here) include foods and beverages purchased from bars, restaurants and other catering establishments.
Access to the Euromonitor Global Market Information Database was granted through Deakin University’s subscription (access is available to staff and students), and access to the Nielsen datasets was purchased using a National Heart Foundation Vanguard Grant (Award ID 101508).
Energy-dense, nutrient-poor food and beverage categories
Selection of EDNP food and beverage categories for analyses was guided by three criteria: (i) the definition of EDNP food choices in Guideline 3 of the Australian Dietary Guidelines(6); (ii) EDNP foods and beverages found to substantially contribute to daily energy intake of Australians(19) and (iii) foods and beverages that comprised a discrete category that could be unambiguously identified as EDNP foods or beverages in Euromonitor country reports for Australia and the Nielsen grocery store and convenience store datasets. Appendix Table 1 in the online supplementary material provides a list of all EDNP foods and beverages that were explored in the Euromonitor country reports and Nielsen grocery and convenience stores datasets.
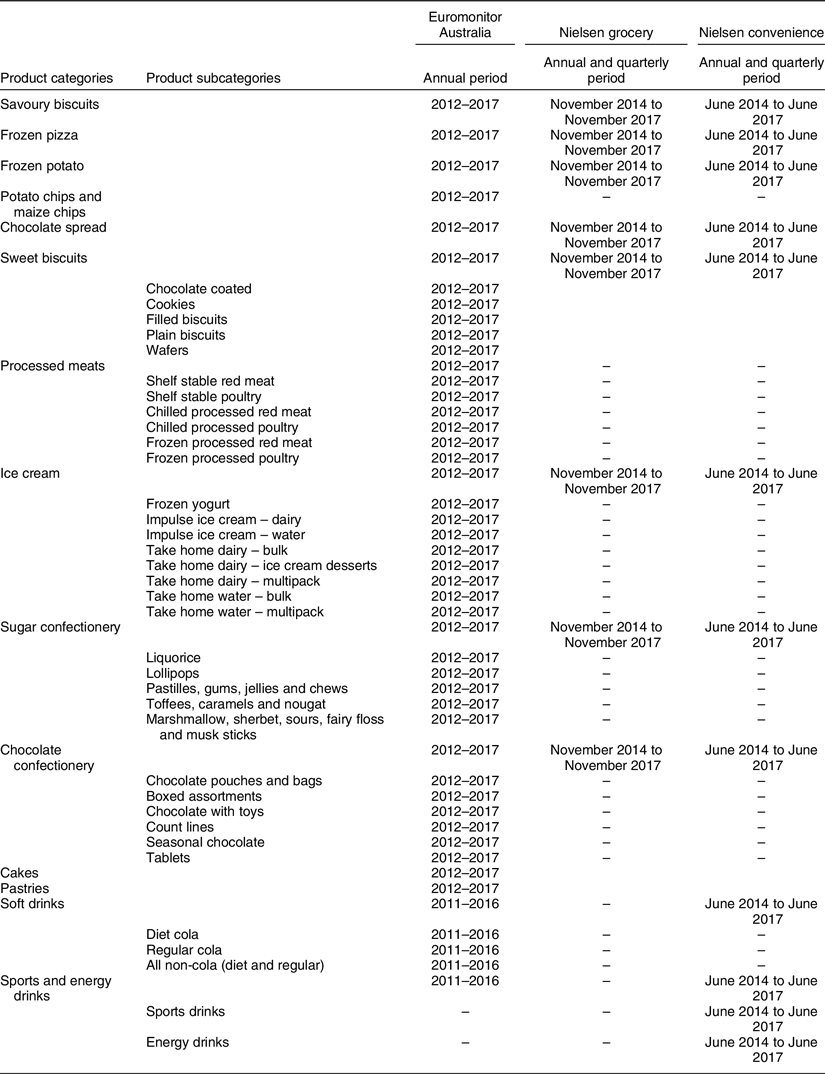
Thirteen eligible EDNP food categories and two EDNP beverage categories were extracted from the Euromonitor dataset, with detailed sub-category information available for some product categories only (Table 1). Eight eligible EDNP food categories and two EDNP beverage categories were extracted from the Nielsen grocery and Nielsen convenience store datasets (Table 1) for use in secondary analyses.
Energy-dense, nutrient-poor food and beverage product categories and sub-categories, and their availability across the Euromonitor and Nielsen datasets
Trends in energy-dense, nutrient-poor food and beverage sales in Australia
Annual volume sales per person (kg/capita or litres (l)/capita) over 5 years were estimated for each EDNP food and beverage product category or sub-category using volume sales information from Euromonitor country reports (2012:17 for EDNP foods and 2011:16 for EDNP beverages) and estimates of the Australian resident population at 30 June in each calendar year (all ages; between 2011 and 2017). The assumptions of linear regression for the relationship between survey year and each EDNP food or beverage category or sub-category were tested using scatter plots of the data (to visually assess whether the relationship between survey year and each EDNP food or beverage category or sub-category is linear) and a scatter plot of the residuals and the fitted values from each regression analysis (to visually assess whether the residuals are evenly distributed about the fitted trend line). Linear regression models were fitted to estimate annual change in each EDNP food and beverage product category or sub-category. The estimated annual change in sales was then divided by the observed sales in 2012 (EDNP foods) or 2011 (EDNP beverages) to calculate the average annual percentage-change in sales.
Proportion of energy-dense, nutrient-poor food sales from grocery stores and convenience stores in Australia
The volume sales in grocery stores in 2017 were compared with the sales in convenience stores to estimate the relative proportion of EDNP food volume sales (units) sold in grocery stores compared with convenience stores. During the course of the study, we found that information on beverage sales was not available in the Nielsen grocery store data. Consequently, it was not possible to compare sales of EDNP beverages in grocery stores and convenience stores.
Seasonal trends in sales of energy-dense, nutrient-poor foods and beverages in Australian grocery stores and convenience stores
Seasonal trends in volume sales (‘000 units) of EDNP foods and beverages in Australia were estimated using quarterly Nielsen convenience store sales data (28 June 2014 to 25 June 2017) and grocery store sales data (15 November 2014 to 12 November 2017). Sales in each quarter were aligned to the Australian seasons: summer (December−February), autumn (March−May), winter (June−August) and spring (September−November).
After testing the assumptions of linear regression (as described above), linear regression models were fitted using information on unit sales per season for each food and beverage category over time, adjusting for seasonality. The resulting coefficient and 95 % CI for autumn, winter and spring estimated the average change in sales in that season compared with average sales in summer.
The estimated seasonal change in unit sales was divided by an average of sales in summer to calculate the average seasonal percentage-change in sales.
Results
Five-year trends in energy-dense, nutrient-poor food sales in Australia
The assumptions of linear regression were met for each food product category and sub-category.
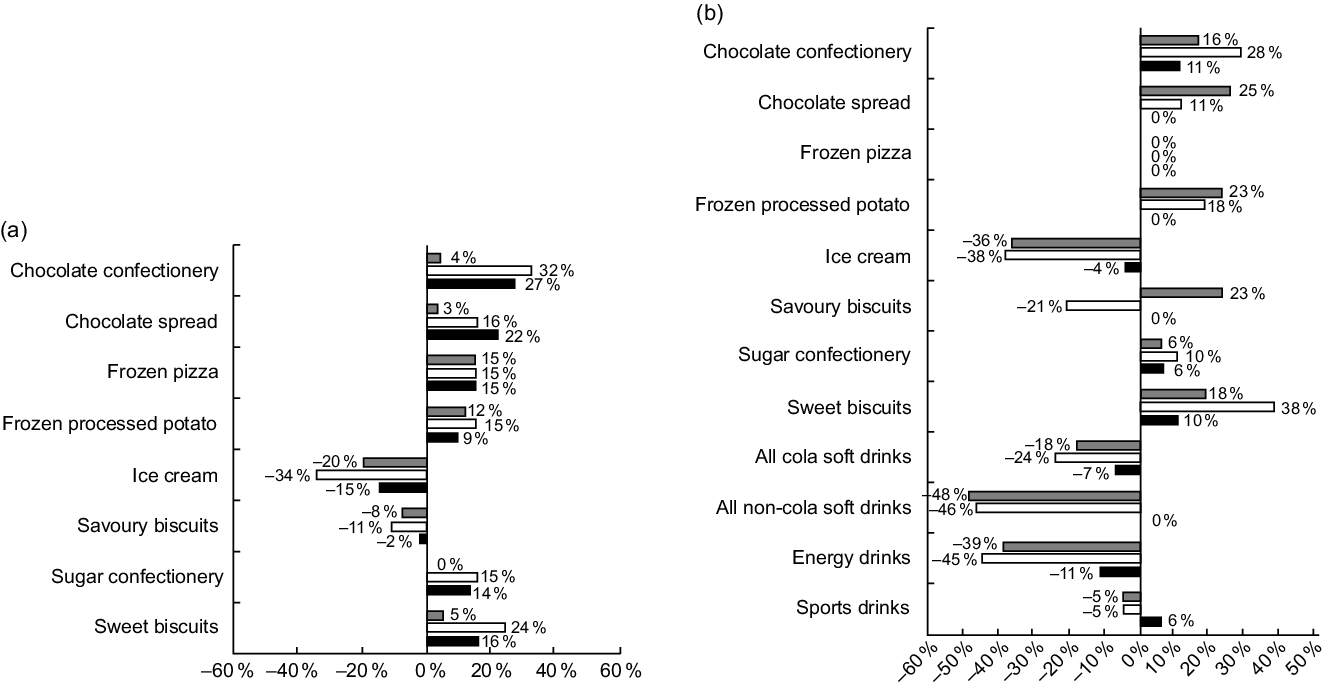
Figure 1(a) presents observed sales per capita per annum for each food category examined. In this paragraph, the annual percentage-change per capita per annum is reported, as well as the observed sales per capita per annum in 2012 and 2017. Between 2012 and 2017, there was no annual change in sales of sweet biscuits, cakes and chocolate spreads. In contrast, we observed annual per capita decreases in sales of processed meat (–1 %, 95 % CI –2, –1; from 4·8 kg in 2012 to 4·5 kg in 2017) and savoury biscuits (–2 %, 95 % CI –4, –1; from 2·3 kg in 2012 to 2·1 kg in 2017) (see Fig. 1 and online supplementary material, Appendix Table 2). Annual per capita increases were observed for all remaining food product categories. The largest relative annual per capita increases were observed for frozen pizza (6 %, 95 % CI 3, 8; from 0·9 kg in 2012 to 1·2 kg in 2017), pastries (5 %, 95 % CI 3, 7; from 1·8 kg in 2012 to 2·3 kg in 2017) and potato chips (5 %, 95 % CI 2, 7; from 1·8 kg in 2012 to 2·1 kg in 2017).
Sales (volume per capita) of energy-dense, nutrient-poor (EDNP) beverages between 2011 and 2016. (a): Sports and energy drinks (![]() ); low energy cola carbonates (
); low energy cola carbonates (![]() ); regular cola carbonates (
); regular cola carbonates (![]() ); total non-cola carbonates (
); total non-cola carbonates (![]() ) and EDNP foods between 2012 and 2017 across major retail outlets in Australia. (b): ice cream (
) and EDNP foods between 2012 and 2017 across major retail outlets in Australia. (b): ice cream (![]() ); processed meat (
); processed meat (![]() ); sweet biscuits (
); sweet biscuits (![]() ); chocolate confectionery (
); chocolate confectionery (![]() ); sugar confectionery (
); sugar confectionery (![]() ); frozen processed potatoes (
); frozen processed potatoes (![]() ); savoury biscuits (
); savoury biscuits (![]() ); potato chips (
); potato chips (![]() ); frozen pizza (
); frozen pizza (![]() ); tortilla chips (
); tortilla chips (![]() ); chocolate spreads (
); chocolate spreads (![]() ); cakes (
); cakes (![]() ); pastries (
); pastries (![]() )
)

Appendix Table 3 in the online supplementary material presents annual per capita 5-year trends in sub-categories of sweet biscuits, chocolate confectionery, sugar confectionery, ice cream and processed meats. Sub-categories of these EDNP food products tended to follow the trend observed for the total category: most sub-categories of sweet biscuits and chocolate confectionery did not change over time; most sub-categories of sweet confectionery and ice cream increased over time. For processed meats, while decreases were observed for all sub-categories of processed red meats (in line with trends in the total processed meats category), there was no change or small increases in sales of processed poultry.
Five-year trends in energy-dense, nutrient-poor beverage sales in Australia
The assumptions of linear regression were met for all EDNP beverages examined. Figure 1(b) presents observed sales per capita per annum for each beverage category examined. In this paragraph, the annual percentage-change per capita per annum is reported, as well as the observed sales per capita per annum in 2011 and 2016.
Total per capita annual soft drink sales decreased by –2 % (95 % CI –3, –2 %), from 79·3 litres in 2011 to 69·5 litres in 2016. We examined three sub-categories of soft drinks: diet cola, regular cola and all non-cola soft drinks. We observed decreases in sales of regular cola, which decreased by –6 % (95 % CI –7, –5 %; from 25·9 litres in 2011 to 18·3 litres in 2016) and all non-cola soft drinks, which decreased by –1 % (95 % CI –2, –1 %; from 31·1 litres in 2011 to 29·0 litres in 2016). Sales of diet cola did not change over the period 2011–2016. Conversely, total per capita annual sales of sports and energy drinks increased by 4 % (95 % CI 4, 5); from 8·1 litres in 2011 to 9·7 litres in 2016) (see Fig. 1 and online supplementary material, Appendix Table 2).
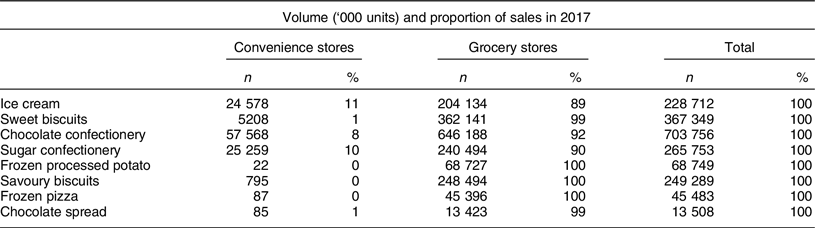
Sales of energy-dense, nutrient-poor food in grocery and convenience stores
The majority of EDNP food sales occurred in grocery stores (Table 2). The highest proportion of sales in convenience stores was observed for ice cream (11 %), sugar confectionery (10 %) and chocolates (8 %). Less than 1 % of sales of sweet biscuits, frozen processed potato (e.g., frozen French fries, frozen hash browns), savoury biscuits, frozen pizza and chocolate spread occurred in convenience stores (Table 2).
Annual volume sales of energy-dense, nutrient-poor foods in Australian convenience and grocery stores
Seasonal trends in energy-dense, nutrient-poor foods and beverages
Sales of almost all EDNP foods and beverages differed in summer compared with in autumn, winter and/or spring (see Fig. 2 and online supplementary material, Appendix Table 4). The exception to this was sales of frozen pizza in convenience stores. The most substantial percentage changes between seasons were observed for sales of ice cream in convenience stores (−36 %, 95 % CI −41, −32 % in autumn and −38 %, 95 % CI −43, −33 %) in winter compared with sales in summer) and energy drinks in convenience stores (−39 %, 95 % CI −46, −31 % in autumn and −45 %, 95 % CI −52, −37 % in winter compared with sales in summer).
Seasonal sales of energy-dense, nutrient-poor foods and beverages in Australian grocery stores (a) and convenience stores (b) over a 3-year period, relative to average sales in summer. ![]() , autumn;
, autumn; ![]() , winter;
, winter; ![]() , spring
, spring
Discussion
This is the first study to examine trends in sales of key EDNP foods and beverages over time in Australia. The current study demonstrates that sales of key EDNP food and beverage categories have been high during the entire period (2012−2017 for EDNP foods and 2011−2016 for beverages), and that most categories increased or remained stable relative to population growth over time. To put the observed changes in sales of EDNP foods and beverages into the context of average serving sizes(20), sales of pastries increased by half a 180 g commercial meat pie per person per year; sales of potato chips increased by 2−3 35 g serves per person per year; ice cream sales increased by 3−4 35 g scoops per person per year; total soft drink sales decreased by 5·3375 ml cans per person per year and processed meat decreased by two slices of salami per person per year. The trends observed in the current study indicate that public health nutrition initiatives are needed to reduce sales of all EDNP foods and beverages examined. For example, total soft drink sales substantially decreased between 2011 and 2016, sales in 2016 remained high – 69·5 litres per person or 3·5375 ml cans per person per week.
The current study also demonstrates that the vast majority of EDNP food sales occur in grocery stores compared with convenience stores, and that seasonal trends in sales of EDNP foods are similar across grocery and convenience stores. These findings align with previous research that shows the majority of all off-trade food sales in Australia occur in grocery stores(21). Grocery stores have also been found to disproportionately promote EDNP foods in prominent locations, including end of aisle displays and checkouts(Reference Thornton, Cameron and McNaughton22), in catalogues(Reference Cameron23) and through price promotions(Reference Riesenberg, Backholer and Zorbas24), and these environmental cues are likely to influence the food purchasing behaviour of the consumer(Reference Pechey and Marteau25). Public health food and nutrition policies should therefore consider the role of food retail stores (including grocery and convenience stores) as drivers of EDNP sales(Reference Backholer, Sacks and Cameron7). The body of research, including findings from the current study, indicates that interventions targeting the promotion of EDNP food in grocery stores will be an important component of population obesity prevention(Reference Backholer, Sacks and Cameron7). A comprehensive approach to obesity prevention should also target convenience stores. Much of the purchasing in convenience stores are impulse purchases, so it is an important target in terms of overall culture change.
The declining sales of processed meats observed in the current study is in line with previous research in the UK(26). Analysis of consecutive UK National Diet and Nutrition Surveys showed a reduced consumption of processed meats between 2008/2009 and 2016/2017 for all age and sex groups. The declining consumption of processed meats observed in the current study is likely to be part of a long-term (1998−2018) decline in consumption of red meats (beef and sheep)(27). The most recent Australian agricultural commodities report primarily attributes this long-term decline in consumption of red meats to the increasing affordability of poultry and pig meat relative to the cost of red meat over this time period(27). The Euromonitor country report for processed meats in Australia suggests consumers are increasingly conscious of the impact of meat consumption on their health and the environment and are embracing alternative sources such as vegetarian meat alternatives and seafood(16). A recent US survey has also reported that cost and health concerns are driving some individuals to reduce their consumption of processed meats(Reference Neff, Edwards and Palmer28). This shifting of consumers away from processed meats is encouraging from a public health perspective. A high consumption of processed red meats is associated with an increase in the risk of death from all causes, CVD and specific cancers(Reference Chan, Lau and Aune29,Reference Willett, Rockström and Loken30) . Future research that can unpack the cause of declining consumption of processed meats may help to inform the development of public health nutrition initiatives aiming to reduce consumption of other discretionary foods and beverages.
The reduction in sales of soft drinks observed in the current study is in line with previous Australian research(31–Reference Brand-Miller and Barclay33). Mintel, a market research company, reported a 4·7 % decrease in carbonated soft drinks sales in Australia in 2 years prior to 2016(31). Further, Mintel conducted a survey completed by 1406 internet users from major cities in Australia which reported that one in three Australian consumers say they are limiting their intake of sugar in their diets(31). According to data from the Australian Bureau of Statistics, the proportion of respondents who self-reported consuming soft drinks in the 24 h prior to completing the survey decreased from 49 % in 1995 to 42 % in 2011–2012, and artificially sweetened soft drinks increased from 8 to 10 %(32). A recent study that compared four different relevant datasets available from the FAO of the United Nations, The Australian government, academia and the food industry also noted a decline in soft drinks consumption in Australia(Reference Brand-Miller and Barclay33). A decrease in soft drink consumption is encouraging from a public health perspective as soft drink consumption has been linked to poor health outcomes, including obesity, type 2 diabetes, CVD and dental decay(Reference Vartanian, Schwartz and Brownell34–Reference Malik, Popkin and Bray38). Media attention calling for a reduction in sugar intake and an increasingly health-conscious population may be a driving force behind the downward trend in soft drink consumption(Reference Boles, Adams and Gredler39,Reference Browne, MacDonald and Egan40) . Nevertheless, soft drink sales remain high – in 2016, 69·5 litres per capita (around 1·3 litres per person per week) of soft drinks were sold – indicating that further public health intervention may be warranted. Conversely, we observed an upward trend in sports and energy drinks between 2011 and 2016, consistent with those observed internationally(Reference Han and Powell41). Soft drinks, energy drinks and sports drinks all contain high levels of added sugars and are frequently marketed to children, adolescents and young adults. Additionally, sports and energy drinks are often marketed as improving hydration, performance and energy, giving them a ‘health halo’(Reference Crawford and Goldstein42). Consumption of drinks with high levels of added sugars has been linked to adverse health consequences including CVD, tooth decay and overweight and obesity(Reference Ali, Rehman and Babayan43,Reference BaniHani, Tahmassebi, Grumezescu and Holban44) . Globally, countries are considering policies to reduce the purchase and consumption of sports and energy drinks(45). Taxes on sugary drinks (including sport and energy drinks) are recommended by the WHO to limit consumption and have shown to be effective in several countries(Reference Backholer, Blake and Vandevijvere46). Additional policies include banning the sales of energy drinks to children, which has recently been implemented by the largest supermarket in New Zealand(47) and has been adopted voluntarily in the UK by supermarket retailers(48). Policies requiring energy drink package size is capped at a single serve may also be a viable option(Reference Cleghorn, Blakely and Mhurchu49). Adoption and implementation of such public policies in Australia could support and augment the downward trend in soft drink sales.
Seasonal trends in sales of EDNP foods were observed in the current study for almost all product categories analysed. Seasonal trends in sales may occur for a multitude of factors including temperature, social norms and holiday seasons. A 2016 report examining the foods and beverages purchased in Scotland noted a large uplift in sales of EDNP foods and beverages over the festive season(50). Another potential explanation for seasonal differences in sales could be the price promotion cycle. A recent study, auditing price promotions in an Australian supermarket(Reference Riesenberg, Backholer and Zorbas24), concluded that ice cream was more frequently price promoted in summer compared with winter and spring, which aligns with the seasonal trend observed here. The impact of price promotions on increases in category sales has been previously reported(Reference Bennett, Zorbas and Huse51). Future research that can understand the extent to which seasonal variations in price promotions is driving seasonal variations in food and beverage sales may help to inform public health food policy. Nevertheless, the research to date demonstrates that a comprehensive approach to food policy aiming to improve population diets and health must target a wide range of food and beverage products across the year.
The first strength of the current study is the use of sales data to examine trends in EDNP foods and beverages over time, rather than using self-reported consumption data, as sales data are unaffected by recall biases. While food wastage and spoilage may mean that sales data overestimate actual consumption, there is no indication that levels of food wastage or spoilage have changed over the past 5 years, and these issues are likely to be less important for EDNP foods and beverages which typically have a long shelf life. Analyses of trends in food wastage will be required to validate this assumption.
Accessing two company databases for Australian food and beverage sales data is also a strength of the current study, as the Nielsen and Euromonitor databases capture different aspects of the EDNP food and beverage landscape. While the Euromonitor database provides an estimate of annual sales across all retail environments in Australia over 5 years, the Nielsen database provides actual quarterly sales data for select grocery and convenience stores. This allowed for a comprehensive examination of when and where EDNP food and beverage products are sold, and how sales are changing over time. Further, when overlapping data were present the results were reinforced.
The primary limitation of the Euromonitor dataset is that it does not directly measure sales but relies on primary and secondary data sources to provide estimated sales data. This may impact the accuracy of data from this source; however, because Euromonitor collects the data in a similar format each year, the data are likely to represent an accurate indication of changes in sales over time.
The primary limitation of the Nielsen Convenience Market Information Digest and Nielsen Market Information Digest datasets is that only sales in major supermarkets and convenience stores are measured. This limitation is unlikely to affect our conclusion that the majority of EDNP food and beverage sales occur in supermarkets because the supermarkets and convenience stores included in the Nielsen datasets account for the vast majority of market share(52,53) , and because the difference in sales between supermarkets and convenience stores in this sample was substantial, we found that over 89 % of EDNP food and beverage sales occurred in supermarkets.
Finally, both the Nielsen datasets and Euromonitor data for packaged food reflect only off-trade sales – sales that occur in retail outlets; rather than on-trade sales – sales that occur in restaurants, fast-food venues and from street vendors, such as food trucks. As on-trade sales are continuing to increase in Australia(54), particularly through emerging avenues such as app-based delivery services, an analysis of data that incorporates on-trade and off-trade sales may be informative.
The use of food and beverage sales data in academic research has been increasing over the past decade(Reference Bandy, Adhikari and Jebb8). To the best of our knowledge, there has not yet been a comparison of findings from food and beverage sales data with findings from population nutrition surveys. Sales data and population nutrition surveys both have limitations, and future research that can bring together findings from both data sources is likely to produce a more complete picture of the public health nutrition landscape than either data source alone.
Conclusion
The current study used sales data for the first time to quantify changes in key EDNP foods and beverages over a 5-year (2011–2017) period in Australia. Sales of key EDNP foods and beverages were found to be high over the entire analysis period, and most food and beverage categories either increased or remained stable relative to population growth. These results demonstrate that public health policies to reduce sales of EDNP foods and beverages are needed. Grocery stores were found to account for relatively more EDNP food sales compared with convenience stores. This indicates that grocery stores are likely to be an important avenue for public health action to reduce EDNP food and beverage purchasing, but a comprehensive approach to obesity prevention must include convenience stores as well.
Acknowledgements
Acknowledgements: None to report. Financial support: The current project was supported by a National Heart Foundation Vanguard Grant (Award ID 101 508). KB was supported by a Future Leader Fellowship from the National Heart Foundation (102 047); A.J.C. was supported by an Australian Research Council Discovery Early Career Researcher Award (DE160100141); G.S. was supported by a Future Leader Fellowship from the National Heart Foundation (102 035) and an Australian Research Council Discovery Early Career Researcher Award (DE160100307); C.N.M. was supported by grants from the Health Research Council of New Zealand (18/672 and 16/443) and the Healthier Lives National Science Challenge; C.N.M., A.P., G.S., A.J.C. and K.B. are researchers with the National Health and Medical Research Council (NHMRC)-funded Centre of Research Excellence in Food Retail Environments for Health (RE-FRESH) (APP1152968); G.S. and C.N.M. are researchers within a NHMRC-funded Centre for Research Excellence entitled Reducing Salt Intake Using Food Policy Interventions (APP1117300). No funder had any role in the research design, data analysis or writing of the current article. Conflict of interest: There are no conflicts of interest. Authorship: E.G. cleaned and analysed the data, and was a major contributor in writing the manuscript; D.R. was a major contributor in writing the manuscript; E.G., D.R., K.B., A.J.C., G.S., C.N.M. and A.P. designed the study, interpreted the results and edited the manuscript. All authors read and approved the final manuscript. Ethics of human subject participation: The current study was conducted according to the guidelines laid down in the Declaration of Helsinki, and all procedures involving human subjects/patients were approved by the Deakin University Human Research Ethics Committee (approval no. 2017-111). Ethics approval for the current study was obtained through the Deakin University Human Research Ethics Committee; 2017-111.
Supplementary material
For supplementary material accompanying this paper visit https://doi.org/10.1017/S1368980020002347


