


Monitoring the food consumption status of a population is fundamental in evaluating its effects on health and in supporting public health policy decisions( 1 ). Nationwide dietary surveys directly measure individual food consumption with appropriate collection instruments such as 24 h recalls or food records( Reference Neufeld and Tolentino 2 ). However, these methods are complex and expensive, which constitutes a barrier to application in middle- and low-income countries( Reference Fiedler, Lividini and Bermudez 3 , Reference Gibson 4 ). In the absence of such surveys, researchers have relied on food purchase data to infer data on food consumption. Household Budget Surveys (HBS) have been conducted periodically in various countries and usually collect information on the amount and price of all items purchased by household members throughout a defined period.
In Brazil, a range of publications have used information from previous HBS to describe the nutritional transition, trends in healthy and unhealthy eating, and how these occur according to socio-economic status( Reference Levy, Claro and Mondini 5 – Reference Mondini and Monteiro 8 ). Likewise, countries such as Canada( Reference Moubarac, Batal and Martins 9 ), Portugal( Reference Santos, Oliveira and Rodrigues 10 ), Bolivia( Reference Pérez-Cueto, Naska and Monterrey 11 ), Costa Rica( Reference Blanco-Metzler, Claro and Heredia-Blonval 12 ), Croatia( Reference Antonić-Degac, Kamenski and Butigan 13 ) and Mexico( Reference Valencia-Valero and Ortiz-Hernández 14 ) have made use of HBS to describe dietary trends. However, the degree to which food purchase information is able to provide accurate information about what is actually eaten in a given population is a matter of debate. Discrepancies between consumption and purchase data are to be expected, given that the latter refers to the total amount acquired by a household but not necessarily eaten. For instance, purchased food can be wasted or destined for animal feeding and donation; besides this, some items are used as ingredients in recipes (such as wheat flour, sugar, milk, etc.)( Reference Fiedler, Lividini and Bermudez 3 , Reference Murphy, Ruel and Carriquiry 15 , Reference Bermudez, Lividini and Smitz 16 ). Additionally, HBS do not collect information on foods purchased and consumed outside the home, which is considered an important source of discrepancy. Data from Brazil for 2008–2009 found that 18 % of total energy intake comes from foods eaten away from home, where the highest contributors were alcoholic beverages (of which 59 % were consumed away from home), baked and deep-fried snacks (54 %), pizza (42 %), soft drinks (40 %) and sandwiches (40 %)( Reference Bezerra, Souza and Pereira 17 ).
Regarding energy intake, the concordance between purchase and consumption data varies. Purchased energy was found to be lower than consumed energy in Armenia( Reference Martirisova 18 ) and Cape Verde( Reference Pereira, Troubat and Sibrian 19 ); in both studies, the difference between purchased and consumed energy was found to be modified by household income. On the other hand, the opposite result was found in Kenya, in which purchased energy was found to overestimate consumption( Reference Kaara and Ramasawmy 20 ). The last Brazilian HBS (2008/2009) included, for the first time, a dietary survey (National Dietary Survey (NDS)) in which a representative sub-sample self-filled two non-consecutive food records, making it possible to compare the two methods. Louzada et al.( Reference Louzada, Levy and Martins 21 ) compared estimates of ultra-processed food (UPF) products obtained from the HBS and NDS of 2008/2009 and found good agreement between them, although the purchased energy of UPF products overestimated consumption in the highest tertile of household income. However, there is no information available on how these two methods compare regarding main food groups – information which would be useful to better interpret previous studies and to support methodological decisions for future studies based on purchase data. Therefore the objective of the present study was to compare household purchase and individual food consumption data collected in two nationwide surveys, for the same households and spanning the same period.
Method
Study population
The HBS and NDS were carried out from May 2008 to May 2009 in a representative probabilistic sample of Brazilian households. The detailed sampling procedure employed in these surveys is described elsewhere( 22 ). Briefly, the HBS involved two-stage cluster sampling, with primary sampling units consisting of 12 800 census tracts grouped into 550 sampling strata with geographical and socio-economic homogeneity; and secondary sampling units consisting of 55 970 private permanent households. Census tracts were selected through systematic sampling with probability proportional to the number of households in each stratum, and households were chosen by a simple random selection without replacement in each census tract. The information collection for each stratum was uniformly distributed throughout the 12 months of data collection. Food purchase across seven consecutive days was recorded in self-filled reports by household members, using a collective inventory booklet, which provided detailed information on quantities and prices.
NDS 2008 was conducted in a representative sample (25 %) of the HBS 2008/2009 households, consisting of 13 569 households and 34 003 individuals aged 10 years or older. In both surveys, the household data collection of each stratum was distributed throughout 12 months, thus accommodating seasonal effects on food purchase and consumption. Food consumption was also self-filled by all household members aged 10 years or older using food records referring to two non-consecutive days within the same week in which food purchase was recorded. Individuals provided detailed information on portions, cooking methods, additions, and time and place of consumption.
Data collection
Food purchase information for each household was collected using a seven-day collective acquisition diary, which provided detailed descriptions of the product, amount purchased, measuring units, place of purchase and the price, in both monetary and non-monetary acquisition, of foods, beverages and non-food items.
Food consumption information was obtained by the application of two non-consecutive food records, which were self-filled with detailed information including portion size, cooking method and place of consumption (at home, or not). Sugar consumption was estimated by the NDS as being 10 % of the total volume of reported drinks (such as juice, tea and coffee) when the interviewee reported a preference for adding sugar, and as 5 % when they reported use of sugar and artificial sweeteners. When a participant was unable to record his/her consumption, another household member assisted in the completion of the record.
Foods reported in both the HBS and NDS surveys were grouped according to those of previous Brazilian HBS publications on food purchase( Reference Levy-Costa, Sichieri and Pontes 6 , Reference Monteiro, Mondini and Costa 7 ). The main groups were: cereals; beans and legumes; roots and tubers; fruits; vegetables; meat; dairy products; eggs; oils and fats; sweets; soft drinks; and alcoholic beverages.
Food variables
Mixed foods reported in both surveys were disaggregated into their ingredients based on standard recipes( Reference Pinheiro, Lacerda and Benzecry 23 ). Most foods reported in the HBS were uncooked, meaning that their volume represented the amount as purchased (e.g. raw meat, cereals, etc.). However, the NDS collected information on foods as consumed, meaning their volume could have increased or decreased (by either water absorption or loss) so that the amount consumed could not be directly compared with the amount purchased. Thus, foods reported on the NDS were converted back to their ‘crude’ weights by correcting for cooking factors, which accounts for cooking methods such as frying and boiling( Reference Bognár 24 ). Furthermore, inedible portions of foods reported in the HBS were removed using correction factors( 25 ). After suitable correction, foods were converted into energy using the appropriate nutritional composition table( 25 , 26 ). We expressed food purchase and consumption in terms of average absolute weight (g/person per d) and relative contribution to total energy (%), for each food group.
Data analysis
Since the HBS covered only a 7d period of purchase information, the mean purchase for an individual household is affected by the random measurement error: while some households may have bought some food items in bulk (to be used in a month, for example), others may have not bought in the week that the interview took place. To overcome this, the sampling strata were used as the unit of analysis. Daily per capita food purchase and consumption were estimated by summing the amount of foods or food groups reported and dividing this by the total number of individuals within each sampling stratum. The overall mean was calculated as the average of all 550 strata mean for each food group. Standard errors and 95 % confidence intervals were calculated considering sampling weights and the complex sampling design of the surveys. Results are presented for the overall population and stratified into quintiles of household income. Given the fact that the HBS records food purchases that are potentially consumed at home by all household members, and that the NDS records foods consumed by individuals aged 10 years or older including those consumed away from home, two additional comparisons were performed: (i) considering only those foods reported in the NDS as being consumed at home; and (ii) considering only those households with individuals aged 10 years or older in the HBS.
Results
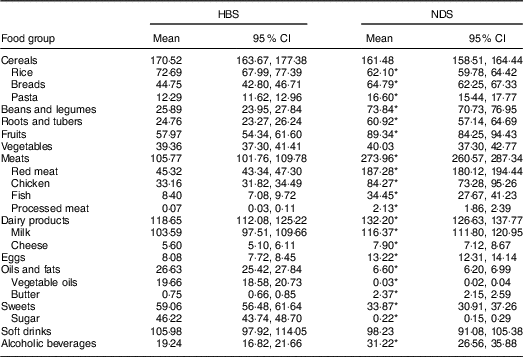
Table 1 shows the results comparing purchase and consumption data, as expressed in terms of relative contribution to total energy. There were no significant differences between the two methods for cheese, eggs, fruits, soft drinks and alcoholic beverages. Mean purchase was found to be higher for cereals, vegetables, sweets and dairy products; while it was lower for beans/legumes, roots/tubers and meats. Table 2 presents the results comparing purchase and consumption data expressed in terms of absolute weight. The mean of purchased goods was statistically lower than the mean of consumption for most foods, except for rice and sweets. No differences were found between the two methods for soft drinks, vegetables or cereals (Table 2).
Mean purchase and consumption of foods, in terms of relative contribution to total energy (%), estimated from the Household Budget Survey (HBS) and National Dietary Survey (NDS), Brazil, 2008/2009

* Mean food values were significantly different between surveys (P<0·05).
Mean purchase and consumption of foods, in terms of absolute amount (g/person per d), estimated from the Household Budget Survey (HBS) and National Dietary Survey (NDS), Brazil, 2008/2009
* Mean food values were significantly different between surveys (P<0·05).
The greatest differences between the methods were observed for meat (168 g/person per d), beans/legumes (48 g/person per d), roots/tubers (36 g/person per d) and fruits (31 g/person per d) when expressed as absolute amounts (Fig. 1(a)). When expressed as an energy contribution, the greatest differences were found for cereals (12 % difference) and oils and fats (11 %; Fig. 1(b)). Figure 1 also shows the differences between the two methods when restricting the analysis to foods reported as eaten in the home in the nutritional survey. The differences between the methods tended to be smaller for most of the main food groups (except for soft drinks and cereals), especially when the results were expressed as energy contribution (Fig. 1(c) and (d)). Differences between purchase and consumption data were, in most cases, lower in the highest compared with the lowest household income quintiles (Fig. 1(g) and (h)).
Differences between mean purchase and consumption of foods, in terms of absolute amount (g/person per d; left column) and relative contribution to total energy (%; right column), by main food group. Differences calculated as (purchase – consumption): (a, b) all households; (c, d) considering foods reported as eaten in the home (![]() , all households;
, all households;
![]() , all households but counting only those foods reported to be eaten inside the home in the NDS); (e, f) considering age of household members (
, all households but counting only those foods reported to be eaten inside the home in the NDS); (e, f) considering age of household members (
![]() , all households;
, all households;
![]() , households with members aged 10 years or older in the HBS); (g, h) considering household income (
, households with members aged 10 years or older in the HBS); (g, h) considering household income (![]() , lowest income quintile;
, lowest income quintile; ![]() , highest income quintile). Data from the Household Budget Survey (HBS) and National Dietary Survey (NDS), Brazil, 2008/2009
, highest income quintile). Data from the Household Budget Survey (HBS) and National Dietary Survey (NDS), Brazil, 2008/2009

When comparing only foods eaten at home as recorded in the NDS with foods purchased as recorded in the HBS, the differences between them, in absolute amounts, were smaller for some items compared with the whole sample, particularly for meats, dairy products, fruits and alcoholic beverages; with increased difference mainly found for cereals and soft drinks (Fig. 1(c)). On the other hand, when expressed as an energy contribution, differences were comparable across the whole sample, except for cereals (Fig. 1(d)).
These similarities and differences between the two methods were also observed to be of the same magnitude when considering only those households with individuals aged 10 years or older in the HBS (Fig. 1(e) and (f)).
Discussion
In the present study, we compared means of foods purchased and consumed from a large nationwide survey. In general, purchase information underestimated food consumption in terms of absolute weight for most items; but when both purchase and consumption data were expressed in terms of relative contribution to total energy, differences between the methods tended to be small. For example, the difference between purchase and consumption data for meats and roots/tubers was 168 and 36 g/person per d, respectively, implying an important discrepancy between the methods. These differences were considerably smaller in terms of energy contribution (3·30 and 0·53 %, respectively). The implications of these results are of special importance for Brazil, given that information on nutrition transition and trends in food consumption are derived from purchase data( Reference Levy, Claro and Mondini 5 – Reference Mondini and Monteiro 8 ). Concern about how much one can infer on consumption from purchase data has increased among researchers considering the high participation of foods away from home (15 %). Thus, despite disagreement regarding some items, Brazilian food trends over the last four decades are possibly well described from purchase data. For some food items, such as cereals, meat and beans/legumes, however, the inference on consumption from household availability seems to be limited.
Discrepancies between purchase and consumption data are to be expected since the purpose, and instruments, of data collection differ. However, some of the discrepancies might be better explained by how the foods are used at home. For example, water absorption during the cooking process makes cooked beans heavier than raw beans. However, even after making corrections for cooking factors, which removes the weight gained through cooking, the differences between methods are still important. In this specific case, there may have been an overestimation of the beans consumed since they are often eaten as ‘bean broth’ in Brazil, which adds extra water increasing the weight and volume. On the other hand, vegetable oils and sugar are often used as ingredients in recipes (such as cookies, cakes, drinks, etc.) rather than being eaten directly, which might mean their consumption is not accurately reported with instruments such as 24 h recalls or food records. This would explain the large difference between the data from the two methods for oils and fats.
Another study in Brazil( Reference Claro, Jaime and Lock 27 ) assessed differences between purchase and consumption data using only data from the biggest city in Brazil (São Paulo). That study found an overestimation in fruit (36 %) and vegetable (93 %) purchase compared with actual gram intake from a 24 h recall. This divergence from our results may be due to methodological issues: we disaggregated recipes into food ingredients and accounted for all of them in a corresponding main food group (e.g. tomatoes and carrots in a mixed dish were assigned to the vegetables group); besides, the previous study did not correct for cooking factors, which would increase the amount eaten due to water absorption during cooking. Nevertheless, some of our results are in accordance with studies from Kenya( Reference Kaara and Ramasawmy 20 ) and Poland( Reference Sekula, Nelson and Figurska 28 ), which found similar results for cereals, dairy products, pulses and sugar in terms of energy contribution, and in terms of absolute average amounts for fruits, sugar, and oils and fat.
As with our study, studies using data from Cape Verde( Reference Pereira, Troubat and Sibrian 19 ) and Armenia( Reference Martirisova 18 ) also observed an effect of income on the relationship between purchase and consumption: means of purchase were underestimated in lower-income households and overestimated in higher-income households. However, these analyses were limited to total energy. In Brazil, Louzada et al.( Reference Louzada, Levy and Martins 21 ) found that absolute purchases of non-UPF and UPF tend to be overestimated in higher-income households. In our analyses, mean differences between the two methods were generally found to be lower for the highest quintile of household income, which implies relatively less reliable inferences regarding food consumption from food purchase data for some items in the lower income quintile. For example, rice represents 11·8 and 7·9 % of total energy in the highest quintile of household income, using purchase and consumption data, respectively. In the lowest quintile, these values are 18·6 and 9·9 %, increasing the distance between purchase and consumption information.
An important limitation of food purchase data for nutritional surveillance is the absence of foods bought or attained away from home. Borlizzi et al.( Reference Borlizzi, Delgrossi and Cafiero 29 ) highlighted that received foods eaten away from home represent about 9 % of total energy consumption, with a significant influence on consumption across income strata, in Brazil. In fact, away-from-home intake represents a substantial percentage of total intake for some foods, such as breads (9·1 %), pasta (15·7 %), beans (12·4 %), fruits and vegetables (16·2 %), alcoholic beverages (60·8 %) and meats (16·7 %)( Reference Bezerra, Souza and Pereira 30 ). As expected, for these items we observed higher means for consumption than for purchase, given the latter considers only purchased foods acquired for domestic consumption. However, eating away from home seems not to be the main reason for the differences found between the two methods. When considering only foods eaten at home in comparison with foods purchased, the differences were only slightly smaller than when considering all foods reported (inside and outside the home), especially for results expressed as a percentage of energy intake. In line with this finding, Louzada et al.( Reference Louzada, Levy and Martins 21 ) observed a significant difference in the relative contribution of UPF and non-UPF to total energy between total purchase and consumption in Brazil. However, when comparing total purchase with consumption inside the home, the relative contributions became very similar.
Another methodological issue which merits consideration is that of the study population. In the HBS, all foods were recorded and supposed to be consumed by any household member, regardless of age. In the NDS, on the other hand, only foods consumed by individuals aged 10 years or older were recorded. Children are counted as household members in defining the population in each sample stratum, but they are expected to require less or more food in comparison with adults, which potentially could under- or overestimate foods purchased compared with foods consumed. The type of foods purchased will be impacted by the presence of children; for example, households with children are likely to purchase more milk and other dairy products compared with those without. On the other hand, adults will probably acquire more rice, beans, meats and alcoholic beverages. However, the comparison considering only households with individuals over 10 years old showed similar results, suggesting a small impact of the differences between the methods.
Finally, it is important to consider that food consumption from food records is subject to under-reporting( Reference Prentice, Mossavar-Rahmani and Huang 31 ). A validation study, using the same methodology as that applied in the NDS to measure food consumption, compared energy intake in eighty-three adults with energy expenditure from double-labelled water and found the rate of under-reporting of energy intake to be about 30 %( Reference Lopes, Luiz and Hoffman 32 ). This suggests that, for most foods, differences between purchase and consumption data might be still higher, although we cannot assess the degree of this for each food item.
Conclusion
In conclusion, food purchase data, when expressed as percentage contribution to total energy, can provide a good picture of actual consumption for most main food groups consumed by the Brazilian population, with the exception of cereals, which are strongly underestimated, and beans/legumes and meat, which are overestimated. On the other hand, food purchase data expressed in terms of absolute weight over- and underestimate consumption considerably for the main food groups such as meat and beans/legumes; in such cases, their use in inferences about consumption cannot be deemed accurate.
Acknowledgements
Financial support: This study was financed in part by the Coordenação de Aperfeiçoamento de Pessoal de Nível Superior - Brasil (CAPES; grant number 1701627). CAPES had no role in the design, analysis or writing of this article. Conflict of interest: None. Authorship: D.C.R.S.O. and E.V.J. conceptualized the study question, designed the research and analysed the data. A.M.S., R.B.L. and R.S. reviewed the analyses and the manuscript and provided comments. D.C.R.S.O. and E.V.J. had primary responsibility for final content. All authors reviewed and approved the final manuscript. Ethics of human subject participation: This study was conducted according to the guidelines laid down in the Declaration of Helsinki and all procedures involving human subjects were approved by the local ethics committee. Written informed consent was obtained from all subjects.


