


Both humans and rats demonstrate an innate appetite for salt and ingest it in excess of their apparent needs. A high-Na diet may result in hypertension; however, there are significant individual differences between humans as well as between strains of rats in sensitivity to salt(Reference McCarron1, Reference Leenen and Yuan2). The causes of Na intake in amounts greater than physiologically needed as well as the mechanisms whereby salt intake elevates blood pressure are not clear. Several causative links between a high-Na diet and the development of hypertension have been postulated. For example, it has been suggested that a high-Na diet increases the concentration of Na in the plasma or the cerebrospinal fluid. These in turn may stimulate peripheral or brain mechanisms leading to the expansion of blood volume, increased cardiac output or peripheral resistance, all of which may elevate arterial blood pressure(Reference de Wardener, He and MacGregor3, Reference Huang, Van Vliet and Leenen4). Interestingly, there is strong evidence for the involvement of common pathways in the regulation of Na intake and arterial blood pressure. It has been found that aldosterone and angiotensin II, two hormones that play a pivotal role in the regulation of blood pressure, have also a significant influence on Na intake(Reference Stellar5).
Total intake of Na depends on Na appetite, also referred to as Na hunger, and on Na preference. The latter can be described as a relative measure of the ingestion of high-Na food in comparison with the ingestion of low-Na food. An increased preference for a high-Na diet usually signifies the increased intake of Na, on condition that total food intake is not affected. Pioneer research studies on Na appetite were undertaken by Richter(Reference Richter6), who found that adrenalectomised rats significantly increase their intake of saline solutions in preference to water. Later, Epstein & Stellar(Reference Epstein and Stellar7) demonstrated that salt appetite is innate and does not depend on learning. Several lines of evidence suggest that the development of salt taste and Na preference may be modified during early stages of life by changes in dietary Na content. However, no specific pattern for Na preference variation has been established, since both excess and restricted early Na dietary availability have been found to reduce or increase, or do not change Na intake in adult rats(Reference Lesham8).
In previous studies, authors have tested Na preference and appetite by presenting rats with NaCl solutions. In the present study, we decided to determine Na preference by exposing rats to solid food. This approach is important since under most conditions of life, Na intake depends on the ingestion of solid food rather than on drinking salty liquids. In contrast to the latter, the consumption of salty food is associated with the ingestion of a number of nutrients and intake of energy. Therefore, it seems likely that Na preference as well as cardiovascular responses to the ingestion of a high Na load may depend not only on the size of the load but also on the ingestion of other compounds.
Recently, excessive Na intake has been reappraised as the major risk factor of hypertension; however, a number of studies have highlighted the importance of other factors such as genetic predispositions, intake of other ions and acquired disturbances in the mechanisms of handling Na(Reference McCarron1). In order to evaluate the role of early high-Na diet as a single factor that may affect Na intake, blood pressure and blood volume, we performed the experiments on healthy, young, normotensive Wistar-Kyoto (WKY) rats.
Experimental methods
The experimental design was approved by the Ethical Committee of the Medical University of Warsaw.
Animals
After suckling, 28-d-old male WKY rats (Animal Breeding Department, the Medical University of Warsaw) were assigned to three dietary regimens with the same energy content (12 MJ/kg) but with different Na content. Specifically, the rats were placed either on a high-Na (3·28%, group H), a medium-Na (0·82%, group M) or a normal-Na (0·22%, groups N and N′) pellet chow (Labofeed, Kcynia, Poland). The rats were maintained with free access to a specific diet and tap water ad libitum for 8 weeks. Subsequently, the animals were assigned to either a choice preference test or a sequence preference test. After the tests, all the rats returned to their living cages and were maintained on their initial diet for another week. Afterwards, resting arterial blood pressure, blood volume, plasma osmolality, blood K and Na levels were measured.
Preference tests
Choice test
In the choice test, each rat was put into a separate metabolism cage with free access to tap water and its initial chow which was presented in two identical feeding boxes. The first day was allowed for adaptation to the new environment. The next day, the chow from one of the boxes was changed, so that the animals from groups N (n 7) and H (n 7) had a choice between the high-Na diet and the normal-Na diet, whereas the rats from groups N′ (n 7) and M (n 7) were presented with the medium-Na and the normal-Na chow for the following 2 d. The position of the feeding boxes was changed every 24 h in order to minimise position-related preference.
Sequence test
In the sequence test, the rats were put individually into metabolism cages with free access to tap water and their initial diet. The first day was allowed for adaptation to the new environment. During two initial days, the rats continued to eat their initial diet. The next day, the chow was changed so that groups H (n 7) and M (n 7) were offered the normal-Na diet, group N (n 7) received the high-Na chow, while group N′ (n 7) was put on the medium-Na chow.
Arterial blood pressure, blood volume and electrolyte measurements
Resting mean arterial blood pressure was recorded for 30 min, on freely moving rats in their living cages, during the first 3 h of the light period. The detailed methodology has been described elsewhere(Reference Ufnal, Dudek and Szczepanska-Sadowska9). Blood volume was calculated according to the following formula: volume (ml) = (plasma volume/(100 − percentage of blood cells)) × 100. Measurements of plasma volume were performed according to the classical method of determining the distribution of Evans blue; the detailed methodology has been described elsewhere(Reference Gibson and Evans10). In short, blood was withdrawn from the femoral vein immediately before and 10 and 30 min after the injection of the dye into the other femoral vein. The Evans blue plasma concentrations were measured by photometry at the wavelength of 610 nm against blank plasma. Blood samples for the measurements of plasma osmolality, blood K and Na were obtained from the tip of the tail during the first hour of the light period.
Statistics
Results are expressed as means with their standard errors. In the preference tests, measurements from two consecutive days were averaged, and the mean values were taken for analysis. The differences between the groups were analysed using ANOVA, followed by Tukey's test (Statistica software, version 9; StatSoft Polska Sp. z o.o., Krakow, Poland). Values of P < 0·05 were considered to be significant.
Results
After 8 weeks of maintaining the rats on their initial diets, there were no significant differences between the groups in body weight (group N 288·3 (se 9·0) g; group N′ 291·0 (se 9·8) g; group M 293·6 (se 10·0) g; group H 291·9 (se 10·4) g) and food intake (group N 8·24 (se 0·41) g/100 g body weight, group N′ 8·45 (se 0·35) g/100 g body weight, group M 8·47 (se 0·61) g/100 g body weight, group H 8·65 (se 0·50) g/100 g body weight).
Choice test
Total sodium intake
There was no significant difference in total Na intake between the groups (group N 0·032 (se 0·0019) g/100 g body weight, group N′ 0·030 (se 0·0016) g/100 g body weight, group M 0·028 (se 0·0014) g/100 g body weight, H 0·031 (se 0·0042) g/100 g body weight).
Food preference
Group N v. group H
Factorial ANOVA (groups N and H × normal-Na and high-Na chow) revealed a significant difference in food intake within the groups (F(1,24) 402·4, P < 0·001). Both groups ingested significantly greater amount of the normal-Na chow than the high-Na chow (group N, P < 0·001; group H, P < 0·0001; by Tukey's test, Fig. 1(a)).
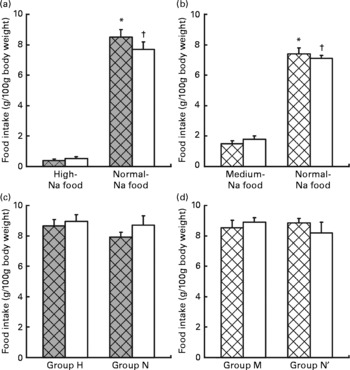
Fig. 1 Ingestion of food in the preference tests. Values are means, with standard errors represented by vertical bars. Choice test: (a) ingestion of food (g/100 g body weight) by rats maintained previously on a normal-Na diet (group N, □) v. rats maintained previously on a high-Na diet (group H, ![]() ). * Mean values were significantly different for ingestion of normal-Na food v. high-Na food in group H (P < 0·001). † Mean values were significantly different for ingestion of normal-Na food v. high-Na food in group N (P < 0·001). (b) Ingestion of food (g/100 g body weight) by rats maintained previously on a normal-Na diet (group N′, □) v. rats maintained previously on a medium-Na diet (group M,
). * Mean values were significantly different for ingestion of normal-Na food v. high-Na food in group H (P < 0·001). † Mean values were significantly different for ingestion of normal-Na food v. high-Na food in group N (P < 0·001). (b) Ingestion of food (g/100 g body weight) by rats maintained previously on a normal-Na diet (group N′, □) v. rats maintained previously on a medium-Na diet (group M, ![]() ). * Mean values were significantly different for ingestion of normal-Na food v. medium-Na food in group M (P < 0·001). † Mean values were significantly different for ingestion of normal-Na food v. medium-Na food in group N (P < 0·001). Sequence test: (c) ingestion of food (g/100 g body weight) by rats maintained previously on a normal-Na diet, □ (group N) v. rats maintained previously on a high-Na diet,
). * Mean values were significantly different for ingestion of normal-Na food v. medium-Na food in group M (P < 0·001). † Mean values were significantly different for ingestion of normal-Na food v. medium-Na food in group N (P < 0·001). Sequence test: (c) ingestion of food (g/100 g body weight) by rats maintained previously on a normal-Na diet, □ (group N) v. rats maintained previously on a high-Na diet, ![]() (group H). (d) Ingestion of food (g/100 g body weight) by rats maintained previously on a normal-Na diet, □ (group N′) v. rats maintained previously on a medium-Na diet,
(group H). (d) Ingestion of food (g/100 g body weight) by rats maintained previously on a normal-Na diet, □ (group N′) v. rats maintained previously on a medium-Na diet, ![]() (group M).
(group M).
Group N′ v. group M
Factorial ANOVA (groups N′ and M × normal-Na and medium-Na chow) revealed a significant difference in food intake within the groups (F(1,24) 215·9, P < 0·001). Both groups, N′ and M, ingested significantly greater amount of the normal-Na than the medium-Na chow (group N′, P < 0·001; group M, P < 0·001; by Tukey's test, Fig. 1(b)).
Arterial blood pressure, blood volume and electrolyte measurements
There were no significant differences between the groups in the following parameters: resting mean arterial blood pressure, heart rate, blood volume, plasma volume, haematocrit, plasma osmolality, blood Na and K levels (Table 1).
Table 1 Measurements of arterial blood pressure, blood volume and blood electrolytes in rats maintained on a normal-sodium diet (group N), a medium-sodium diet (group M) and a high-sodium diet (group H)
(Mean values with their standard errors)
Discussion
The results show that an early high-Na diet fails to affect Na intake, Na preference, blood volume and resting arterial blood pressure in WKY rats. These findings imply that Na intake in adult rats depends more on an innate Na appetite than on the experience of the rats with high-Na food during early stages of life. Furthermore, the study provides evidence that both blood volume and arterial blood pressure are closely regulated in normotensive rats that ingest high Na loads.
In the choice test, all groups preferred the regular diet and showed aversion to food with a higher Na content. Moreover, there was no significant difference in total Na intake between the groups. Therefore, we conclude that in contrast to Na depletion which increases Na intake(Reference Sakai, Frankmann and Fine11, Reference Thaw, Frankmann and Hill12), the ingestion of high-Na food in early life fails to affect Na intake in adult rats. The present results are somehow different from those obtained from the evaluation of Na preference by exposure of rats to saline solutions. Namely, Contreras & Kosten(Reference Contreras and Kosten13) found that rat offspring raised on a high-Na diet exhibit enhanced salt (NaCl solutions) preference when adult. In addition, Priehs et al. (Reference Priehs, Mooney and Bernard14) showed that rats maintained on a high-Na diet increase their intake of Na when given a low-Na solution. However, similar to the present results, they reported that rats showed lower preference for a high-Na diet (NaCl solutions). Therefore, it appears that the way in which Na is offered may have an impact on the outcome of the tests evaluating Na intake and Na preference. It has been found that the gustatory sense plays a key role in the control of salt intake(Reference Nachman and Valentino15). Furthermore, several lines of evidence suggest that salt taste depends on an interaction between Na ions and amiloride-sensitive Na channels as well as a vanilloid receptor-1 variant(Reference Heck, Mierson and DeSimone16, Reference Lyall, Heck and Vinnikova17). It is possible that there is a difference between the patterns of stimulation of the receptors by Na ions contained in NaCl solutions and Na from solid food. In contrast to saline, solid food contains a number of compounds that may interact with either Na ions or the receptors.
Furthermore, the results suggest that the primary imperative for rats that experience a change of Na content in their diet is to continue to meet their requirements for energy or vital nutrients rather than to maintain the intake of Na at the same level. Therefore, we hypothesise that in normotensive rats, ‘a Na intake set point’ is not affected by a high-Na diet introduced immediately after suckling and that it is secondary to ‘an energy set point’ or requirements for vital nutrients. This is based on the following premises. First, after 8 weeks of maintaining the rats on their initial diets with the same energy but with different Na content, there were no significant differences between the groups in total food ingestion and body weight. Second, in the sequence test, the rats which experienced the change from their initial diet to a new one with different Na content continued to eat the same amount of food and thus significantly changed their Na intake. The hypothesis, however, cannot be extrapolated to Na-deficit conditions and requires further testing using low-Na and high-Na diets with different energy levels.
High Na intake is widely considered the major risk factor of hypertension; however, the causative mechanisms are still not clear. It has been postulated that an increased Na ingestion may elevate Na blood level, and that even a slight increase in Na blood level, by 1–3 mmol/l, may result in hypertension due to the expansion of the extracellular fluid and blood volume(Reference de Wardener, He and MacGregor3). In our experiments, neither the medium- nor the high-Na diet affected the resting arterial blood pressure or the Na blood level. The results are consistent with our previous findings(Reference Zera and Ufnal18) and those of other investigators(Reference Leenen and Yuan2, Reference Calhoun, Wyss and Oparil19) who showed that a high-Na diet does not affect arterial blood pressure in WKY rats.
Additionally, the present study provides new evidence that a high-Na diet does not affect plasma and blood volumes in WKY rats. Although there are several lines of evidence that a high-Na diet affects the structure and the regulation of the circulatory system in WKY rats(Reference Leenen and Yuan2, Reference Zera and Ufnal18, Reference Calhoun, Wyss and Oparil19) as well as promotes the development of hypertension in NaCl-sensitive spontaneously hypertensive rats (which are derived from WKY rats)(Reference Calhoun, Wyss and Oparil19), the present study shows that in normotensive rats, both arterial blood pressure and blood volume are highly protected.
The limitation of Na content in food has historically been the core of nutritional polices. However, epidemiological data and numerous interventional studies in humans and animals provide evidence that the development of hypertension due to high salt intake depends on genetic make-up, acquired impairment in the mechanisms of handling Na and the intake of other ions(Reference McCarron1, Reference Woolfson and de Wardener20, Reference Hermansen21). The present study supports the notion that a high Na intake, as a single factor, is insufficient for the development of hypertension in young healthy animals.
In conclusion, the present study reveals that a high-Na diet introduced immediately after suckling does not affect Na preference and Na intake in adult WKY rats. The findings also indicate that both blood volume and arterial blood pressure are closely regulated in normotensive rats that ingest high Na loads.
Acknowledgements
The present study was supported by the Medical University of Warsaw. The authors have no conflict of interest to disclose. M. U. and T. Z. designed the research, conducted the study and wrote the manuscript. A. D. and M. S. analysed the data and wrote the manuscript. M. U. had the primary responsibility for the final content. All authors read and approved the final manuscript.


