


Although individual level demographic data before 1538 is sparse we have abundant evidence of the lives of the European nobility.Footnote 1 This analysis exploits recent mass digitization of family trees to examine trends in elite adult lifespan over the millennium between 800 and 1800.Footnote 2 The majority of the sample are from Northwest Europe, but there is substantial representation from all across Europe. Understanding that the sample is heavily skewed, and that this skew changes over time, I have four principle findings.
First, plague, which afflicted Europe 1348–1700, killed nobles at a much lower rate than it did the general population. Second there were significant declines in the proportion of male deaths from battle violence, mostly before 1550. I am able to estimate, from the timing of deaths within the year, the fraction of males who died violently in each epoch. Before 1550, 30 percent of noble men died in battle. After 1550, it was less than 5 percent.
Third finding there was a common upwards trend in the adult lifespan of nobles even before 1800. But this improvement was concentrated in two periods. Around 1400, and then again around 1650, there were relatively sudden upwards movements in longevity. In England and Wales, for example, the average age at death of noble adults increased from 48 for those born 800–1400, to 54 for 1400–1650, and then 56 for 1650–1800. This rise is independent of the fall in violent battle deaths. Finally, I find that there were regional differences in elite adult lifespan favoring Northwest Europe, that emerged around 1000 ad. While average lifespan in England in 1400 was 54, in Southern Europe, as well as in Central and Eastern Europe, it was only 50. The cause of this geographic “effect” is unknown.
The article is complimentary to recent work by Paul David, S. Ryan Johansson, and Andrea Pozzi (Reference David, S. Ryan and Andrea2010) and David de la Croix and Omar Licandro (Reference De and Omar2012). Footnote 3 David, Johansson, and Pozzi (Reference David, S. Ryan and Andrea2010) use Alison Weir's genealogy of the British Royal family to explore the evolution of life expectancy between 1500 and 1799. de la Croix and Licandro (Reference De and Omar2012) use a data set of more than 300,000 famous people from the Index Bio-bibliographicus Notorum Hominum to examine the long time trend in lifespan.Footnote 4
DATA
The Sample: The Family Trees of Europe's Elites
The elites studied here are aristocrats and nobles. Aristocracies are a hierarchical hereditary ruling class; hereditary monarchies have dominated European politics for most of the past millennium. Nobles are individuals connected to “notable” families who may or may not be aristocrats but who held status that conferred economic and legal privilege Bush (Reference Bush1983).Footnote 5 Of course, hereditary often determined the transmission of these privileges. The family trees of Europe's elites connected members by blood and matrimonial lines. Entry into the sample studied here consists of an individual being recorded in a noble family tree that has been digitized by the church of Jesus Christ of the Latter Day Saints (LDS).
“Baptism for the dead” is a doctrine of the LDS church.Footnote 6 The founder of the LDS church, Joseph Smith, revived the practice in 1840 and ever since, church members have been collecting historical genealogical data. The church has been at the frontier of the application of information technology to genealogy and has digitized a multitude of historical records. Today they make their research available online at familysearch.org. The records number in the billions. The source of the family trees used here are the online databases at histfam.familysearch.org, a collaboration between the LDS church (familysearch) and individual genealogical experts.
The individual data were originally transcribed from published works such as Burke's (Reference Burke1881a) “A Genealogical and Heraldic Dictionary of the Peerage and Baronetage,” “An Official Genealogical and Heraldic Baronage of England” by Gerald Paget (Reference Paget1957), and Percival Boyd's (Reference Boyd1954) “Pedigrees with index of London citizens, abt. 1600–1800,” numerous other published genealogical works, guild records, census records, parish registers, wills, and other published family genealogies. Boyd and Burke and Burke are the leading sources providing 295,892 and 127,269 records, respectively, followed by Anselme de Sainte-Marie and Ange de Sainte-Rosalie (Reference De and Ange1728) with 73,723 records and Detlev Schwennicke (Reference Schwennicke2005) 70,835.Footnote 7
Noble status was indicated by the presence of a suffix or title and each was assigned to one of 17 noble ranks. Nobles are ranked in rough order of prestige: the ranking is inferred from general sources such as William Doyle (Reference Doyle2010) and also Burke and Burke (Reference Burke1881b). The most elite title was Emperor (rank 1) of which there are 94 in the final adult lifespan subsample analyzed in this article. There are 843 Kings (rank 2) and 422 Grand/Archdukes (rank 3); 1,598 dukes, 683 prince/prince-electors, 4,787 Earls and Counts, 2,262 Marquesses and Margraves, 986 Viscounts, 6,444 Barons and Lords, 5,968 Baronets and 3,321 Knights constitute ranks 4–11. Esquires and Gentlemen along with other lesser noble titles, 1,795 persons, were assigned to group 12. A “Geographic’” title (rank 13) was one of the 699 cases where a person was listed as “of” a certain specific location. There were 69 military titles such as Captain and Colonel (rank 14) and 692 religious titles (rank 15, including 12 popes and 533 nuns). Occupational titles accounted for 1,343 (rank 16) and 83,644 had no suffix (rank 17). Those with no suffix represented the non-titled family members of the elite family trees.
Reliability, Coverage, and Representativeness
Family trees are an under-utilized resource for academic research, perhaps related to the difficulty of making the records amenable for statistical analysis. The family tree records used here contain 402,204 unique date descriptions. The entries are inconsistent, of varying quality, and sometimes refer to different calendars at different points in time. I have standardized all of these dates to decimal values of years, using random attribution for missing months and days. Each birth and death value was assigned a “quality” score from 1 (exact) to 4 (a 1–5 year range). This process is described in detail in the Online Appendix. Of the 1,329,466 individual records, 167,266 have a birth year between 800 and 1800 with an associated age at death. Of those, 115,650 have an age at death over 20 and 76,403 have a specific day of death.
A variation on the widely used concept of age heaping can be applied to the final sample of 115,650 to gauge the precision of the recorded birth and death years. Ten percent of years should end in any specified digit. Where years are attributed we should expect to detect this by a higher proportion of years ending in “0” or “5.” Figure 1 reports these proportions for the noble sample. Surprisingly, death years (and birth years ending in “5”) exhibit no significant heaping over the 1,000 years’ sample period. Birth years exhibit severe heaping in the earlier centuries evident in heaping solely around “0.” This declines consistently between 800 to 1800. If rounding is non-random this will bias the age at death estimates. To help attenuate this possible bias I include a dummy for birth years that end in “0” in the analysis.
How reliable are these data? We can examine the distributions of age at death by period and see if fantastical ages are being attributed or if some average is just blankly applied. This does not appear to be the case. As shown in Figure 2, the basic shapes of these distributions seem to reflect a fairly consistent underlying pattern. It does not appear that some different process, for example, speculative guesswork is driving the pattern before the sixteenth century, where we know the data are much better (and can be corroborated with parish records, etc.).Footnote 8 The connection of each individual record to its source(s) is a sign that at least the digitization and collation is of a tractable design.Footnote 9
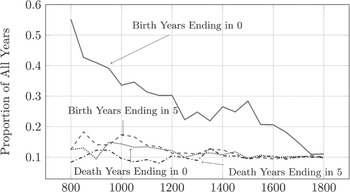
Figure 1 NOBLE YEAR “HEAPING” OVER TIME

Figure 2 DISTRIBUTION OF NOBLE AGE AT DEATH, BY SEX AND BIRTH CENTURY
There are 117,975 variations of locations of birth, marriage, and death attached to the full family tree data set. Each location has been Geo-coded for longitude and latitude, described in detail in the Online Appendix. Table 1 reports the geographic composition of the sample over time. The sample is heavily skewed towards later centuries and England and Wales. The sample reflects the existence of noble family trees, their historical survival and the interest of genealogists and LDS church members in the English speaking world. At the same time, there are significant numbers of nobles in the sample from earlier centuries and the South and East of Europe, but from 1700 the sample is dominated by Great Britain, Ireland, and France. Nevertheless, the sample is relatively unique in terms of its temporal and spatial coverage.
Table 1 THE COMPOSITION OF THE NOBLE ADULT AGE AT DEATH SAMPLE, BY BIRTH CENTURY AND EUROPEAN REGION
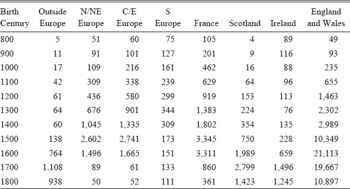
Source: Noble sample. The counts refer to the 115,650 observations with an age at death over 20. Regions are assigned based upon assigned place of birth (either observed or inferred—see the Online Appendix for details). Bounding boxes of longitude and latitude were established for the following regions. N/NE Europe (2,52)–(50,75), C/E Europe (8,44)–(50,52), and S Europe (−11,36)–(50,44). France, Scotland, Ireland, and England and Wales were assigned bounding boxes that match their modern territories.
The composition of the data does not reflect the composition of Europe's population being an extremely elite subsection. This article thus makes no claims about the general population, just this elite sub- section. The nature of the selection undoubtedly changed over time. We do not know how an individual born in 850 makes it in to the data versus someone born in 1650. The family trees artificially select for “successful” offspring and ancestors, neglecting the “failures.” However, as the standing of each member of the family is recorded via a suffix, selection based on success is directly observed. Thus I can control for the changing exclusivity of the sample over time.
There are other selection issues. Omission is serious. For example, there are more men recorded than women, and before 1500 there is under representation of infant and child deaths. I argue, however, that this genealogical data is amenable for scientific analysis because, firstly, the variable of prime interest, age at death, can be restricted to those dying at age 20 and over. Second, the nature of the changing composition of the sample is directly observed and this can be controlled for in the analysis (e.g., sex, suffix, data type, family tree, and geographic composition).
METHODOLOGY
Here I detail the empirical strategy used to characterize trends in adult lifespan amongst European nobility from 800 to 1800. As a quasi-robustness check, I first examine the data as a detector for the well-known years of plague outbreaks in Europe.Footnote 10 For this, I construct a simple index of mortality for the sample via the formula shown in equation (1).

where Mt is an index of mortality in year t. Nd is the number of deaths in a given year. A value of one means that mortality is exactly equal to a moving window of the annual average for five years before and after. This index is reported later in the article.
To investigate how many nobles died from battle, I employ a general version of the famous birthday problem.Footnote 11 If we take the number of exact-date deaths per year, n, and the number of deaths observed for a given day, m, we can calculate the probability that this combination will occur randomly.Footnote 12
Table 2 reports the top ten dates of death in the database. Each of these dates corresponds to a major European battle. Using the observed ranges of n and m (1–1,935 and 2–88, respectively), expected probabilities of coincident days of death were calculated.Footnote 13 After m = 13, the expected probabilities of any randomly occurring coincident dates of death in the sample are never above .5.Footnote 14 All of these dates are assigned as “likely violent.” Below m = 14, I assigned all dates as “likely violent” where the expected probability for that number of coincident deaths, given the number of deaths in that year, is below .5.
Table 2 TEN MOST FREQUENT EXACT DEATH DATES

Notes: m is the number of deaths on a specific day, n is the number of deaths in a year where the exact death date is observed. Calculated for the “Europe: Royal and Noble Houses” family tree only (to ensure no duplicates skew the calculation). All of these battles had heavy noble casualties.
Source: Noble sample.
I then apply sequentially, an ordinary lease square (OLS) model and a Bayesian Additive Regression Tree (BART) model to an estimation equation of the form:
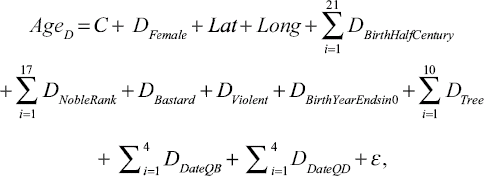
where AgeD = Age at Death (for those over 20), C is a constant, DFemale is a female dummy, Lat and Long are attributed latitude and longitude, DBirthHalfCentury are a set of 21 categorical variables indicating the 50-year interval of birth from 800 to 1800. DNobleRank are a set of 17 categorical variables indicating noble rank, DBastard equals one where an individual is the result of an illegitimate union,Footnote 15 DViolent is a dummy indicating where the death is likely violent, DBirthYearEndsin 0 is an dummy that indicates whether the birth year is recorded as ending in a zero. DTree identifies the family tree of origin and DDateQB and DDateQD are indicators (1–4) for the quality of the data for both birth and death, respectively. (Here data quality refers to the precision of the date estimate, where one is the exact date and four is a range over a set of years. See Online Appendix Tables 3 and 4 for detail on this.)
The empirical challenge is to extract from the noisy data the major time and spatial trends in noble lifespan while controlling for the changing selectivity and composition of the sample. equation 2 captures this by directly including controls for sex, geography, noble rank, and an indicator for a violent death. Further, the family tree of origin is included as a categorical variable as are 12 separate data quality variables. Every possible co-variate that could confound the characterization of the time-trends that can be included I have included here. The resulting coefficient estimates on the set of birth period dummies can, therefore, be interpreted as representing the controlled time trend.
After examining the data for evidence of a time-trend, I test for spatial heterogeneity via heat-maps and the separate estimation of equation 2 across sub-periods. To deal with the potential nonlinear effects of geography, I run a regression of the form:

equation 3 is exactly the same as equation 2 except for the inclusion of dummy variables for each integer value of longitude and latitude in the sample. Finally, I divide my sample into seven separate geographic regions and use a BART model to predict noble longevity across time and space, fully accounting for the inherent nonlinearity and heterogeneity.
Regression trees use algorithms to grow “trees” that recursively divide samples of the data along values of predictor variables that best fit the observed outcome (how regressions based upon those divisions predict the rest of the data decide the fit). BART models are a sum-of-trees approach that allow interaction and additive effects using priors to keep the individual tree effects small (and approximating a different part of the unknown function). To fit the model, BART uses an iterative Markov-chain Monte Carlo algorithm (Chipman et al. Reference Chipman, Edward and Robert2010; Green and Kern Reference Green and Holger2012). Here age at death can be modeled as the outcome of the predictor variables listed in equations 2 and 3 (denoted as X). The unknown function is approximated by m regression trees of structure T with terminal node parameters (leaves) L:Footnote 16
The advantages to using this methodology is that it allows for model free variable selection (each variable can be assessed in terms of its predictive importance), no assumptions about functional form and the ability to incorporate heterogeneous, interactive, and additive effects. For the description of noble longevity across one thousand years and ten million square kilometers, the choice of this approach seems appropriate.Footnote 17
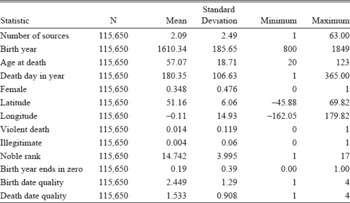
Table 3 presents the summary statistics for the empirical analysis conducted in the next section. The mean observation in the sample is linked to two sources and was born half way through the year in 1610 and dies at age 57. The average longitude and latitude is a field 30 miles directly south of London. The sample is 65 percent male.
RESULTS
Dance of Death
Recent estimates of the lethality of the Black Death suggest a toll of 50 million, or about 60 percent of Europe's population (Benedictow Reference Benedictow2004, p. 383). Emerging from the East in 1346, plague remained in Europe until at least 1815.Footnote 18 Despite the vast difference in death rates between the Black Death and modern outbreaks of bubonic plague, genetic and molecular testing has revealed that the cause of both is the bacillus Yersinia Pestis (Raoult et al. Reference Raoult, Gérard and Eric2000; Haensch et al. Reference Haensch and Raffaella2010; Schuenemann et al. Reference Schuenemann, Kirsten and Sharon2011).
Table 3 SUMMARY STATISTICS
Source: Noble sample.
figure 3 plots the simple mortality index described by equation 1 from 1200–1800. The plague years are immediately obvious. There are no years in the thirteenth century where Mt , mortality expressed relative to an average of mortality five years before and after a given year, exceeds two. After the arrival of the Black Death, there are eight years when the number of deaths is more than double what we would expect: 1349, 1361, 1369, 1415, 1513, 1563, 1603, and 1625 and five years when Mt is more than 1.5: 1375, 1471, 1540, 1593, and 1665.Footnote 19 Each year, apart from 1415, correspond to well-known plague episodes (Biraben Reference Biraben1975).Footnote 20 The battle of Agincourt took place in October 1415.
The results suggest that plague mortality was lower for the elites—at least compared to existing studies on urban populations. Testaments were 21 times normal in urban Tuscany and Umbria in 1438, burials were almost 30 times normal in Siena during the plague year of 1363 (Cohn Reference Cohn2002, pp. 201–2). The highest levels of crisis mortality in Figure 3 are significantly below those for seventeenth century London, where plague mortality has recently been measured at 5–6 times normal mortality but never killed more than 20–25 percent of the city's population (Cummins, Kelly, and Ó Gráda Reference Cummins, Morgan and Cormac2016).Footnote 21 Further, the simple mortality index suggests that plague mortality was consistent from the Black Death until its disappearance; shocking mortality to between 1.5 to 2 times normal for this elite section of Europe's population.Footnote 22 Nobles had the means and the resources to flee cities when plague broke out.Footnote 23 Indeed no English royal died from plague after 1500 (Johansson Reference Johansson2010, p. 24). However, this pattern can only represent a lower bound, because where complete lineages were wiped out, they would be less likely to survive into family trees compiled centuries later.

Figure 3 NOBLE INDEX OF MORTALITY, 1200–1800
In Figure 4, I report the frequency of month of death for those records where the month of death is recorded (data quality codes 1 and 2). The impact of the global plague pandemic, starting with the Black Death in Reference Benedictow1346 is again evident from the changing seasonality of deaths. In particular, the 1300s have a distinctive summer peak. Over time, the trend is for a disappearance of this summer peak.

Figure 4 SEASONALITY OF NOBLE DEATHS, BY CENTURY
A stylized fact of the Black Death was its indiscriminate nature. Samuel Cohn (Reference Cohn2002) quotes the chronicler of Cologne, the monk Albert:
there was no disparity in sex or age, taking men, women, the old, the young, plebs and nobles, paupers, the rich and powerful, priests and the laity (p. 213)
The family tree data used here suggest otherwise: Black Death noble mortality was mild relative to that estimated for the rest of the population. Yet, how could plague discriminate within the noble family tree data? Using the distinctive summer peak of plague deaths and the fact that the plague years are well known, a dummy variable (DPlague ) was coded for death during a plague period (June–September) in any one of the plague years listed earlier. A logistic regression was run of the form:
where the notation is as equation 2. The data is restricted to the boundaries of the significant plague years recorded in the data, 1346– 1666. Further, the model is run twice; once including a control for a violent death and once for those deaths that were not violent.
The results are detailed in Table 4. There are no consistent geographic or noble rank effects. The Black Death and subsequent plagues were discriminately indiscriminate. Surprisingly, it appears that noble women faced an increased probability of a plague death. The result is significant and large in all model formulations. The lowest estimated effect in model two suggest that noble women faced an odds ratio of 1.16 relative to noble men for the risk of dying in one of the major plague seasons.Footnote 24 The misattribution of some violent deaths at Agincourt in 1415 to plague could only be expected to bias the analysis against this result. The regression also indicates that older people were more likely to die during the summer plague season.

Figure 5 PROPORTION OF NOBLE MALE DEATHS FROM BATTLE
Table 4 LOGISTIC REGRESSION ON NOBLE PLAGUE DEATHS, 1346–1666

Note: * p<0.1; ** p<0.05; *** p<0.01
Source: Noble sample.
A History of Violence
European nobility specialized in the execution of violence. We can expect that a large proportion, especially of the men, died in battle. But can we know if an individual in the data dies from violence in this way? Where the individual has a specific date of death (an exact day), we can link that date to a list of all known battles in European history. However, many battles have been lost from history's memory. The genealogical records of noble deaths themselves may be the only remnant of forgotten skirmishes.
figure 5 reports the time-path of an index of violent deaths, calculated using the algorithm described in the previous section, averaged over family tree and death half century.Footnote 25
A useful, endogenous test of this procedure is to examine the “violent” deaths by sex. The assignment algorithm does well because I find that women were far less likely to die in battle. Female violent deaths are much lower than male violent deaths and exhibit no trend over time. However, they are also non-zero. Footnote 26 In order to examine the determinants of a violent death from battle and to calculate a controlled time trend I run a logistic regression of the form:
Table 5 DETERMINANTS OF A VIOLENT BATTLE DEATH, LOGISTIC REGRESSION

Note: * p<0.1; ** p<0.05; *** p<0.01
Source: Noble sample.
where the notation is as equation 2 and DYR is the year of death. In Table 5, I report the determinants of a violent death for those who have an exact death date.Footnote 27 Being a female and time reduce significantly the chances of a violent death. Latitude but not longitude matters too. A violent battle death is more probable the further North a noble originates. Figure 6 describes the time path of predicted violent battle deaths; there is a sharp decline from 1500 to 1600. The trend corresponds closely to that reported by Thomas Hollingsworth (Reference Hollingsworth1957, p. 8) for the English Ducal families.
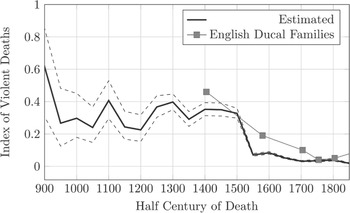
Figure 6 THE TIME TREND OF NOBLE MALE VIOLENT DEATHS, FROM THE LOGISTIC REGRESSION
A confounding factor in calculating violent deaths in this way is the sudden return of plague to Europe in the fourteenth century. However, the principal result that violent deaths from battle decline for the nobility is robust, as this occurs during exactly the period when we would expect the wave of plagues to bias this violent death index upwards.
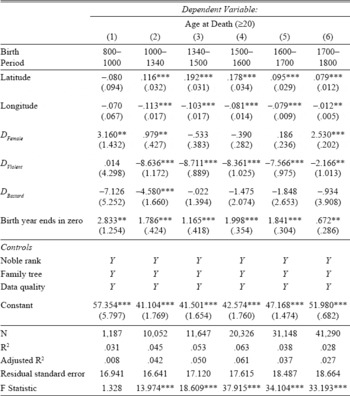
Trends in Lifespan over Time
In Table 6 I report the results of an OLS regression of equation 2 on the noble sample.Footnote 28 As a verification of the violent battle death calculation in the previous section, the coefficient on DViolent has a strong negative effect of about seven years. Geography matters too, with a strong effect of latitude and longitude on noble adult age at death in both models. The coefficients suggest a significant positive effect on years lived for nobles from Northwest Europe.
Table 6 OLS REGRESSION OF NOBLE ADULT AGE AT DEATH

Note: * p<0.1; ** p<0.05; *** p<0.01
Source: Noble sample.
Crucially all the data quality variables matter both in term of their economic and statistical significance but also in their effect on the other variables in the regression. The positive effect of having a birth year end in zero is possibly a result of downward assignment of unknown birth years to the known decade of birth, someone born in 1216 was perhaps more likely to be assigned to born c.1210 than to c.1220. Any time trend conclusions must account for this resulting positive upward bias in the age at death for those with birth years ending in zero.
The noble rank effects from the regression in Table 6 are shown in Figure 7. Individuals with a noble suffix are more likely to die older (almost 4 years older for ranks 7, 9, 10–13, 15, and 16). Unsurprisingly, those with a military suffix (rank 14) die younger (although the standard errors here are large). I also find that Emperors and Kings die around two to three years younger than non-nobles.
Figure 8(a) reports the expected noble adult age at death for each 50-year birth period from 800 to 1800. The 95 percent confidence intervals are too wide to allow over-interpretation of any trends in noble longevity before 1400 but from 1350 to 1500 there does appear to be a sudden and sharp uptick in noble longevity, from a mean of around 50 to 55. From 1500, predicted lifespan declines until around 1650 where an uninterrupted rise begins. At the same time, noble lifespan exhibits significant oscillations across the millennium 800–1800.
This estimate of adult noble lifespan “dummies” out the effect of a violent battle death. To incorporate the contribution of the decline in violent battle deaths (Figure 6) to noble longevity, I use the predicted age at death, for men, from equation 2 and set DViolent to 0 and to 1. This allows us to bound predicted longevity between two extremes, everyone dying in battle and no one dying in battle. These bounds are reported in Figure 8(b), with the difference between the two series being equal to the coefficient of DViolent from Table 6, 7.2 years. Next I calculate what average age at death would be without any decline in violence, a pre-decline average of 32 percent of deaths from battle. This can be compared to the average age at death calculated in the same way but now using the observed proportion of men dying from violence, as is done in Figure 8(b). The decline of battle violence is responsible for an extra two years of average elite adult male lifespan after 1500. It is not however driving the uptick in noble longevity around 1400 nor around 1650. Some other set of factors must be responsible for these two breaks.

Figure 7 NOBLE OCCUPATIONAL HAZARDS
Table 6 reported a large and significant positive effect of birth-year heaping on elite adult longevity which could be confounding the estimates presented here. Two considerations suggest that this is not the case. Firstly, individuals with birth years ending in zero are directly observed and this effect is controlled for in the regression. However, a simple categorical variable could fail to capture changes over time in this effect. For the purposes of the time-trends estimated, this means that we are likely over-estimating longevity earlier, by failing to fully control for the over-attribution of individuals to “zero” years. The bias this imparts is against the trends presented meaning that increases in longevity after 1400 and 1650 are potentially even larger than estimated.

Figure 8 EXPECTED LIFESPAN, 800–1800

Figure 9 HEAT-MAPS OF MEDIAN ADULT NOBLE AGE AT DEATH
Trends in Adult Noble Lifespan across Space and Time
The geographic composition of the sample is heavily skewed towards Northwest Europe, France, and England. However, there are large numbers of nobles from Southern and Eastern Europe. The results from Table 6 suggest that geography had large and significant effects on adult noble lifespan. Figure 9 plots heat-maps of median lifespan (over age 20) by geographic coordinates. The pattern is easiest to detect in panel (b) where the median is calculated over integer longitude and latitude coordinates. Length of noble life follows a strong South-North, East-West gradient with nobles in the Northwest living longer lives than those in the Southeast.
Table 7 ESTIMATING ADULT NOBLE AGE AT DEATH BY SUB PERIODS
Note: * p<0.1; ** p<0.05; *** p<0.01
Source: Noble sample.
To examine whether this geographic “effect” is constant over time, I estimate equation 2 by sub-period. See Table 7. The standard errors on latitude and longitude are too large for us to be sure of any real “effect” before the first millennium but the coefficient estimates are suggestive. Geography matters quantitatively and statistically in all periods after 1000. The effects are strongest in the 1340–1500 period. It is notable that even in the pre-Black Death era this correlation is present. Whilst the compositional bias of the sample and its elite nature rule out conclusive findings on this geographic “effect,” the observed correlations are interesting and unexpected.

Figure 10 CONTROLLED GEOGRAPHIC EFFECTS ON NOBLE ADULT LIFESPAN
To determine how large these geographic “effects” are I estimated equation 3 (allowing dummy values for each integer value of longitude and latitude in the data). This fully controlled “effect” of geography, along with 95 percent confidence intervals is reported in Figure 10. The “effect” is broadly linear. However, the confidence intervals are a lot tighter along South-North axis than East-West. The size of the “effects” are large—from around two years (along latitude) and roughly four years (along longitude).
As the sample is heavily weighted towards Northwest Europe, it is possible that this geographic “effect” is a result of Northwestern elites dying on the frontier in forgotten battles. As a test, I re-estimate Table 7 but this time use latitude and longitude of birth only (this is reported in the Online Appendix). The scale and direction of these coefficients reinforce the pattern described for the earlier centuries. However, the latitude effects after 1700 are no longer statistically significant. Despite this, it is clear that pre 1700, and for all periods for longitude, there are historic geographic contours to European elite mortality that are not explicable through violence or death on the frontier.

Figure 11 BART MACHINE ANNUAL PREDICTIONS FOR ADULT NOBLE LONGEVITY, BY REGION (SAMPLE AVG. AND 1–3)
Time Trends in Adult Noble Lifespan by Region
Finally, I ask if there are different time-trends in noble lifespan in different regions of Europe. A BART model is estimated based on equation 4. Figures 11 and 12 report predictions of adult noble lifespan for each of the seven European regions from Table 1.Footnote 29 Predicted lifespan is stationary everywhere before 1400 where, just as with the OLS estimates (see Figure 8), lifespan suddenly rises. There is heterogeneity within Europe after 1400; in Scotland, Ireland, and England and Wales, adult lifespan rises from under 50 to almost 55. In Central, Southern, and Eastern Europe the post-1400 rise is present too but from a lower base: about 46 to just over 50 years. As a trend, the post-1400 rise in elite lifespan appears to be a European-wide occurrence. Everywhere in Europe, the modern sustained increase of longevity originates around 1650 for European nobility. The impact of the Thirty Years War is evident in Figure 12. The two time-series estimation strategies—OLS and BART—agree on the path of European elite longevity between 800 and 1800.
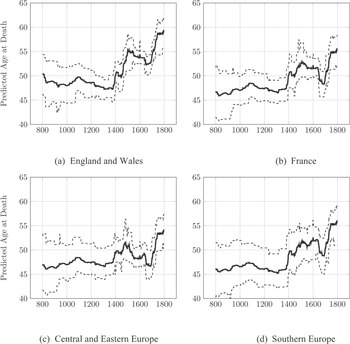
Figure 12 BART MACHINE ANNUAL PREDICTIONS FOR ADULT NOBLE LONGEVITY, BY REGION (4–7)
DISCUSSION
This study has characterized adult noble lifespans from 800 to 1800. The consistent and large association uncovered between sex and plague mortality for nobles runs counter to the indiscriminate reputation of the Black Death and counter to recent paleodemographic analysis on skeletons from fourteenth century London (DeWitte Reference Dewitte2009).Footnote 30 If plague killed more women than men, a simple supply-side effect increasing female agency in the marriage market could explain the origin of the European Marriage Pattern (Hajnal Reference Hajnal, Eversley and Glass1965; De Moor and Van Zanden Reference David, S. Ryan and Andrea2010; Voigtländer and Voth Reference Voigtländer and Hans-Joachim2013). Of course this is a premature speculation, the patterns reported here would have to be convincingly established for the population at large.
The sharp decline in the proportion of male nobles dying from battle, from over 600 years of a steady 30 percent, to less than 5 percent in the sixteenth century, predates the arrival of the Industrial Revolution by two centuries. The long-run decline in violence is cited as one of the principal correlates of the emergence of the modern World with the “civilizing process” needing the transformation of warrior nobles into gentleman courtiers (Elias Reference Elias1982).Footnote 31
One can perhaps ask why did battlefield violence decline among European nobility. Nobility certainly did not lose its taste for military life. The Wars of Religion following 1500 were aristocratic feuds at least as much as earlier wars.Footnote 32 However, the decline in battlefield death amongst nobles corresponds to the emergence of modern warfare; artillery, standing armies, and the replacement of privilege with merit.Footnote 33 The power of hereditary warrior status declined in battle as modern and larger standing armies, led by increasingly wealthy princes, focused upon artillery and infantry (Keen Reference Keen1984, pp. 1, 238–53). The decline of cavalry meant that nobility became officers, inherently a more administrative role than before (Keen Reference Keen1984, p. 240). In war, nobility still led, but from the safety of the rear guard, not the front lines.Footnote 34
I estimate the time-trend of adult noble lifespan over the millennium between 800 and 1800. The findings on the timing of the modern rise in age at death agree almost exactly with de la Croix and Licandro (Reference De and Omar2012) (the birth cohort of 1640–1649). The nobility are, in general, forerunners of Europe's mortality transition as David, Johansson, and Pozzi (Reference David, S. Ryan and Andrea2010, figs. 3(a) and 3(b), p. 28) argue too.Footnote 35 This may provide a clue for those who seek to explain why mortality declined. There could be an important role for individual behavior and a demonstration effect (e.g., hygiene and other behavioral traits) as this rise predates modern medicine or any public health measures. It also predates the Industrial Revolution.Footnote 36 Whilst modern evidence suggests that life expectancy does not matter for economic growth (Acemoglu and Johnson Reference Acemoglu and Simon2007), the case has not been proven for the preindustrial era.
Unlike de la Croix and Licandro (Reference De and Omar2012), this study argues that lifespan was not a stationary trend before 1650. There are significant oscillations, most importantly the sharp Europe-wide rise in noble lifespan after 1400. The rise is stronger over the 1400–1600 interval in Ireland, Scotland, and in particular, England and Wales (Figures 11 and 12). This pattern has remained hidden. Only long and deep time series of at least a millennium in length could uncover it. For England, this result can be directly compared with existing estimates of adult mortality. The dramatic rise from the fourteenth to the fifteenth and sixteenth centuries revealed in Figure 12(a) is in broad accordance with Russell's estimates of life expectancy at age 25 (e25) for tenants-in-chief of the crown from the Inquisitions Post Mortem (Smith Reference Poos, Jim, Richard and Hicks2012, Figure 10, p. 79). However, recent re-estimates of e25 for these same data (Poos, Oeppen, and Smith Reference Poos, Jim, Richard and Hicks2012) suggest a much higher level and a flat trend, at about 30 years, during the fourteenth century. Monastic evidence from communities in Durham, Canterbury, and Westminster points to a decline in e25 from 1450 to 1500 (Poos, Oeppen, and Smith Reference Poos, Jim, Richard and Hicks2012, Figure 8.2, p. 162). This is not the pattern I find. Figure 12(a) reports the opposite trend for the English elite: a sharply rising trend in predicted average age at death, for those dying over 20, from 1450–1500. The evidence I have assembled and analyzed in this article strongly suggests a strong improvement in lifespan in the fifteenth century for the English elite.
No conclusions can be drawn as to why adult noble lifespan increased so much after 1400. No known medical innovations in Europe before 1500 could be responsible.Footnote 37 Nutrition, in terms of calories consumed, also cannot explain this rise. These elites could be expected to have always filled their bellies. For this reason, those who argue that the “modern rise of population” was a result of nutrition, the equality of aristocratic and peasant lifespans in the past has presented a paradox (see Fogel (Reference Fogel, Engerman and Gallman1986, pp. 480–84) and McKeown (Reference McKeown1976, pp. 139–42)). Robert Fogel attributed this “peerage paradox” to the vast quantities of alcohol the English elite consumed (Reference Fogel, Engerman and Gallman1986, p. 483). Perhaps diet changed in other ways. The late fourteenth century did witness an increase in the proportion of manuscripts on health.Footnote 38 Works such as the Tacuinum Sanitatis, incorporating Arabic and Ancient knowledge, recommended moderation in food and alcohol, adequate rest, and exercise and, similar to modern medicine, emphasized the importance of vegetables and fruit to human health (Janick, Daunay, and Paris Reference Janick, Marie and Harry2010). Of course, the actual effect of these manuscripts is speculation at this point.
The rise in elite adult age at death for those born after 1400 could also be the result of a Darwinian selection effect from the half century of recurring plague that returned in 1347. Plague killed those susceptible to plague but would also have purged the population of other frailties that may have been correlated with plague susceptibility.Footnote 39 However, most people, even during the plague era, died from other causes.Footnote 40 The real long-term demographic effect of the Black Death could have been through its effect on the disease climate. Noble lifespan in Figure 8 corresponds closely to the trend in real wages in England (Clark Reference Clark2005, fig. 4, p. 1311)Footnote 41 and to recent estimates of gross domestic product (GDP) per capita (Broadberry et al. Reference Broadberry, Bruce and Alexander2015, p. 206). Improved nutrition amongst the general population, from higher real incomes via Malthusian dynamics, could have led to a reduction in the incidence of other infectious diseases among plague survivors and their offspring.Footnote 42 Nutritional status did little to diminish plague lethality (see Fogel Reference Fogel, Engerman and Gallman1986, table 9.11, p. 481) but together with a “purging” effect, the Black Death could have led to an improved climate against infectious disease, especially in cities.
The cause of the 1400 rise in adult noble lifespan is unknown. Presently only speculations can be made. Future empirical work, perhaps linking estate account books (to reconstruct diet) to specific time and location (rural/urban) effects and genealogies of the kind analyzed here, will have great potential to answer this mystery.
This article documents a geographic pattern to European elite lifespans. The mortality gradient runs South-North and East-West, and has existed since before the Black Death. The long existence of such a geographic “effect,” and the factors which are causing it, may have implications for recent work which stresses the “little divergence” between the Northwest Europe and the Southeast (Voigtländer and Voth Reference Voigtländer and Hans-Joachim2013; Broadberry Reference Broadberry2013; de Pleijt and van Zanden Reference Acemoglu and Simon2013). The Black Death is not the first turning point. There was something about the Northwest Europe long before 1346 that led to nobles living longer lives.


