


INTRODUCTION
Deforestation and degradation of forests exacerbates climate change accounting for 10%–15% of global carbon dioxide emissions (Asner et al. Reference Asner, Powell, Mascaro, Knapp, Clark, Jacobson and Kennedy-Bowdoin2010). Indigenous populations, while only 5% of the global population, manage a quarter of earth’s land surface and support 80% of its biodiversity, including forests (Garnett et al. Reference Garnett, Burgess, Fa, Fernández-Llamazares, Molnár, Robinson and Watson2018). They also depend on forests for their livelihoods—in just India, Indonesia, Nepal, the Philippines, Sri Lanka, and Thailand about 447 million poor and marginalized individuals depend on forests (Lynch and Talbott Reference Lynch and Talbott1995). As such, policy designers should balance marginalized populations’ economic livelihoods in these areas with the need to guarantee renewable resources like forests for future generations.
This article examines an institution that is explicitly designed to take an umbrella approach to the dual policy problems of improving development outcomes for marginalized and poor communities living in proximity to natural resources, with the conservation of those very resources. We examine elected bodies under whose aegis lie both the protection and use of forest resources, as well as the implementation of large-scale government programs. We use the rollout of these institutions to study their effects on forest cover and deforestation using a difference-in-differences design.
Theoretically, it is unclear whether increasing representation for marginalized local communities will increase environmental resources extraction or conservation. While work since Ostrom (Reference Ostrom1990) argues environmental governance may be quite effective with local control, evidence from a variety of contexts has been mixed. We argue that the mixed effects of democratic decentralization in the literature may be driven by institutional arrangements that provide authority to local decision makers, but do not make adequate arrangements to truly boost the voice of marginalized communities in resource management.
We examine the case of India, a critical context to study the effects of political representation on deforestation. Of India’s total population, $ 66 $
% live in rural areas and 275-million individuals depend on the use of forest resources (Choudhury Reference Choudhury2019). A further one hundred million are associated with the Scheduled Tribe (ST) identity category, grouping representing, on average, India’s most economically vulnerable and politically excluded, who live in, and near, heavily forested areas. ST have similarities to the many indigenous communities around the world who rely on forest produce to meet their caloric intake, sell minor forest products to earn a livelihood, and practice sustainable agriculture (Kashwan Reference Kashwan2017; Zimmerman et al. Reference Zimmerman, Peres, Malcolm and Turner2001).
$ 66 $
% live in rural areas and 275-million individuals depend on the use of forest resources (Choudhury Reference Choudhury2019). A further one hundred million are associated with the Scheduled Tribe (ST) identity category, grouping representing, on average, India’s most economically vulnerable and politically excluded, who live in, and near, heavily forested areas. ST have similarities to the many indigenous communities around the world who rely on forest produce to meet their caloric intake, sell minor forest products to earn a livelihood, and practice sustainable agriculture (Kashwan Reference Kashwan2017; Zimmerman et al. Reference Zimmerman, Peres, Malcolm and Turner2001).
In the Fifth Schedule of the Constitution, the post-Independence Government of India declared certain regions as “Scheduled Areas,” a territorial designation linked to the customary rights of the ST. In 1996, India’s parliament passed the Panchayat Extension to Scheduled Areas Act (PESA), extending local government councils to Scheduled Areas. PESA also introduced an electoral quota that requires all chairperson positions, as well as at least half the seats on each local government councils to be reserved for ST individuals. In other, non-Scheduled Areas of India, local government had already been formalized under the 73rd Amendment in 1992 (Panchayat Raj Act), but without the same systematic mandated representation for ST. We study the impact of increased political representation through the arrival of local government, and mandated representation for ST, on deforestation.
Estimating the causal effects of political institutions on forest outcomes is difficult. First, political institutions are usually implemented simultaneously over large administrative units (e.g., an entire country). Second, when not implemented everywhere, institutions are introduced in areas that are unique. Both of these issues create problems for the construction of suitable counterfactuals, making the attribution of resulting effects to the institution difficult—first because of an absence of a contemporaneous counterfactual, and second because potential outcomes in counterfactual may be trending differently over time. The increase in representation for ST under PESA, in already established Scheduled Areas, presents a unique opportunity to study the impact of increased representation on forest outcomes. We use the staggered adoption of PESA institutions across states, and within-state variation in Scheduled Areas versus non-Scheduled Areas, in a difference-in-differences framework that enables us to isolate the causal effect of ST-mandated representation on forest outcomes.
In addition to the challenge of causal identification, until recently social scientists have been unable to study systematic local changes in forest outcomes over large areas, and over long periods of time. While early work, such as sections of seminal books like Ostrom (Reference Ostrom1990), made use of detailed case studies and fieldwork in small communities, political scientists have seldom used novel remote-sensing microdata that have recently become available from satellites such as LANDSAT, Sentinel, and DMSP. We introduce the use of two such datasets—the MEaSURES Vegetation Continuous Fields (henceforth VCF) dataset available for 1982–2016 (Song et al. Reference Song, Hansen, Stehman, Potapov, Tyukavina, Vermote and Townshend2018) and the Global Forest Cover (henceforth GFC) dataset available for 2001–17 (Hansen et al. Reference Hansen, Potapov, Moore, Hancher, Turubanova, Tyukavina and Thau2013)—and advocate for greater use in political science of such large-scale, high-throughput datasets produced by environmental scientists and geographers.
Our main finding is that boosting formal representation for ST led to an average increase of tree canopy by 3% per year as well as a reduction in the rate of deforestation.Footnote 1 The effects are larger for areas that had more forest cover at the start of the study period. We further show that our observed effects arise only after the introduction of PESA elections that mandate quotas for ST. Finally, we show that these results are robust to alternative estimators, e.g. panel match (Imai, Kim, and Wang Reference Imai, Kim and Wang2023) and interactive fixed effects models, as well as placebo exercises.
Next, we compare the impacts of PESA legislation with other legal reforms that institute some, but not all, elements of PESA. First, we leverage the staggered rollout of local government across non-Scheduled Areas, with the introduction of Panchayati Raj Institutions from 1993, to show that the presence of local government by itself, absent mandated representation for the ST, had no conservation effects. Second, we show that the implementation of the Scheduled Tribes and Other Traditional Forest Dwellers (Recognition of Forest Rights) Act, 2006 (or Forest Rights Act [FRA])—which was intended to bolster ST rights to forest lands—had no discernible additional impacts beyond those caused by PESA. Overall, we show that neither local representation, nor the legal provision of forest rights, are sufficient—only with a boost in ST communities’ political power do we see an increase in forest conservation.
We also discuss evidence on two mechanisms that link how ST representation leads to lower deforestation: we present qualitative and quantitative evidence to suggest that, under PESA, ST are able to better pursue their economic interests which in turn leads to better forest conservation, a mechanism we call forest stewardship. By gaining political power, ST are able to thwart timber and other industrial interests, pursue their own collection and sale of non-timber forest products, and in so doing improve the overall health of forests.
Additionally, we find support for a mechanism of opposing mining interests, where the increase to ST representation enables ST communities to resist mining and other large-scale commercial operations. First, we find that areas that are close to mines, prior to the implementation of PESA, experienced high rates of deforestation. Second, we find that the introduction of PESA elections leads to a greater reduction in deforestation for PESA villages close to mines. Third, using new data from Land Conflict Watch (2022), we present causal evidence that the introduction of PESA increased the incidence of conflict around mining. Taken together, these results suggest that the primary channel of change is organized protests against large-scale mining operations.
This article makes theoretical, empirical, and policy contributions. Theoretically, we argue that decentralization policies are rarely accompanied by institutions that truly create space for marginalized voices, one reason for the mixed results in the study of how local control affects natural resources. We make the case for scholars to examine mandated representation—an institution in over one hundred countries—and an institution that can significantly bolster the power of marginalized communities. Additionally, we argue that vesting power in what we call “umbrella institutions,” such as, inclusive multi-purpose village councils, rather than more targeted community resource management institutions, can better address the dual policy challenges of forest management and development, in tandem. To make this case, we place this article’s findings in conversation with recent research that examines the same policies, but focuses instead on economic outcomes. Gulzar, Haas, and Pasquale (Reference Gulzar, Haas and Pasquale2020) find that the improvement in representation for ST, in the same context, led to (1) large increases in the economic welfare for ST as measured by the performance of the world’s largest workfare program, (2) improvement in local road connectivity, and (3) general improvements in the provision of public goods.
Empirically, we pair a longitudinal, causal quasi-experimental research design with new high-resolution data on deforestation and forest stock. Most existing research studying policies on environmental outcomes relies on either cross-sectional variation or before–after comparisons, both of which struggle to credibly identify causal effects. By leveraging a unique policy and its rollout, we provide credible evidence of how improved political representation for marginalized communities reduced natural resource extraction. In doing so, we contribute to a small but emerging literature that pairs environmental datasets with causal research designs to study the effects of public policy on environmental outcomes (Baragwanath and Bayi Reference Baragwanath and Bayi2020; Ferraro and Simorangkir Reference Ferraro and Simorangkir2020; Sanford Reference Sanford2023).
From a policy perspective, the article presents evidence that conservation and the social protection of marginalized populations need not be substitutes, an argument advanced in recent research (Ribot Reference Ribot2004). Our evidence from rural India suggests that the two policy objectives may indeed be complementary, and potentially addressed by the same institution. In this sense, we advocate greater attention be paid to umbrella political institutions that include in their design concerns of both development and conservation. This may be particularly urgent as recent policy changes in India suggest that there are likely to be large rollbacks of the rights of local village communities such as the ones we study in this article.Footnote 2
REPRESENTATION AND RESOURCE CONSERVATION
Ostrom (Reference Ostrom1990) famously argued that common pool resources could be governed effectively by local communities, rather than central governments or private companies. Since, researchers have examined various ways in which common pool resources can be most effectively governed and managed at the local level, paying particular attention to particular design principles under which community-based conservation can be bolstered to circumvent the tragedy of the commons (Cox, Arnold, and Villamayor Tomás Reference Cox, Arnold and Villamayor Tomás2010). A key message from these studies is that local control of common pool resources can work through the internalization of social norms toward sustainable use (Agrawal and Gibson Reference Agrawal and Gibson1999; Lemos and Agrawal Reference Lemos and Agrawal2006; Sethi and Somanathan Reference Sethi and Somanathan1996). The focus of these studies is on local mechanisms for resolving collective action problems. For instance, a recent collection of randomized experiments show how citizen monitoring—one of the principles highlighted by Ostrom—can improve the management of common pool resources (Anderson et al. Reference Anderson, Buntaine, Liu and Zhang2019; Slough et al. Reference Slough, Rubenson, Levy, Rodriguez, del Carpio, Buntaine and Christensen2021).
Local Government and Forest Conservation
In focusing on conditions conducive to collective action, this literature on community-based conservation has paid less attention to the formal institutional prerequisites that ensure that marginalized individuals have adequate power to mobilize around their interests. Aware of this gap, recent work has begun examining the institutional dynamics of common pool resource management around the world (for reviews, see Ribot [Reference Ribot2004]; Larson and Soto [Reference Larson and Soto2008]). We argue that local formally elected governments with mandated representation for marginalized communities are a set of institutions that theoretically and practically possess the key characteristics for the effective management of forests.
Which institutional features might be conducive to forest conservation? Theories of common pool resource management have examined institutions set up by means of democratic decentralization. Unlike administrative decentralization, democratic decentralization “refers to representative and downwardly accountable local actors who have autonomous, discretionary decision-making spheres, with the power and resources to make significant decisions pertaining to local people’s lives” (Larson and Soto Reference Larson and Soto2008, 216). While the idea of democratic decentralization seemed quite promising, researchers examining the effects of various institutional protections to local, indigenous communities on deforestation outcomes, have found positive, negative, and null effects.Footnote 3
The Role of Mandated Representation
We suggest that the mixed effects of democratic decentralization in the literature may be driven by institutional arrangements that provide authority to local decision-makers but do not make adequate arrangements to truly boost the voice of marginalized communities in resource management. This sentiment is echoed in reviews of the literature that question if democratic decentralization sufficiently challenged status-quo power relationships it was designed to disrupt (Agarwal Reference Agarwal2001). For instance, synthesizing evidence and theoretical insights from a large number of case studies, Ribot (Reference Ribot2004, 1) argues:
IF institutional arrangements include local authorities who represent and are accountable to the local population and who hold discretionary powers over public resources, THEN the decisions they make will lead to more efficient and equitable outcomes than if central authorities made those decisions.
In practice, however, these conditions are rarely met, and there are reasons to believe that democratic decentralization that gives authority to local elites likely exacerbates the problem (Bardhan and Mookherjee Reference Bardhan and Mookherjee2000).Footnote 4 Larson and Soto (Reference Larson and Soto2008) ask: if democratic decentralization “is not aimed at transforming the underlying structures of marginalization and inequity, what kind of democracy is democratic decentralization promoting?” (215).
Our first theoretical contribution to this literature is to propose that mandated political representation for marginalized populations is a potential institutional mechanism that can yield improvements in conservation efforts because it can ensure that marginal people have adequate power to mobilize around their interests. Why is mandated representation a promising institutional mechanism? Fox (Reference Fox2015) writes that “institutional change strategies that promote both ‘voice’ and ‘teeth”’ are the ones that are most likely to succeed (346). Assuming that “teeth” are already provided through specific local government reforms (which is indeed the case in our context as we describe below), our focus here is on how mandated representation can resolve impediments to the successful channeling of “voice.” Quotas that reserve electoral positions for marginalized populations resolve accountability impediments to the successful implementation of democratic decentralization. Ribot (Reference Ribot2004, Appendix C, 109), presents a list of accountability mechanisms that emerge from the literature, including independent third-party monitoring and transparency. A missing mechanism in the literature is institutional reforms that create space for marginalized populations in local governments. Mandated representation achieves this by giving a formal, downwardly accountable voice to members of marginalized communities in local elected bodies.
However, improved representation is only likely to work when local communities’ interests are aligned with resource conservation. Scholars argue that “empowering pro-climate constituencies across countries” holds great promise in solving problems related to climate change (Aklin and Mildenberger Reference Aklin and Mildenberger2020, 6). The literature calls these forces “demand from below” (Conyers Reference Conyers1983; Larson and Soto Reference Larson and Soto2008) and theorizes that they are key components of a successful local institution. In this sense, mandated representation can provide the key “mediating factor” (Ribot Reference Ribot2004, 23) that bolsters democratic decentralization—an institutional vehicle that effectively delivers the voices of marginalized populations to accountable local authorities.
Representation as an “Umbrella Institution”
While the social welfare and economic development of marginalized communities and conservation of forests were often thought of as two policy objectives in tension, recent work has challenged this notion. Scholars argue that the conservation of natural resources, and securing the economic welfare of marginalized populations, may in fact be complementary policy objectives (Manor Reference Manor2004; Ribot Reference Ribot2003; Reference Ribot2004).
Policymakers and scholars both tend to propose piecemeal institutional solutions for each policy objective. There are two potential problems with this approach. First, an institution designed to improve only conservation (or only development) may have deleterious effects on the other policy objective. Second, setting up separate institutions for each policy objective may create a negative feedback loop, whereby an institution from one body inhibits the work of the other. For example, many studies examine the impact of forest user groups on forest conservation. Recent critiques of this work suggest that designated forest user groups may undermine the authority of formal representative institutions, and in so doing, fragment public authority (Becker Reference Becker2001; Larson and Soto Reference Larson and Soto2008; Manor Reference Manor2004; Toni Reference Toni2006).
A second theoretical contribution of this study is to suggest that vesting powers in a single umbrella institution—for instance, a political institution that empowers marginalized voices—has the potential to overcome these problems. First, a single institution will be better at recognizing how to balance the dual policy objectives of development and conservation. Second, a single institution can consolidate power into a more substantive and meaningful democratic authority. When these conditions are met, balancing objectives and consolidated power, we may expect improvements in both environmental conservation and other state services. Since umbrella institutions—in our case, elected village councils with a multi-faceted policy mandate—already exist in over one hundred countries, we argue that there is great promise in their efficacy in promoting joint policy objectives.
CONTEXT: IDENTITY, REPRESENTATION, AND FORESTS IN INDIA
Scheduled Tribes and Scheduled Areas
India’s ST refer to individuals that fall under a legal category that groups individuals frequently referred to, in India, as “tribals,” or adivasi—which is often translated to “original inhabitants.” The ST category was built upon the British authorities’ earlier lists of “Aboriginal Tribes” and “Semi-Hinduised Aboriginal Tribes” in the Census of 1872 (Corbridge Reference Corbridge2002, 64) and introduced special institutions based on this census with the Scheduled Districts Act of 1874.Footnote 5 Following Independence in 1947, the new Indian state identified in the Fifth Schedule of the Constitution its own “Scheduled Areas,” with few differences from the British Scheduled Districts Act. The government justified Scheduled Areas specifically as a means to improve representation and welfare for ST. Despite this rationale, ST continue to experience India’s highest rates of poverty and child mortality (World Bank 2011). To explain these patterns, researchers point to government and industrial-led forced displacement of ST and their concentration in rural areas (Guha Reference Guha2000; Sundar Reference Sundar2007; World Bank 2011).
The geographic boundaries of areas the Scheduled Areas have changed relatively little over time.Footnote 6 Today, Fifth Scheduled Areas cover parts of nine Indian states—Andhra Pradesh, Chhattisgarh, Gujarat, Himachal Pradesh, Jharkhand, Maharashtra, Madhya Pradesh, Odisha, and Rajasthan. Figure 1 presents our coding of the geographic extent of Scheduled Areas within these states. Scheduled Areas represent 41% of the territory within these states,Footnote 7 and per the 2011 Indian Census, ST total 104-million persons, or 8.6% of India’s population.
Scheduled Areas in States Covered by the Fifth Schedule of the Indian Constitution

ST and Forests in India
Consider this excerpt, written by an adivasi rights activist, describing ST in Jharkhand:Footnote 8
Jharkhand is a tribal state. The tribal community of Jharkhand has a special history of clearing the forests and bushes, then setting up villages, protecting the forest and land while also fighting dangerous wild animals like snakes, scorpions, tigers, bears and lions. The tribal community’s history, language, identity, socio-cultural and economic values rest upon this heritage. History is witness that the struggle against the plundering of the natural heritage of the tribal community has been going on since the 1700s–1800s. There is an unbroken chain of heroes of the Jharkhand tribal community from 1855 to the early 1900s, such as Sidhu-Kanhu, Chand, Bhairav, Phoolo-Jhano, Sindhraya, Birain, Veer Budu Bhagat, Telang Khadiya, Kanu Mundu, Donka Munda, Birsa Munda and Jatara Tana Bhagat, who fought against exploiters, including the British.
After India’s Independence, in the name of development, the natural resources of Jharkhand started being exploited indiscriminately. The indigenous farming communities of the state have been uprooted from their forests, land, villages and homes in the name of development. Their history and identities have been erased. Even after the formation of the Jharkhand state in 2000, the forcible eviction of the tribal community from their villages has been increasing rapidly …The tribal society has been continuously agitating against the poison of displacement.
Local ST communities have repeatedly resisted the state—first the British, subsequently the Indian state, and in most recent period corporate interests—each of which have threatened their access to, and ability to enjoy economic opportunities from, their local lands and forest areas.Footnote 9
Assessing the relationship between ST—a collection of hundreds of identity-based communities with contested and hazy boundaries—and the forest, across a region as large as India, necessarily involves generalization which will not be true in all cases. That said, scholars and activists agree that ST individuals have, on average, access to fewer economic resources, less political power, and are more concentrated in rural, forested areas, in comparison to non-ST individuals. ST have been forcibly evicted from forests and lost their rights to collect for sustenance, as well as to sell non-timber forest products (Vasan Reference Vasan and Sundar2009, 127; Shah Reference Shah2013, 431, 436).
Other scholars have resisted conceptualizing ST as uniformly poor and rural. Sanjay Kumar has criticized describing ST as an “undifferentiated communities of forest users,” and the use the terms “poor,” “forest dependent community,” or “tribal” interchangeably. Rather, Kumar (Reference Kumar2002, 763–6) shows that the interests of ST village elites in Jharkhand in commercial timber stand in tension with poor ST ability to collect non-timber forest products. Sundar (Reference Sundar and Sundar2009, 18) has pushed back on the idea of ST as a homogeneous entity, describing the emergence of a middle class, developed in part by educational reservations and the army.
Even so, the idea that ST are forest dwellers, dependent upon the forest, is sufficiently widespread that it both informs national and international discourseFootnote 10 and the drafting of critical national laws.Footnote 11 Consider the most significant piece of legislation on forest policy in India—which modified the long-standing Indian Forest Act of 1927—is entitled The Scheduled Tribes and Other Traditional Forest Dwellers (Recognition of Forest Rights) Act of 2006.Footnote 12 This Act, often referred to as the FRA, acknowledges in its preamble the “historical injustices” suffered by the tribals.Footnote 13
To summarize, at a minimum, many ST communities, who live in and around forests, (a) rely on forests for at least some of their economic needs, (b) are significantly disrupted and at times forcibly evicted by industrial projects that clear those forests, and (c) stand to benefit from greater discretionary control over the use of local forests.
Mandated Representation for ST
Since Independence, the Indian government has instituted a variety of political quotas that reserve positions among elected officials, within political parties, in civil service, and for higher education, for individuals associated with specific identity groups. The Constitution of India provides multiple forms of mandated representation for individuals from the categories of ST, Scheduled Castes (SC), and Other Backward Classes (OBC), as well as for women. Quotas set aside politicians within the national parliament (lok sabha), state legislatures (vidhan sabha), and from 1993, in the Panchayat Raj institution (PRI) at district, block, and village-cluster levels.
The Government of India, by means of the 73rd Amendment to the Constitution, 1992, focused and standardized local governance on the three-tier system of PRI, with locally elected government councils at the district, block, and village-cluster levels. These councils are responsible for welfare schemes, infrastructure, and many other regional development policies. In addition, the 73rd amendment devolved powers pertaining to a wide array of economic development and social justice issues to these councils—including minor forest produce (Singh Reference Singh1994).
The 73rd Amendment, and corresponding quotas, were not implemented in Scheduled Areas when they were rolled out across the country in 1993. To address this gap, The Panchayats (Extension to Scheduled Areas) Act, 1996 (PESA) extended local government institutions and created system of political quotas. This mandated representation dramatically boosted ST political representation with Scheduled Areas as the key reference. While elsewhere in India local government quotas only applied to a fraction of areas on a rotating basis, PESA mandated that all chairperson positions at the three levels of local government, and at least 50% of all seats on these councils, be reserved for ST candidates, on a permanent, non-rotating basis. Hence, when local elections were next held, these reforms gave ST a tremendous positive shock to their local political representation.
While legislation setting environmental laws is passed at the federal level, such laws frequently empower local bodies. PESA aimed to “decentralize existing approaches to forest governance by bringing the gram sabha (village council) center stage and recognized the traditional rights of ST over ‘community resources’—meaning land, water, and forests” (Patnaik Reference Patnaik2007, 5). For example, PESA tasked the gram sabha with both preventing alienation of ST land and approving industrial works in Scheduled Areas (e.g., mining licenses). As with many governmental schemes and institutions in India, proper implementation and enforcement of rights-based legislation varies tremendously.
Why ST Representation May Shape Forest Outcomes?
Why might PESA, and ST representation more broadly, matter for forest outcomes? First, improved representation would allow ST to secure better access to non-timber forest products, historically an important source of income for ST, leading to overall better stewardship of forests. By contrast, where ST have less power, worse access to the forest, and where commercial logging interests are unimpeded, we would expect more deforestation and lower stock of trees.
Second, given a history of ST displacement from and loss of use of forest resources, ST representation could lead local actors to block government or industrial operators from pursuing projects that clear forest lands. In this way, ST representation could lead to official/legal channels blocking such operations, or popular, protest channels opposing large-scale works. We discuss and present evidence for these channels of change after presenting the main results below.
DATA
Measuring Scheduled Areas
We manually coded whether a village belongs to Scheduled Area, or not, using information from the Government of India’s Ministry of Tribal Affairs website. Each state releases official documents that list specific village names as Scheduled, or the names of blocks and/or districts for those cases where all villages in a block or district are Scheduled.
To remain consistent in our coding strategy across states and avoid human error, we code an entire block as Scheduled if any village was designated as Scheduled within the block. Empirically, this approach is conservative because, while it accurately codes Scheduled Areas when all villages in a district and block are inside the treatment area, it codes some untreated villages within a block as treated—that is, the resulting bias will be toward zero. This coding is illustrated spatially in Figure 1, and a validation exercise that compares this coding with government-issued maps is presented in Gulzar, Haas, and Pasquale (Reference Gulzar, Haas and Pasquale2020, Appendix B).
Once each village is coded as Scheduled or not according to the above procedure, we construct a switching indicator for Scheduled Areas, in each state, based on the occurrence of the first panchayat election in Scheduled Areas in accordance with PESA. We illustrate this timing in Figure 2.
Panchayat Extension to Scheduled Areas (PESA) Act Implementation Timing
Note: Darker shades indicate years with PESA implementation. PESA was implemented only in Scheduled Areas within each of these states. Vegetation Continuous Fields data are available for the entire period. Global Forest Cover data are only available from 2001.

Forest Data
We use two sources of highly spatially disaggregated remote sensing data to measure forest cover and deforestation. The MEaSURES VCF dataset (Song et al. Reference Song, Hansen, Stehman, Potapov, Tyukavina, Vermote and Townshend2018) reports annual indices of tree-canopy cover (henceforth, forest index), non-tree vegetation, and bare ground at the $ 0.05 $
degree resolution from 1982 to 2016.
$ 0.05 $
degree resolution from 1982 to 2016.
The second dataset comes from the GFC dataset (Hansen et al. Reference Hansen, Potapov, Moore, Hancher, Turubanova, Tyukavina and Thau2013), which reports the ex ante tree canopy as a share of the cell that was forested in the year 2000. The dataset also provides the year in which any given cell was deforested (defined as a stand-replacement disturbance, i.e., a disturbance that eliminates all trees in the pixel) between 2001 and 2017. For GFC, we aggregate these measures up to the village level by merging them with village shapefiles for the 2001 Indian census (Infomap 2001), which is the smallest administrative unit that has consistent coverage across Indian states. We then convert the number of deforested cells per village per year into hectares per year—a commonly used unit when discussing medium-scale areas—by multiplying the number of deforested cells in each year by $ 0.09 $
, since a hectare is
$ 0.09 $
, since a hectare is $ 10,000 $
m
$ 10,000 $
m $ {}^2 $
and the area of a LANDSAT cell is
$ {}^2 $
and the area of a LANDSAT cell is $ 30\times 30=900 $
m
$ 30\times 30=900 $
m $ {}^2 $
. This gives us the GFC-dependent variable in terms of deforested area in hectares in each year for each village.
$ {}^2 $
. This gives us the GFC-dependent variable in terms of deforested area in hectares in each year for each village.
The two data sources have their strengths and weaknesses. The VCF data have longer temporal coverage, which allows us to use variation in treatment status from all nine Fifth Schedule states, whereas GFC coverage begins in 2001 and thus restricts us to using variation from the last four states to implement PESA reforms. VCF reports three continuous indices that add up to 100 for each pixel, and as such can be used to study both increases and decreases in forest cover and substitution patterns across the three land cover categories. By contrast, in the GFC data, a pixel can only move from forested to deforested once since deforestation is an absorbing state. The GFC data are more geographically precise, whereas the VCF data necessitate a pixel unit of measurement (with each pixel larger than a village).
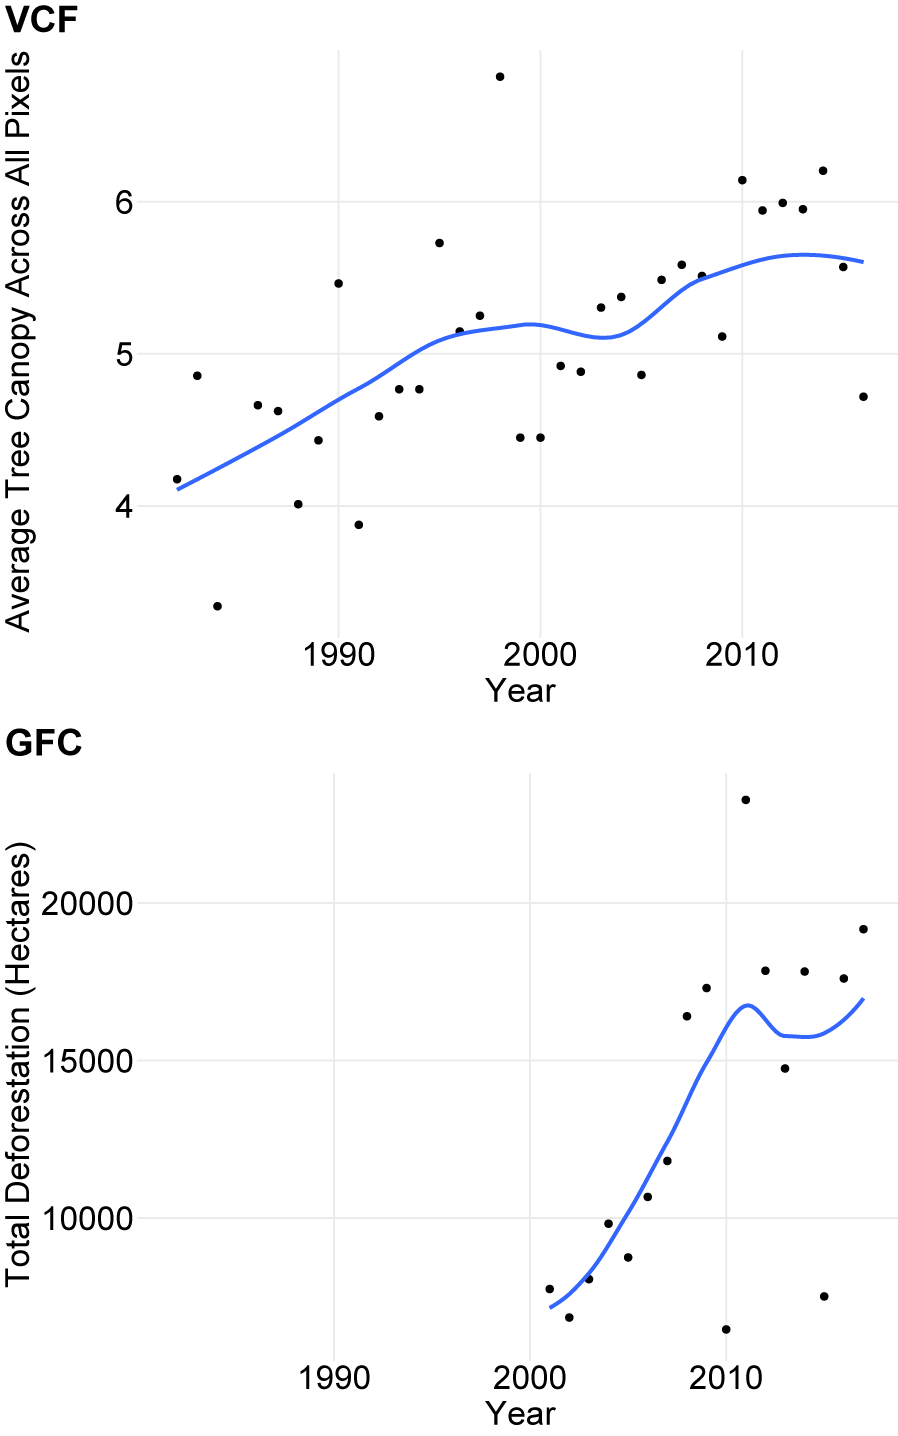
We report aggregate trends in average tree canopy from VCF and annual deforested area from GFC in Figure 3. The first panel indicates that the average tree canopy index has been weakly increasing over the entire span of the VCF dataset. The second panel shows substantial deforestation between 2000 and 2015.
Aggregate Trends in Forest Cover Index in Vegetation Continuous Fields Data (Top) and Total Deforested Area in Global Forest Cover (Bottom) in the Nine States under Study
Finally, the use of remote-sensing data for social scientific research questions requires some care in design and interpretation. The two forest cover measures we use are model-based predictions, and as such may be subject to measurement and prediction error. While our fixed-effects strategy ameliorates these concerns, we nevertheless discuss these issues in greater detail in Appendix B of the Supplementary Material.
All replication material for this article are available on the Harvard Dataverse (Gulzar, Lal, and Pasquale Reference Gulzar, Lal and Pasquale2023).
THE IMPACT OF REPRESENTATION ON FOREST OUTCOMES
Empirical Strategy: Difference-in-Differences
We employ a difference-in-differences design to study the effect of the rollout of PESA on deforestation, where the first difference is between Scheduled Areas and non-Scheduled Areas, and the second is over-time variation following the onset of the first post-PESA election in Scheduled Areas. In Scheduled Areas, political representation for ST increases by means of both the introduction of local elections (after PESA) and via mandated representation throughout the entire geographic area.
Non-Scheduled Areas experienced local government since the introduction of the 73rd amendment.Footnote 14 In addition, some villages in these areas are reserved for candidates who are identified as ST, SC, OBC, and/or as women based on the proportion of the group’s population in the local area, a reservation that rotates over election cycles. Critically, the rotating quotas only reserve a given area until the next 5-year election, unlike in Scheduled Areas, where the quota persists indefinitely. Finally, elections are held in both Scheduled and non-Scheduled areas at the same time. Because elections can only be held after an appropriate period has passed (i.e., when the term of the local governments in the non-Scheduled Areas is complete), the specific year in which treatment begins is unlikely to be correlated with the conditions in Scheduled Areas. Therefore, what we estimate using a difference-in-differences design can be interpreted as the differential effect of increased representation for ST.
Since we have a panel dataset of each unit—pixel for VCF data and village for GFC data—with time-varying binary treatment, we begin the analysis with a two-way fixed-effects estimator:
 $$ \begin{array}{c}{Y}_{ist}=\tau {\mathrm{Scheduled}\ \mathrm{Area}}_{is}\times {\mathrm{PESA}\ \mathrm{Election}\ \mathrm{Year}}_{ist}\\ {}\hskip-10.12em +\hskip0.35em {\delta}_i+{\gamma}_t+{\epsilon}_{ist},& \end{array} $$
where i indexes pixels/villages, s indexes state, and t indexes years. $ {Y}_{ist} $
is the forest index for pixel i in year t or total area (in hectares) deforested in village i in year t (in GFC), Scheduled Area × PESA Election Year
$ {Y}_{ist} $
is the forest index for pixel i in year t or total area (in hectares) deforested in village i in year t (in GFC), Scheduled Area × PESA Election Year $ {}_{it} $
is a dummy that takes a value of 1 for pixels/villages in scheduled areas in the year the first election where PESA was implemented,
$ {}_{it} $
is a dummy that takes a value of 1 for pixels/villages in scheduled areas in the year the first election where PESA was implemented, $ {\delta}_i $
is a pixel/village fixed effect, and
$ {\delta}_i $
is a pixel/village fixed effect, and $ {\gamma}_t $
is a year fixed effect.
$ {\gamma}_t $
is a year fixed effect. $ \tau $
corresponds to the average effect of the introduction of PESA elections in Scheduled Areas (average treatment effect on the treated [ATT]). This estimator includes pixels/villages which account for all time-invariant pixel/village characteristics, such as geographical variables like remoteness, or slow-moving sociodemographic ones such as ethnic composition. We also include year fixed effects that absorb common shocks like national policies, such as the FRA, that might affect deforestation rates. We cluster standard errors by block, though the official “unit of assignment” of PESA status is the village to allow for spatial spillovers.
$ \tau $
corresponds to the average effect of the introduction of PESA elections in Scheduled Areas (average treatment effect on the treated [ATT]). This estimator includes pixels/villages which account for all time-invariant pixel/village characteristics, such as geographical variables like remoteness, or slow-moving sociodemographic ones such as ethnic composition. We also include year fixed effects that absorb common shocks like national policies, such as the FRA, that might affect deforestation rates. We cluster standard errors by block, though the official “unit of assignment” of PESA status is the village to allow for spatial spillovers.
The difference-in-differences design relies on the assumption of parallel trends, which in this context means that pixels/villages in Scheduled Areas were on the same deforestation trajectories as those that were not in Scheduled Areas before the introduction of local elections under PESA. First, one might worry that simple pixel/village fixed effect may not capture potential time-varying confounding. We, therefore, introduce pixel/village-level linear time trends which remove variation from the outcome by pixel/village that may potentially misattribute treatment effects to the policy if take-up was indeed non-random and related to the underlying village time trend of forest outcomes.
A second worry is that different state-level policies adopted at particular times may constitute a plausible time-varying confounder, rendering the estimate from the common year fixed-effects specification biased. For example, the FRA (passed in 2006 and implemented in 2008), which delegated various forest-related rights to the village panchayats regardless of their PESA status, may have been implemented unevenly across different states, and therefore a common year fixed-effect might not account for this confounding. We, therefore, introduce, state × year fixed effects, which account for such time-varying state-level confounders. We use the following specification:
 $$ \begin{array}{c}{Y}_{ist}=\tau \mathrm{Scheduled}\ \mathrm{Area}\times {\mathrm{PESA}\ \mathrm{Election}\ \mathrm{Year}}_{ist}\\ {}\hskip-7em +\hskip0.35em {\delta}_i+{\xi}_{st}+{\delta}_it+{\epsilon}_{ist},& \end{array} $$
where we have added additional $ {\delta}_it $
village-specific linear time trends and
$ {\delta}_it $
village-specific linear time trends and $ {\xi}_{st} $
state-year fixed effects. In this specification,
$ {\xi}_{st} $
state-year fixed effects. In this specification, $ \tau $
is identified off within-village variation, conditional on common state × year-level unobservable variables and village-level time trends for the entire sample. This analysis, therefore, pools across differences-in-differences estimates (wherein the treatment and control units are within each state), and does not rely on the staggered adoption of the policy for causal identification. This specification yields estimates of the ATT even when treatment effects are heterogeneous, which the standard two-way FE model does not.
$ \tau $
is identified off within-village variation, conditional on common state × year-level unobservable variables and village-level time trends for the entire sample. This analysis, therefore, pools across differences-in-differences estimates (wherein the treatment and control units are within each state), and does not rely on the staggered adoption of the policy for causal identification. This specification yields estimates of the ATT even when treatment effects are heterogeneous, which the standard two-way FE model does not.
Main Results
Our main empirical results for the two datasets are reported in Table 1. The first three columns report the results on a pixel-level panel VCF dataset where the outcome is the annual forest index and the treatment is coded on the basis of PESA rollout; hence, positive coefficients denote an increase in forest cover. The next three columns report the estimates from the analysis on a village-level panel GFC dataset where the outcome is the annual deforested area in hectares; hence, negative coefficients denote an decrease in deforestation. Columns 1 and 4 report estimates of $ \tau $
from estimating Equation 1, columns 2 and 5 add in state-year FEs, and finally, columns 3 and 6 report results from estimating our preferred specification (Equation 2).Footnote
15
$ \tau $
from estimating Equation 1, columns 2 and 5 add in state-year FEs, and finally, columns 3 and 6 report results from estimating our preferred specification (Equation 2).Footnote
15
Deforestation and Forest Cover Index Regression Estimates (Ex Ante Median Cutoff)

Note: Standard errors are clustered at the block level and reported in parentheses.
Since including villages with no forest cover mechanically biases estimates toward zero (villages with no forest cover cannot have decreases in the rate of deforestation), we restrict the analysis to areas with some existing forest cover. For both VCF pixels and GFC villages, we restrict attention to places with ex ante coverage of 2% in 1990 and 2000, respectively. This is the 50th percentile of coverage in VCF and 75th percentile in GFC. We show robustness to varying these thresholds below.
We find that PESA increased forest cover and decreased the rate of deforestation, with all estimates significant at the $ 1\% $
level. For the VCF data, our preferred specification in column 3 produces a treatment effect of 0.36, which translates to an average annual increase of
$ 1\% $
level. For the VCF data, our preferred specification in column 3 produces a treatment effect of 0.36, which translates to an average annual increase of $ \approx 3\% $
on the control mean of 12.3 (on a 100-point scale).Footnote
16 For the GFC data, the treatment effect is approximately
$ \approx 3\% $
on the control mean of 12.3 (on a 100-point scale).Footnote
16 For the GFC data, the treatment effect is approximately $ 0.06 $
hectares.
$ 0.06 $
hectares.
In Figure 4, we test whether our results are sensitive to the choice of ex ante forest cutoff by estimating Equation 2 on a sample with varying ex ante forest cover cutoffs. We find that estimates are stable across a wide variety of thresholds and are larger when the sample is restricted to pixels with higher ex ante forest cover.
Treatment Effects on Annual Deforestation as a Function of Ex Ante Forest Cover Cutoffs
Note: The figure reports treatment effect estimates with specification in Equation 2, with standard errors estimates clustered by block. Ex ante cutoffs are defined with 1990 data for Vegetation Continuous Fields. The replication materials also present these results in tabular form.

Event Study: Impacts Appear after the Introduction of PESA
To examine whether PESA is indeed driving these results, we report yearly treatment effects separately for each year.
We estimate a specification that includes leads and lags of the treatment dummy to decompose the treatment effect by each year preceding and following the switch from pre- to post-PESA. We take the year immediately preceding the treatment as the omitted baseline year of comparison to avoid saturating the model. We use the VCF data alone for this section, since the GFC dataset (2001–17) coverage period does not give us sufficient time periods to estimate effects on leads of treatments.
We present the results graphically in Figure 5 for different subsamples of the data, in an increasing order of ex ante forest levels, with the bottom left (6th decile and up) panel corresponding to the main analysis sample in the previous section. $ t=0 $
represents the first year of the treated period, whereas
$ t=0 $
represents the first year of the treated period, whereas $ t=-1 $
represents the last year of the control period. The bulk of effects are large and persistent following the treatment year. Finally, consistent with Figure 4, the treatment effects are larger when we restrict the sample to higher ex ante forest cover.
$ t=-1 $
represents the last year of the control period. The bulk of effects are large and persistent following the treatment year. Finally, consistent with Figure 4, the treatment effects are larger when we restrict the sample to higher ex ante forest cover.
Dynamic Treatment Effects of PESA Adoption on Forest Index
Note: This figure presents the result from the event study regression omitting time $ -1 $
, such that each coefficient reports the difference with respect to the year immediately preceding treatment. Standard errors are clustered by block. Deciles are defined with 1990 Vegetation Continuous Fields values. The replication materials also present these results in tabular form.
$ -1 $
, such that each coefficient reports the difference with respect to the year immediately preceding treatment. Standard errors are clustered by block. Deciles are defined with 1990 Vegetation Continuous Fields values. The replication materials also present these results in tabular form.

Effects with Matched Difference-in-Differences
One potential issue with the main analysis is that despite precise fixed effects and time trends at the pixel level, there is an implicit assumption of linearity in the pixel-specific time trends. This leads to the concern that there might be nonlinear pixel-level time trends that explain the results. To account for these types of issues, we carry out a matched difference-in-differences exercise using PanelMatch (Imai, Kim, and Wang Reference Imai, Kim and Wang2023).Footnote 17
We restrict attention to VCF data as they provide the most comprehensive temporal coverage. As before, we focus on our primary sample with above median forest cover in 1990. We match on the trajectories of the forest cover index and night-time luminosity, the latter of which accounts for differences in development trajectories between Scheduled and non-Scheduled Areas. We also exact match on State as well as the four lags for the onset of mining conflict from the Land Conflict Watch (2022) data that we describe in more detail in the mechanisms section.
We carry out matching and refinement by using propensity score matching and covariate balanced propensity score weighting available in the PanelMatch package. As treatment histories are the same within-state, the strategy yields a match for every treated pixel in the data. This is confirmed in Figure 6a, which shows the frequency distribution of matched control units. We do not observe any unmatched treatment units in the data. See Appendix D of the Supplementary Material for further discussion.
Effects of PESA Adoption on Forest Index using PanelMatch
Note: We use the PanelMatch package for this analysis (Imai, Kim, and Wang Reference Imai, Kim and Wang2023). The matching procedure is described in the text. (a) Shows the frequency distribution of matched control units. There are no unmatched treatment units. (b) Shows that refinement improves balance on all covariates considerably. (c) Shows that matching improves the balance of pre-treatment trends and both models perform similarly. (d) Shows that the treatment effects originate with PESA implementation and remain positive and significant up to 4 years later. Standard errors are cluster-bootstrapped by block. The replication materials present panel (d) results in tabular form.

Next, we assess whether matching improves balance. Figure 6b shows that matching reduces the standardized differences between treatment and control units on a host of variables including the four lags of forest index, nightlights, the number of roads completed, the number of roads sanctioned, and the onset of mining conflict. We also show balance on time-invariant variables. These include an indicator for the average distance of villages in the pixel to the nearest town with over a hundred thousand population in 1991, and indicators for whether any village in a pixel in 1991 had: access to a tar road, access to power, greater than median literacy, and greater than median shares of SC/ST populations. All points lie below the 45-degree line signaling a better-matched sample after re-weighting. The largest improvement in balance is on the outcome, forest index, and nightlights.
Figure 6c plots the difference between the trajectories of scheduled and unscheduled pixels before and after matching and refinement in the four periods leading up to PESA implementation on the outcome, forest index, as well as other time-varying variables. In general, the imbalance before matching and refinement is not large in levels and the trends for all variables are flat. After matching and refinement, the samples are well-balanced under both matching models (with the 0.2 standard deviation band in gray motivated by Imbens and Rubin [Reference Imbens and Rubin2015], who argue that standardized balance tests are advisable over comparisons in raw measures). Taken together, these balance analyses confirm that there are negligible positive differences between Scheduled and non-Scheduled units before PESA, and if anything, the difference in the outcome of interest, forest index, are trending toward zero in the 4 years preceding PESA.
We can now estimate treatment effects on a matched sample without relying on any functional form assumptions on the outcome data-generating process, such as linearity. After adjusting for pre-trends using panel-matching, we find in Figure 6d that the treatment effect on the forest index appears in the PESA year, persists for a few years, and is consistently large and positive. This provides stronger evidence to justify a causal interpretation of the observed improvements in forest index following the introduction of PESA. These estimates are also substantially larger than those produced by the regression event-study estimates in Figure 5, suggesting that if anything, omitted time-varying confounders were biasing our regression estimates toward zero.
Robustness: Alternative Estimator and Placebos
We carry out two further tests as a robustness exercise. First, we use interactive fixed effects models, which nest conventional two-way fixed effects and time trends as special cases, to account for potential nonlinear trends and time-varying confounders in the outcome data generating process (Bai Reference Bai2009). We report the details of the method and accompanying results in Appendix D of the Supplementary Material, and find results that are substantively and statistically consistent with the main analyses.
Second, we conduct placebo analyses with two approaches. First, we randomly re-label units within each state to be Scheduled or not, and perform the analyses from our main specification on these placebo treatment units. Second, we restrict to pre-PESA periods within each state and randomly assign treatment timing, and repeat the analyses. We report the null distribution and realized treatment effect in Appendix D of the Supplementary Material, and find, as expected, that observed treatment effects are far larger than the null distribution.
THE ROLE OF MANDATED REPRESENTATION
Improved representation in our context comprises two elements: local government and ST-mandated representation. Theoretically, we have argued that mandated representation may be particularly powerful at overcoming roadblocks in increasing the efficacy of local government on forest conservation. In this section, we probe this claim by juxtaposing the impact of PESA, presented above, with two other laws that contain policy objectives, but lack a key feature of PESA—mandated representation in local government.
Panchayati Raj Institutions
The Panchayati Raj Act introduced a three-tier system of formal local government in non-Scheduled Areas of India, beginning in 1993, and with rotating, rather than fixed quotas. We use the staggered rollout of local government under this reform to study its impact on the forests cover index in the VCF data (see Appendix D of the Supplementary Material for details).Footnote 18 We utilize a similar empirical strategy as in our main results, except that Scheduled Areas serve as control units (since they did not receive local governance institutions until PESA implementation much later), while non-Scheduled Areas in each state are the treatment units. In contrast to the positive effects of the introduction of PESA, we find that the introduction of local governments under the 73rd Amendment in non-Scheduled Areas had, if anything, a small negative effect on forest cover. This finding may reflect elite capture, as described in our theoretical discussion in footnote 4 and consistent with Bardhan and Mookherjee (Reference Bardhan and Mookherjee2000).
One concern with this test is that non-Scheduled Areas had limited forest cover to begin with. On one hand, this would limit the degree to which PRI could shape forest outcomes. On the other hand, this could make it easier for PRI to affect real change. To probe this, we plot the difference-in-differences coefficient by ex ante forest cover in Figure 7a and do not find any evidence that PRI had an impact on forest cover—even in high ex ante forest coverage areas.
The Effect of Panchayati Raj Institutions and Forest Rights Act by Ex Ante (1990) Forest Cover
Note: Standard errors are clustered by block. The replication materials also present these results in tabular form.

We also leverage the state of Jharkhand, which, due to its unique history, allows us to isolate the role of ST mandated representation on deforestation. Due to legal battles regarding the independence of the state of Jharkhand—before 2000, Jharkhand was a part of Bihar—Jharkhand held its first local elections for both Scheduled and non-Scheduled Areas together in 2010. For this reason, Jharkhand’s first post-PESA election in 2010 introduced local elections effectively to the entire state, and ST quotas-only in Scheduled Areas. The treatment effects we observe because local government via local elections arrives in both Scheduled and non-Scheduled Areas at the same time. Consequently, any treatment effects we observe in this state are more likely attributable to ST-mandated representation. Indeed, we find strong reductions in deforestation in Jharkhand (see Appendix D of the Supplementary Material), where the average forest cover does not change. These results emphasize how mandated representation may be a key channel for fulfilling the historical absence of a political voice for ST in rural India.
The Forest Rights Act
Roughly concurrent with the rolling implementation of PESA, The Scheduled Tribes and Other Traditional Forest Dwellers (Recognition of Forest Rights) Act—also known as the FRA—was passed in 2006 and implemented on January 1, 2008. FRA aims to provide rights to forest inhabitants, and ST in particular, including ownership rights, rights of use, rights to relief in cases of eviction or displacement, and rights to protect forests and wildlife. Kashwan (Reference Kashwan2017, 134) discusses in detail the history of FRA’s adoption, and writes that: “In the end, the FRA and its accompanying rules turned out to be a hodgepodge of conflicting interests and perspectives.” In practice, FRA has, at best, a mixed and incomplete record of granting land and protecting the interests of ST and other marginalized communities rights to the forest (Kumar, Singh, and Rao Reference Kumar, Singh and Giri Rao2017).
Was the FRA disproportionately effective in Scheduled Areas? In comparing Scheduled to non-Scheduled Areas, we find little difference in deforestation following the FRA implementation in 2008.Footnote 19 We, therefore, conclude that PESA had a substantial effect on reducing deforestation in Scheduled Areas relative to what can be discerned for the FRA. As in the analysis of PRI above, we similarly find no evidence of greater FRA impact on deforestation in areas with significant ex ante forest cover (see Figure 7b).Footnote 20
Our takeaway from these analyses is that neither local representation (via PRI), nor the legal provision of forests rights (via FRA), are sufficient. Unless there is a boost in ST communities’ political power, we are unlikely to see an impact on forest conservation. The case of PESA is unique in this sense—it provides an institutionally more inclusive solution to the problem of forest management.
UNPACKING THE RELATIONSHIP BETWEEN REPRESENTATION AND FOREST OUTCOMES
In this section, we investigate and find evidence in support of, two mechanisms linking improved representation under PESA to forest conservation. First, we present evidence that ST representation leads to an improvement in the stewardship of the forest. Second, we present evidence that mandated representation increases ST resistance to commercial interests—and in particular, to mining operations—that threaten ST control and use of the forest.
Stewardship of the Forest
One channel by which mandated representation increases forest conservation relates to ST improving stewardship of the forest in order to pursue their economic interest by collecting minor forest produce. One clear economic logic, present in both the historical and anthropological accounts (reviewed above), as well as in contemporary accounts in the post-PESA period, is that ST groups collect, use, and sell non-timber forest products from the forest. By pursuing these non-timber resources, ST communities under PESA serve as better stewards of the forest, in comparison to the status-quo communities where timber companies and mining operators have a freer hand to extract forest resources. Consider the following examples from two Indian states of how ST groups under PESA secure access to forest lands, then cultivate minor forest products, and finally protect those forests:
-
• In the state of Odisha, activists and non-governmental organizations have documented how individual gram sabha, or local village councils, a key political unit empowered by PESA, have organized and prepared boundary maps reflective of their customary rights, under the FRA, in order to secure their rights to these lands.Footnote 21
-
• In 2016, the Rahu group of villages, in the state of Maharashtra, was able to gain official community forest rights recognition for 1,300 hectares of forest land under PESA and FRA. This has allowed Rahu to collect and sell minor forest produce, consisting primarily of bamboo and tendu (which is used to make cigarettes), which in turn has created a sustained source of livelihood for these villagers, over the past 4 years. Further, the Rahu village gram sabha created a community forest rights management committee, which in turn generated and carried out a conservation, management, and harvesting plan for collecting of that minor forest produce and more broadly, managing their local forest areas. Lastly, the gram sabha organized regular forest patrols to protect against forest fires and illegal forest theft.Footnote 22
Shifting to quantitative evidence, we see some support for this channel. First, our main empirical results show that mandated representation leads to both lower deforestation and an increase in the total forest stock. This is consistent with a substitution from timber extraction, and other large-scale industrial works, to the small-scale collection of minor forest produce. Second, we examine the VCF short vegetation index—a layer that measures vegetation that has not reached the tree height cutoff of 5 meters. We find that PESA leads to a decrease in the short vegetation index (see Appendix D of the Supplementary Material). This decrease is consistent both with ST communities selective, and sustainable, collection of non-timber forest produce, as well as their allowing and protecting young trees to mature and grow above 5 meters. This latter logic explains both the decrease in short vegetation index and overall increase in forest cover.
Opposing Mining Operations
Roy (Reference Roy2017) writes:
Over the past five years or so, the governments of Chhattisgarh, Jharkhand, Odisha and West Bengal have signed hundreds of [Memoranda of Understanding (MoU)] with corporate houses, worth several billion dollars, all of them secret, for steel plants, sponge-iron factories, power plants, aluminium refineries, dams and mines. In order for the MoUs to translate into real money, tribal people must be moved.
A second channel by which PESA may decrease deforestation is by empowering forest-dwelling and forest-adjacent local communities, who in turn disrupt large-scale commercial operations—a critical example of which are mining operations—operations that would otherwise clear forests and other local natural resources. Why would local communities want to disrupt such operations? Scholars have shown that mining operations have been associated with (a) villagers who live near mines exhibiting higher respiratory illness and worse employment outcomes (Saha et al. Reference Saha, Pattanayak, Sills and Singha2011), (b) decreased vegetation, worsening vegetation composition, increased deforestation, and increased forest fragmentation (Areendran et al. Reference Areendran, Rao, Raj and Mazumdar2013), and (c) mining-induced forced displacement. Downing (Reference Downing2002, 3) found that mining in India displaced 2.55-million individuals between 1950 and 1990.
One critical cause of deforestation involves the legal and illegal extraction of natural resources, whereby politicians and bureaucrats work hand-in-hand with corporate interests. While researchers have shown state actors and corporate interests regularly appropriate land without local government consultation, contemporary studies of rural India have similarly shown that villagers do work through their locally elected council chairpersons, attempt to contest mining projects, and other large development operations (Choudhury Reference Choudhury2019; Nandwani Reference Nandwani2022). If this mechanism is operative, local PESA communities will more easily disrupt existing political leader-corporate mining relations, much of it at the district or state level, empowering village governance and decreasing deforestation and other natural resource extraction.
To assess evidence for this mechanism, we first examine the relationship between mining and deforestation. To do so, we utilize data from the Indian Mining Census, compiled by Asher and Novosad (Reference Asher and Novosad2023). The mining census lists every known mine’s location and type (see Appendix D of the Supplementary Material for a map), which allows us to compute the distance from each pixel to every mine. We then use the minimum of these distances as a mediator to examine if treatment effects are stronger for villages that are located close to mining sites.
Using VCF data, we find areas closest to mines experience worse deforestation before PESA (see Figure 8a), but experience the greatest positive outcomes vis-à-vis forest conservation after the arrival of PESA (see Figure 8b). We report additional estimates by tercile of distance to mines, as well as analogous calculations using GFC data in Appendix D of the Supplementary Material, finding similar results.
Forest Cover and Proximity to Mining
Note: (a) reports non-parametric binned scatterplot of decrease in forest index between 1990 and the first year before PESA as a function of distance to mines. In (b), we report a binned regression that estimates the treatment effect in pixels at different values of the moderator (distance to mines). The replication materials also present these results in tabular form.

Having shown a relationship between mining and deforestation, we next systematically investigate the potential link between PESA and the disruption of mining operations. To do this, we utilize a new dataset of land conflicts in India. These data, the “first and only database of ongoing land and resource conflicts” in India,Footnote 23 are compiled by Land Conflict Watch (LCW), an India-based organization, through its network of local interdisciplinary researchers as well as local newspaper accounts. LCW defines land and resource conflicts as ones “in which the use of, access to, and/or control over land and its associated resources are contested by two or more parties” over “underlying public interest” (Land Conflict Watch 2022). The dataset codes each conflict into one of six sectors, one of which is “mining,” allowing for an analysis of the question of whether PESA is associated with a differential increase in community-driven mining-related conflicts. Consider excerpts from two mining-related conflict summaries from the LCW dataset:
-
• Tribes in Odisha’s Kodingamali Hills Unite, Demand Bauxite Mining to be Stopped—“Tribal communities in Kodingamali village have protested against the mining operations, highlighting issues of irregularities in the forest clearance, inadequate livelihood opportunities and water and air pollution in the area from mining operations. The area falls under Schedule V of…PESA. The tribes people allege that the provisions of PESA were not followed nor was their consent taken while granting forest clearance to the project…In April 2018, five forest dwellers were arrested for allegedly torching a tipper of the OMC, following which mining was halted for some time…In December the same year [2019], the Orissa High Court ordered the secretary of the State Mines Department to look into the matter and to stop illegal mining at the Kodingamali mines…”Footnote 24
-
• Gond Tribe Opposes Iron Ore Mining in Zendepar Village in Maharashtra’s Gadchiroli—“Tribal residents of Zendepar village in Gadchiroli have opposed iron ore mining proposed in five sites in Korchi tehsil…land has been reserved for mining by the district collector without the consent of the gram sabha (village council) in violation of the Forest Rights Act…the forest dwellers, mainly the Gond tribe, claim that mining activities in the forest will affect their life and livelihood as well as hamper their spiritual beliefs and practices…The tribal community depends on the rich biodiversity and forest produce to earn their livelihood. Tendu, mahua and other minor forest produce (MFP) are their main sources of income…In February 2012, the Gonds decided to boycott the local elections in protest against the proposed iron ore mining. This forced the district administration to give a written undertaking that no clearance had been given to any mining project in Korchi tehsil. Following this assurance, the people withdrew the poll boycott and voted.”Footnote 25
These descriptions highlight how village communities are able to resist mining operations after PESA. We proceed to test for this quantitatively use the LCW dataset which provides the geographic coordinates and the onset year for each conflict. With this information, we assign a conflict to a pixel in our main data if the pixel falls within a 50-km radius of a mining conflict location. Table 2 presents the difference-in-differences result with Equation 2. We find that mining conflict onset increases with the introduction of PESA both in the full sample by 12.9% (column 1), and increases by 12.9% in the sample with ex ante greater than median forest cover (column 2). Finally, Appendix D of the Supplementary Material shows that our results are robust to varying the 50-km threshold, while Figure A7 shows the robustness of the positive effects using matching estimators.
The Impact of Increased Representation on Onset of Mining Conflict

Note: Standard errors are clustered at the block level and reported in parentheses.
DISCUSSION AND CONCLUSION
In this article, we show that local representation matters for natural resource conservation. We find that the introduction of local government elections, with mandated representation for ST, substantially reduces the rate of deforestation and increases the overall stock of forest in India.
We find suggestive evidence for two mechanisms. First, ST communities pursue their economic incentives to collect minor forest produce, reduce the influence of commercial interests, and in so doing serve as better stewards of their local forests. Second, we find that the reduction in deforestation is largest in areas closest to mines—areas that ex ante had the highest levels of deforestation—suggesting that bolstering political representation may solve collective action problems and spur marginalized communities to protest and undermine the influence of large-scale commercial operations.
From a policy perspective, it is not clear if achieving improved forest outcomes would also fulfill welfare priorities for marginalized populations. ST remain one of the most marginalized and impoverished populations in India today. Therefore, policymakers have a duty to provide ST with better welfare opportunities. Recent literature suggests that there may be policy complementarities between achieving conservation and local development for marginalized populations (Larson and Soto Reference Larson and Soto2008; Manor Reference Manor2004; Ribot Reference Ribot2003). In our case, consider the question of whether mandated representation for ST, by means of PESA, also improves ST economic well-being via access to government welfare programs. We make progress on this by placing our findings on forest conservation in conversation with recent evidence on the effects of the same policy on development and welfare outcomes.
Gulzar, Haas, and Pasquale (Reference Gulzar, Haas and Pasquale2020), examining the boost in ST representation via PESA, study the provision of economic opportunities to ST under the world’s largest employment program, the National Rural Employment Guarantee Scheme (NREGS). This program aims to guarantee 100 days of minimum wage labor to every rural Indian citizen, each year, as a way of providing social security to poor households. They find that ST-mandated representation significantly increases how much work ST receive under NREGS, without compromising the implementation of NREGS for other, historically marginalized communities who are not ST. Beyond NREGS, they find other economic benefits, including improvements to local public goods and rural road connectivity. Taken together, our findings on forests here and the results in Gulzar, Haas, and Pasquale (Reference Gulzar, Haas and Pasquale2020) present micro-level evidence for the complementarity of conservation objectives and economic welfare objectives from the same policy experiment.
While scholars have examined a variety of institutions that seek to tackle deforestation and these development concerns directly, our focus on mandated representation is an examination of an umbrella institution—one that aims to simultaneously improve the economic welfare of marginalized communities as well as give local populations more control over their local resources. Over a hundred countries around the world have implemented mandated representation institutions with the aim of bolstering the voice of marginalized communities. Given the ubiquity of these institutions, political representation as an umbrella approach appears to be well worth further analysis and policy consideration.
SUPPLEMENTARY MATERIAL
To view supplementary material for this article, please visit https://doi.org/10.1017/S0003055423000758.
DATA AVAILABILITY STATEMENT
Research documentation and data that support the findings of this study are openly available at the American Political Science Review Dataverse: https://doi.org/10.7910/DVN/01HXNF.
ACKNOWLEDGMENTS
We thank Rikhil Bhavnani, Mark Buntaine, Saumitra Jha, Teevrat Garg, Alexandra Hartman, Paul Novosad, Jonathan Rodden, Daniel Thompson, Gilles Verniers, and participants at the pre-APSA mini-conference on South Asia 2019, Asoka University, CEGA Evidence to Action Summit 2020, Oxford, Pacific Conference for Development Economics 2020, Stanford Democracy Policy Lab, University of Minnesota, UCL, and Pia Raffler’s replication class at Harvard, including Sachet Bangya, Byron Cohen, Chengyu Fu, and Kartik Srivastava, for their valuable comments and suggestions. We also thank Mrinali Karthick at Land Conflict Watch for sharing their conflict data. Surbhi Ghai, Nikhil Konatham, Diego Tocre, and Anzony Quispe provided excellent research assistance.
CONFLICT OF INTEREST
The authors declare no ethical issues or conflicts of interest in this research.
ETHICAL STANDARDS
The authors affirm this research did not involve human subjects.


 Open access
Comments
No Comments have been published for this article.