

Maintaining skeletal muscle mass (SMM) and function is important for health, but loss of both occurs as a natural consequence of ageing. This loss starts from mid-life, as early as age 40 years, and progresses more rapidly over the age of 60 years(Reference Welch1–Reference Newman, Lee and Visser4). Sarcopenia, the presence of low skeletal mass and function, is the result of the gradual decline with age in muscle strength as well as mass. The most recent definition of sarcopenia focuses on functional aspects whilst acknowledging that the role of SMM requires further research(Reference Cruz-Jentoft, Baeyens and Bauer5–Reference Cruz-Jentoft, Bahat and Bauer7). Sarcopenic obesity is the presence of sarcopenia, as low lean mass, in combination with obesity; this condition is also increasingly prevalent in older populations(Reference Welch1,Reference Theodorakopoulos, Jones and Bannerman8–Reference Batsis, Barre and Mackenzie11) . Moreover, sarcopenia and age-related skeletal muscle loss are key contributors to frailty. Research and clinical interest for sarcopenia have largely focused on the functional consequences of the loss of muscle with age, such as reduced mobility and increased falls and fractures. There has been less focus on the metabolic and homoeostatic importance of skeletal muscle and the consequences of this skeletal muscle loss on nutritional biochemistry and metabolism and utilisation of macronutrients(Reference Welch1,Reference Landi, Camprubi-Robles and Bear12–Reference Welch, Macgregor and Minihane17) .
Skeletal muscle is integral to the metabolism and utilisation of the macronutrients protein, fat and carbohydrate, as well as overall energy metabolism. However, the age-related loss of SMM, changes in skeletal muscle morphology and the consequent effects and interactions on metabolism of macronutrients are much less appreciated(Reference Landi, Camprubi-Robles and Bear12).
The prevalence of sarcopenia is high in residential care and in the community (14–33 and 29 %, respectively), and the number of individuals with sarcopenia is predicted to nearly double in the next 30 years(Reference Ethgen, Beaudart and Buckinx6,Reference Cruz-Jentoft, Landi and Schneider18) . Sarcopenia is also a component of frailty, which has a prevalence of 25 % in those over the age of 80 years(Reference Wright, Looker and Saag19). The age-related losses and changes to morphology of skeletal muscle also have consequences for carbohydrate metabolism, as this is used by skeletal muscle as glucose, released by digestion of carbohydrate. This has implications for the onset of insulin resistance and type-2 diabetes(Reference Welch1,Reference Wolfe2,Reference Deutz, Ashurst and Ballesteros13,Reference Argiles, Campos and Lopez-Pedrosa14,Reference Scott, de Courten and Ebeling20–Reference Cleasby, Jamieson and Atherton23) . Loss of skeletal muscle also has implications for energy expenditure and concomitant risk of onset of obesity. Given the prevalence of sarcopenia, frailty, obesity and type-2 diabetes in adulthood in Western populations, the overall costs and burden to health and social care are vast(Reference Scott, de Courten and Ebeling20,Reference Kalyani, Corriere and Ferrucci21,Reference Janssen, Shepard and Katzmarzyk24) . These costs and the burden to society will also increase in the future, given the predicted increase in the prevalence of sarcopenia and its associated conditions, and the increasing age profile of Western populations.
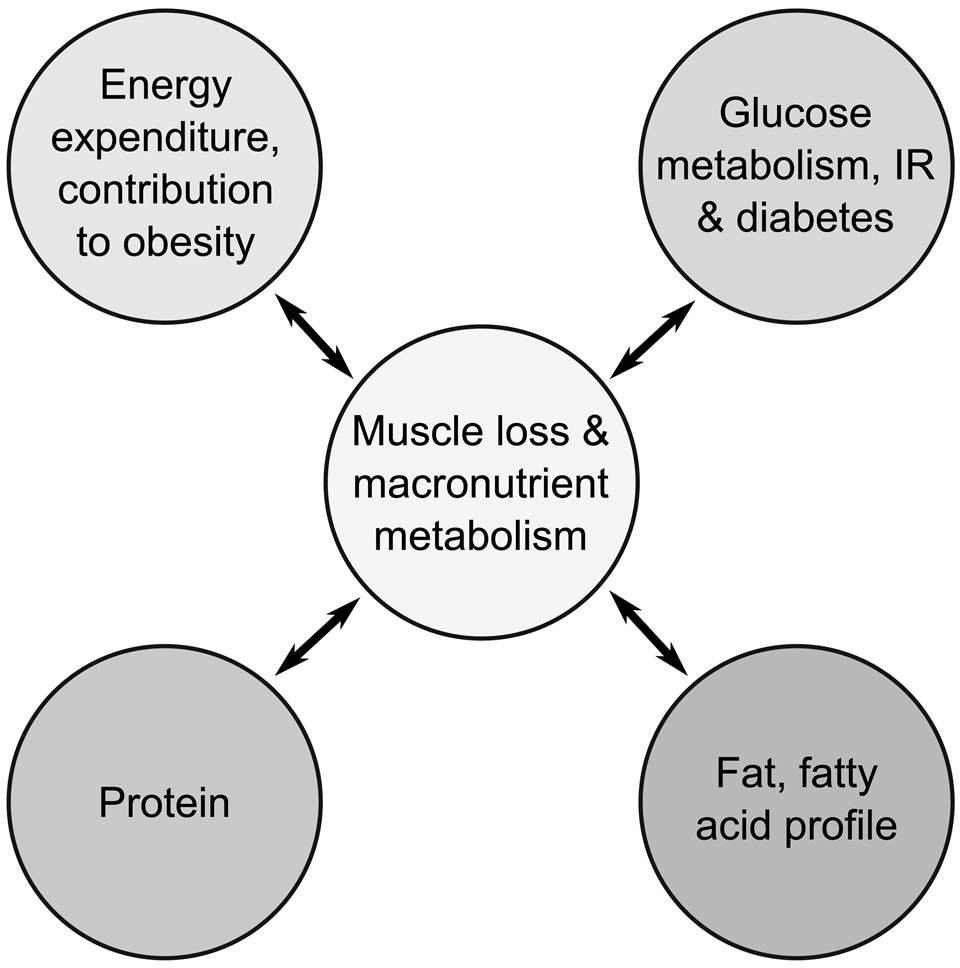
As the nutritional and metabolic consequences of the loss of skeletal muscle, and changes to skeletal muscle quality, have received less attention than the functional consequences, these aspects form the focus of this review(Reference Landi, Camprubi-Robles and Bear12). This paper provides an overview of the metabolic consequences of age-related changes and loss of SMM on the metabolism of macronutrients, particularly fat and fatty acids, and carbohydrate, and effects on overall energy expenditure during middle and older age. Morphological changes to fibre type and muscle composition in relation to macronutrient metabolism and utilisation are highlighted(Reference Patel, White and Westbury25). The effects of morphological changes and losses of SMM on resting energy expenditure (REE), and concomitant risk of onset of obesity, as well as on insulin resistance, control of blood glucose, and the contribution to the onset of type-2 diabetes are described(Reference Welch1,Reference Wolfe2,Reference Deutz, Ashurst and Ballesteros13,Reference Argiles, Campos and Lopez-Pedrosa14,Reference Scott, de Courten and Ebeling20,Reference Kalyani, Corriere and Ferrucci21) . The relationships between the effects of diabetes on further changes and loss of skeletal muscle, as well as the potential impact of certain fatty acids on quantity and morphology of skeletal muscle, are also covered, and are illustrated in Fig. 1.
Overview of the relationships between age-related changes to skeletal muscle macronutrient metabolism and utilisation, and onset of type-2 diabetes and obesity. Circulating glucose arises from metabolism of carbohydrate. IR, insulin resistance.
The effects of ageing on skeletal muscle mass and morphology
Measuring skeletal muscle and terminology
A number of methods are available for measuring total body composition in vivo, ranging from bioelectrical impedance to dual-energy X-ray absorptiometry. Measures of SMM are typically calculated from these methods. In ‘reference man’ (a traditional term, arising from early research in this area, that describes the typical body composition of adult males of an average body weight) total body mass consists of about 19 % fat mass and 81 % fat free mass (FFM), 91 % of which is lean soft tissue mass, with the remainder consisting of bone(Reference Buckinx, Landi and Cesari26–Reference Lam, Redman and Smith32). However, in women the proportion of fat mass in the body is, in the main, greater than in men and so is associated with a correspondingly lower proportion of FFM; see also section ‘Loss of skeletal muscle mass’ for further details. Development of three- and four-compartment methods for measuring SMM in populations is relatively recent, and much of the literature relating to sarcopenia and skeletal muscle refers to FFM, which has been considered a suitable measure of SMM, given that contributions from bone are small(Reference Mitchell, Williams and Atherton3,Reference Buckinx, Landi and Cesari26–Reference Heymsfield, Adamek and Gonzalez30,Reference Prado and Heymsfield33) . Appendicular lean mass or appendicular skeletal muscle mass is the sum of lean tissue in the arms and legs(Reference Buckinx, Landi and Cesari26–Reference Heymsfield, Adamek and Gonzalez30).
Scaling for body size
Since FFM increases with greater body weight and height, studies in human subjects are scaled for body size(Reference Heymsfield, Hwaung and Ferreyro-Bravo29,Reference Heymsfield, Arteaga and McManus34–Reference Schuna, Peterson and Thomas36) . Scaling can be by height, height2, as a percentage of total body weight or by BMI.
Loss of skeletal muscle mass
Skeletal muscle, measured as FFM, accounts for about 70–80 % of body weight in men and 65–75 % in women of middle and early older age(Reference Welch, Skinner and Hickson37). Losses of SMM are gradual and progressive, ranging from 0·5 to 1 % per year, starting around middle age, with rates increasing over the age of 60 years(Reference Welch1–Reference Mitchell, Williams and Atherton3). Men experience greater rates of loss during older age, although their FFM, as a proportion of body size, is greater than in women at all life stages.
Muscle morphology changes during ageing and links to fat, carbohydrate and energy metabolism
Skeletal muscle is composed of three distinct types of muscle fibre, categorised by their energy metabolism and their myosin structures: slow-twitch, oxidative, type-I fibres; fast-twitch, oxidative-glycolytic, type-IIa fibres and fast-twitch, glycolytic, type-IIb fibres. Each category of fibre also shows different capacities for fatty acid utilisation, with type-I fibres contributing more to fatty acid oxidation and being more insulin-sensitive than type-IIb fibres(Reference Pearen, Eriksson and Fitzsimmons38). Human muscle shows multiple fibre types within a single muscle group, with different proportions of fibre types in each muscle; for example, the soleus muscle in the calf has mostly type-I fibres, while the vastus lateralis muscle in the thigh is largely type II(Reference Edgerton, Smith and Simpson39). These proportions are flexible, however, and muscle fibres can remodel their phenotypes to adapt to different circumstances, including ageing(Reference Pette and Staron40).
Ageing is associated with a conversion of muscle fibres to slow-twitch, oxidative, type-I fibres, and type-II fibres are seen to atrophy and shrink in diameter, while type-I fibres are relatively unaffected(Reference Evans and Lexell41). This may relate to damage, and ultimately breakage, experienced by muscle fibres during the ageing process(Reference Bua, McKiernan and Wanagat42). Further, the total number of muscle fibres in skeletal muscle decreases with age(Reference Lexell, Henriksson-Larsén and Winblad43), along with the cross-sectional area of the muscle, which has been shown to decrease by 25–35 % in older men and women(Reference Young, Stokes and Crowe44,Reference Young, Stokes and Crowe45) . See Wilkinson, Piasecki and Atherton for a review of muscle fibre loss and atrophy with ageing(Reference Wilkinson, Piasecki and Atherton46). Measures of cross-sectional area underestimate losses in muscle contractile tissue, as muscle ageing is also accompanied by infiltration of fatty and fibrotic tissue(Reference Overend, Cunningham and Paterson47), which contributes to the disparity between mass and strength losses in sarcopenia. Fatty infiltration (myosteatosis) is related to the higher content of saturated ceramide and diacylglycerol fatty acids in older age(Reference Søgaard, Baranowski and Larsen48).
Mitochondrial effects during ageing and interaction with macronutrient metabolism
Mitochondria are also important in the context of ageing. In the cell, mitochondria are essential to metabolism as they use oxidative phosphorylation to produce a ready supply of ATP, a fundamental energy unit for cellular processes. Mitochondria in skeletal muscle form complex, anisotropic networks(Reference Kayar, Hoppeler and Mermod49) that supply energy to fuel muscle contraction. There are two distinct subpopulations of mitochondria; one directly beneath the sarcolemma, and the other between myofibrils(Reference Takahashi and Hood50). Slow-twitch oxidative muscle fibres contain many more mitochondria than fast-twitch glycolytic fibres, and are more resistant to fatigue due to the large amount of ATP generated by their mitochondria. The oxidative phosphorylation efficiency of mitochondria, their capacity to produce ATP, has been shown to decline with age(Reference Conley, Jubrias and Esselman51), and is also influenced by insulin resistance, as discussed later in this review. Mitochondria also contribute to the ageing process: dysfunctional mitochondria accumulate with age, particularly in skeletal muscle(Reference Herbst, Pak and McKenzie52), and they ultimately become senescent(Reference Wiley Christopher, Velarde Michael and Lecot53), losing the ability to proliferate. Dysfunctional mitochondria generate reactive oxygen species (ROS), and the damage associated with these is central to some pathologies, as well as ageing(Reference Jensen54–Reference Murphy56); these dysfunctional mitochondria produce a vicious cycle of damage and deterioration in ageing muscle.
The ligand binding nuclear receptors found in skeletal muscle are transcription factors involved in metabolic control within skeletal muscle; see Baskin for an elegant review(Reference Baskin, Winders and Olson57). PPAR are critical regulators of the metabolic genes in striated muscle(Reference Fan, Atkins and Yu58), with PPARα being involved in transcription of the genes required for fatty acid uptake or oxidation. PPARα activation induces fatty acid utilisation in skeletal muscle(Reference Muoio, Way and Tanner59). Also PPARγ coactivator 1 α, along with PPARα, coordinates metabolic regulation within skeletal muscle, further regulating the GLUT4, cAMP response element binding protein and nuclear respiratory factors to mediate transcription of genes involved in fatty acid and glucose metabolism(Reference Baskin, Winders and Olson57).
In summary, the total number and diameter of skeletal muscle fibres decreases with age, fibre type shifts to slow-twitch type-I fibres that are more insulin-resistant and do not utilise glucose. Mitochondria become dysfunctional, or senescent, and generate ROS that further damage muscle. Further age-related changes in skeletal muscle morphology include infiltration of non-contractile material in muscle tissue, denervation, a reduction in the number of satellite cells, and a weakening of the connections between muscle and tendons. All of these have consequences for the functional capacity of skeletal muscle, as well as its ability to regenerate when damaged. The loss of SMM and morphological changes associated with ageing have the potential to impact directly on oxidation and utilisation of fatty acids as well as glucose utilisation and energy metabolism, see Table 1.
Age-related changes to morphology and quantity of skeletal muscle and interactions with macronutrient metabolism

Protein metabolism and muscle
Skeletal muscle is the main reservoir of amino acids in the body; these are stored as protein, and are required for the maintenance of protein synthesis within skeletal muscle(Reference Wolfe2,Reference Deutz, Ashurst and Ballesteros13,Reference Argiles, Campos and Lopez-Pedrosa14,Reference Schutz60–Reference Kim, Schutzler and Schrader63) . This store is activated during deficits of energy intake, and during periods of increased demand, to satisfy the energy requirements of the body through catabolism of protein and gluconeogenesis(Reference Wolfe2,Reference Deutz, Ashurst and Ballesteros13,Reference Argiles, Campos and Lopez-Pedrosa14,Reference Schutz60–Reference Kim, Schutzler and Schrader63) . Thus, the loss of SMM with age diminishes reserves of amino acids, stored as protein with the body. Maintaining the balance between protein synthesis, anabolism, and protein breakdown, catabolism, is also crucial to conservation of skeletal muscle during ageing(Reference Wolfe2,Reference Landi, Camprubi-Robles and Bear12,Reference Deutz, Ashurst and Ballesteros13,Reference Wolfe, Miller and Miller61,Reference Deutz, Bauer and Barazzoni64) . However, several mechanisms of ageing disrupt this balance, leading to catabolism. Such mechanisms include ROS, circulation of inflammatory cytokines, and the insulin resistance that leads to type-2 diabetes(Reference Rudrappa, Wilkinson and Greenhaff22,Reference Aversa, Zhang and Fielding65) . Therefore, the onset of insulin resistance and type-2 diabetes disrupts protein synthesis, contributing to changes in SMM and morphology, as described later.
As the topic of protein in relation to skeletal muscle is covered in full elsewhere, newer aspects of research relating to skeletal muscle and its importance to metabolism of carbohydrate, fat and energy metabolism are covered in the following sections.
The effects of ageing of skeletal muscle on energy expenditure and risk of obesity
Components of energy expenditure and balance between energy intake and energy expenditure
Total daily energy expenditure (TEE) comprises three main components: (1) REE, also referred to as RMR or BMR; (2) the thermic effect of food and (3) the energy expenditure associated with physical activity. See Fig. 2 for an illustration of these. In adults, REE accounts for 60–70 % of total energy requirements in healthy adults(Reference Lam, Redman and Smith32,Reference Bogardus, Taskinen and Zawadzki66–Reference Muller, Bosy-Westphal and Kutzner69) . The proportion of REE attributable to organ mass ranges from about 5 to 10 %(Reference Lam, Redman and Smith32,Reference Muller, Bosy-Westphal and Kutzner68,Reference Muller, Bosy-Westphal and Kutzner69) . FFM is the main predictor of REE, which is determined by the metabolism of macronutrients protein, carbohydrate, fat and alcohol. The contribution of the thermic effect of food to TEE is estimated at about 10 % of TEE. The contribution of habitual and discretionary physical activity to TEE is variable, ranging from about 15 % in very sedentary people to about 50 % in those who are very physically active. TEE reduces during ageing, partly due to reductions in habitual and discretionary physical activity but also due to the loss of metabolically active FFM, which consists of both skeletal tissue and that found in the internal organs.
Components of energy expenditure, energy intake and the concept of energy balance in older adults. Energy is released from metabolism of the macronutrients protein, carbohydrate and fat as well as alcohol. Energy expenditure comprises: resting energy expenditure (REE) or BMR, daily activities and discretionary physical activity and the thermic effect of digestion of food. Greater intake of total energy than total energy expenditure results in gain in body weight.

A balance must be maintained between energy expenditure and energy intake, derived from macronutrients and alcohol, in order to maintain a steady body weight, as described in Fig. 2. Body weight increases when excess energy intake is consumed compared with total energy expended.
Metabolic rate decreases with age in relation to loss of skeletal muscle mass and in clinical conditions of ageing
In the early 20th century, age-related reductions in BMR were observed, with Lewis finding that ‘0·664 calories per hour per square meter per hour’ were lost per decade of age in men(Reference Lewis70). That this was attributable to loss of SMM with age has been elaborated with further findings during this century in both men and women. Ravussin's study in 1986 identified the key determinants of 24-h energy expenditure in man, finding that FFM explained 81 % of the variance in energy expenditure in an obese population(Reference Ravussin, Lillioja and Anderson71). Furthermore, even after accounting for physical and spontaneous activity and the thermic effect of food, FFM remained the most important determinant of energy expenditure(Reference Ravussin, Lillioja and Anderson71). Subsequent studies found that RMR was lower in older than in younger men, and this was attributable to the lower proportion of FFM in older men(Reference Fukagawa, Bandini and Young72). Zurio and colleagues also found that differences in resting muscle metabolism partly accounted for the variance in metabolic rate amongst individuals of normal body weight(Reference Zurio, Larson and Bogardus73). Overall, findings were summarised by Weinsier and colleagues in 1992(Reference Weinsier, Schutz and Bracco74).
Recent research also indicates that FFM is a key predictor of TEE even in highly active younger people(Reference Barringer, Pasiakos and McClung75). This study measured energy expenditure using the doubly labelled water technique in military personnel engaged in intensive operations. Whilst physical activity was a key predictor of energy expenditure in this group (r 0·9, P < 0·05) the association of energy expenditure with FFM was greater than that with total body mass (r 0·32, P < 0·05; and r 0·28, P < 0·05, respectively) even in this population with a high physical activity.
Sex-specific differences in the relationship between total FFM and REE have been explored further(Reference Geisler, Braun and Pourhassan67). In men and women aged 18–79 years, women experienced an earlier decline in SMM than men, starting at age 29 years v. 39 years in men. However, SMM, adjusted for fat mass, remained the main determinant of REE in both men and women, with R 2 0·67 in women and R 2 0·66 in men(Reference Geisler, Braun and Pourhassan67). More recent work also suggests that the proportion of FFM impacts on, and partially determines, energy intake and expenditure, via its mediating effect on RMR(Reference Hopkins, Finlayson and Duarte76).
During ageing, the contribution of FFM to REE declines in parallel with the age-related decline in FFM, explaining 59·7 % of the decrease in REE. This indicates that the importance of FFM to REE increases with age(Reference Geisler, Braun and Pourhassan67). This is particularly important in underweight older people with low FFM(Reference Weinsier, Schutz and Bracco74,Reference Sergi, Coin and Bussolotto77) , and the situation is exacerbated in nonagenarians(Reference Kim, Welsh and Ravussin78). Indeed, two recent studies found that decreased BMR is an objective marker for sarcopenia and frailty in older adults(Reference Kim, Welsh and Ravussin78,Reference Soysal, Ates Bulut and Yavuz79) . Thus, in elderly people who are underweight and have low physical activity, REE represents the greatest part of TEE(Reference Weinsier, Schutz and Bracco74,Reference Sergi, Coin and Bussolotto77) .
Overall, the contribution of FFM to TEE increases with age as the contribution of physical activity declines.
The effects of age-related skeletal muscle loss on metabolic rate and the onset of obesity
In middle and early-older-age the age-related decline in FFM and SMM may have implications for the onset of obesity. Obesity arises from the imbalance of energy intake and expenditure, and so the gradual loss of muscle mass with age has potential consequences for habitual energy expenditure and the energy imbalance that leads to the onset of obesity(Reference Wolfe2). Discretionary and habitual physical activity also declines during ageing, contributing to overall reductions in energy expenditure. Two studies found that skeletal muscle fibre-type proportion is related to obesity. The first found that obese men had a higher proportion of fast-twitch, type-II fibres in the vastus lateralis muscle(Reference Wade, Marbut and Round80). The second confirmed these findings in obese women and found that the effectiveness of a weight-loss intervention was positively related to the percentage of slow-twitch, type-I fibres, which contain a greater proportion of mitochondria than do fast -twitch fibres(Reference Tanner, Barakat and Dohm81), as discussed in the section ‘The effects of ageing on skeletal muscle mass and morphology’.
Robert Wolfe, in his important paper, calculated that every 10 kg of lean mass that is lost with age translates to a decrease in energy expenditure of about 418 kJ/d, assuming a constant rate of turnover(Reference Wolfe2). This is equivalent to an accumulation of about 4·7 kg fat mass per year, assuming 1 kg fat store represents 32 217 kJ. Clearly, this difference in energy expenditure would disproportionately affect older individuals, who tend to have lower levels of physical activity and thus greater potential to develop obesity, as well as sarcopenic obesity.
In summary, evidence is now clear that skeletal muscle contributes a lower proportion of REE to TEE during ageing, potentially contributing to onset of obesity from middle-age onwards.
Effects of ageing of skeletal muscle on glucose metabolism, insulin resistance and risk of type-2 diabetes
Age-related changes in skeletal muscle, in terms of loss of quantity and morphology, impact on glucose metabolism, blood glucose control, insulin resistance and onset of type-2 diabetes, as shown in Fig. 3 with the mechanisms involved as follows(Reference Welch1,Reference Wolfe2,Reference Scott, de Courten and Ebeling20,Reference Kalyani, Corriere and Ferrucci21,Reference Cleasby, Jamieson and Atherton23,Reference Phielix and Mensink82–Reference van de Weijer, Sparks and Phielix84) . Glucose, which arises from digestion of carbohydrate, is released into the bloodstream. Skeletal muscle is the organ responsible for the greatest insulin-stimulated glucose disposal in the body, accounting for about 75 % of glucose uptake(Reference Goodpaster, Park and Harris85). When skeletal muscle contractile tissue is lost during ageing, this leads to lower glucose uptake from the circulation. This and the increase in fat and ceramide infiltration is a contributory cause of insulin resistance, which is itself associated with reduced skeletal muscle mitochondrial function in older adults(Reference Fabbri, Chia and Spencer86); indeed, mitochondrial dysfunction and insulin resistance appear to reinforce one another in a feedback loop(Reference Phielix, Szendroedi and Roden87). See a review by Affourtit for more information on the links between mitochondrial function and insulin resistance(Reference Affourtit88). These links highlight an association between the loss of SMM and mitochondrial function with age with the onset of type-2 diabetes. Therefore, age-related changes in skeletal muscle have implications for the onset and treatment of type-2 diabetes(Reference Scott, de Courten and Ebeling20,Reference Phielix and Mensink82–Reference van de Weijer, Sparks and Phielix84,Reference Barsalani, Brochu and Dionne89) .
Relationships between age-related changes to morphology and quantity of skeletal muscle, glucose metabolism, insulin resistance and type-2 diabetes. The age-related changes in skeletal muscle lead to reduction in glycaemic control, increased insulin resistance and onset of type-2 diabetes. That onset of the poor glycaemic control also accelerates skeletal muscle loss and morphological changes leading to a vicious cycle of age-related muscle changes in those with type-2 diabetes.

Low skeletal muscle mass, sarcopenia and dynapenia are associated with or predict incidence of type-2 diabetes
A number of cross-sectional studies have demonstrated that low SMM is associated with insulin resistance or type-2 diabetes(Reference Scott, de Courten and Ebeling20,Reference Park, Goodpaster and Strotmeyer90–Reference Lee, Boyko and Strotmeyer96) . Existing sarcopenia or dynapenia is also a risk factor for onset of diabetes, as is low SMM(Reference Wang, Feng and Zhou97–Reference Cuthbertson, Bell and Ng99). An increased hazard risk of 2·05 (95% CI 1·73, 2·43) was associated with onset of type-2 diabetes over 9 years in those with the lowest muscle mass index (appendicular lean mass adjusted for weight), compared with the highest tertile of muscle mass index, who had double the risk(Reference Son, Lee and Kim100). Moreover, this increased risk of type-2 diabetes was due to relatively small differences in muscle mass index at baseline of only 5·4 % between those at the greatest and least risk. Subsequently, maintenance of appendicular skeletal muscle mass was also found to be protective against the development of type-2 diabetes in men but not women, independent of obesity(Reference Kim, Lee and Kim101). However, a further study contradicted this finding, as women with a higher SMM were at greater risk of incident type-2 diabetes(Reference Larsen, Wassel and Kritchevsky102).
Impact of type-2 diabetes on skeletal muscle
Evidence is building that the presence of type-2 diabetes in older people leads to significant loss of SMM over time(Reference Son, Lee and Kim100,Reference Park, Goodpaster and Strotmeyer103) . One study found that accelerated loss of SMM occurred in middle-aged and older women with diabetes(Reference Lee and Choi104); this is due to a number of disease processes, including the poor glycaemic control that is often associated with the existence of mild metabolic acidosis(Reference Sugimoto, Tabara and Ikegami95,Reference Welch, Macgregor and Skinner105,Reference Hayhoe, Abdelhamid and Luben106) . That this is the case was confirmed in a study where treatment of diabetes with insulin attenuated the decline in muscle mass(Reference Bouchi, Fukuda and Takeuchi107).
In summary, age-related changes to skeletal muscle lead to glucose dysregulation, with consequent reduction in glycaemic control, increased insulin resistance and ultimately onset of type-2 diabetes, as shown in Fig. 3(Reference Scott, de Courten and Ebeling20,Reference Phielix and Mensink82–Reference van de Weijer, Sparks and Phielix84,Reference Barsalani, Brochu and Dionne89) . These age-related changes in skeletal muscle also have implications for the progression of type-2 diabetes, with the onset of poor glycaemic control also accelerating skeletal muscle loss and the morphological changes that occur with age, leading to a vicious cycle of damage to muscle, as in Fig. 3.
Role of fat intake and metabolism on age-related muscle loss
Skeletal muscle is also central to the metabolism of dietary fat, with the fatty acids derived from fat being the main source of energy for resting and working muscle(Reference Wolfe2,Reference Spriet108,Reference Frayn109) . As discussed earlier, the ligand-binding nuclear receptor PPARα, when bound to long-chain fatty acids, activates transcription of genes involved in fatty acid uptake and oxidation, and robustly induces utilisation of fatty acids in muscle tissue(Reference Baskin, Winders and Olson57). Likewise, PPARβ and PPARγ are also involved in regulating fatty acid metabolism in skeletal muscle. Thus, reduction in SMM during ageing may also reduce the capacity for fatty acid metabolism. Also, recent but limited research in human and animal studies has identified the relevance of dietary fatty acid intake to skeletal muscle in ageing(Reference Welch, Macgregor and Minihane17,Reference Kob, Fellner and Bertsch110) .
Dietary fat intake varies significantly in terms of the total amount and the proportion of different fatty acids. Indeed, all sources of fat are mixtures of the different classes of fatty acids, including SFA, MUFA and PUFA. Considering the range of different sources of fat used in food manufacture and meal preparation, the profile of different fatty acid intakes for different individuals within and between populations can be highly variable(Reference Linseisen, Welch and Ocke111).
It is important to consider both that dietary fat is integral to the muscle membrane (the sarcolemma) and that fatty acids act as the dominant substrate for the production of ATP during aerobic exercise(Reference Spriet108,Reference Frayn109) . Long-chain NEFA circulate in the blood, and protein transporters, including fatty acid binding protein in the plasma membrane, fatty acid translocase and the fatty acid transport protein, facilitate their transfer across the sarcolemma(Reference Holloway, Luiken and Glatz112). Moreover, the specific fatty acid profile of the diet is reflected in the fatty acid composition of the sarcolemma, although this may also be altered by other physiological process including exercise stimulation of skeletal muscle(Reference Andersson, Nalsen and Tengblad113,Reference Andersson, Sjodin and Hedman114) . The profile of fatty acids is also relevant since fatty acids have been shown to be oxidised in a specific order of preference, with oleic and unsaturated fatty acids oxidised in preference to SFA(Reference DeLany, Windhauser and Champagne115).
In terms of the mechanisms behind these associations, some studies have shown that dietary fat intake can affect inflammatory status, which may have consequences for skeletal muscle. Previous observational studies have suggested that both the total fat intake and the proportion of different fatty acids may be relevant in the mechanisms leading to skeletal muscle loss and sarcopenia(Reference Welch, Macgregor and Minihane17,Reference Lipina and Hundal116) . In particular, high total fat and SFA intakes may be detrimental to skeletal muscle health, and higher proportions of PUFA (total, n-3 PUFA, n-6 PUFA), MUFA and the PUFA:SFA ratio may be beneficial(Reference Welch, Macgregor and Minihane17,Reference Lipina and Hundal116) . However, the recent Scientific Advisory Committee on Nutrition report on SFA and health made no specific comments on the effects of SFA on skeletal muscle, due to a lack of research(117). As discussed earlier, inflammation pathways are intricately involved in the processes of ageing and sarcopenia. High intakes of total fat and SFA are typically viewed as risk factors for inflammation, while n-3 PUFA are more recognised for their anti-inflammatory properties and potential for increasing protein synthesis(Reference Welch, Macgregor and Minihane17,Reference Lipina and Hundal116,Reference Calder, Albers and Antoine118–Reference Tachtsis, Camera and Lacham-Kaplan120) . However, despite this, a recent systematic review and meta-analysis of randomised controlled trials found little or no association of n-3, n-6 and total PUFA on skeletal muscle outcomes, largely due to insufficient evidence of high quality(Reference Abdelhamid, Hooper and Sivakaran16).
One inflammatory mediator previously shown to be found in higher concentrations in older individuals is IL-6(Reference Ferrucci, Corsi and Lauretani121). This molecule is produced in skeletal muscle and is known to affect both glucose and fatty acid metabolism in muscle(Reference Maggio, Guralnik and Longo122). Indeed, it has been hypothesised that IL-6 is a key factor in insulin resistance, and thus increased concentrations in the elderly may have important metabolic consequences.
As described earlier with reference to insulin resistance, during ageing there is an increase in the lipid infiltration within skeletal muscle fibres (myosteatosis) and an associated reduction in the oxidative capacity of the muscle. This change in skeletal muscle composition is affected by dietary fat intake, as shown in animal work where significantly higher muscle lipid deposition was seen in mice fed on a high-fat diet v. those fed a control diet(Reference Collino, Mastrocola and Nigro123). This lipid deposition may lead to mitochondrial dysfunction, decreasing ATP production and increasing ROS production, and it may also result in insulin resistance. ROS can act as second messengers for TNF-α in skeletal muscle tissue and can result in NF-κB activation, causing an increase in IL-6(Reference Kosmidou, Vassilakopoulos and Xagorari124). The resulting increased inflammatory state may be of further detriment to normal skeletal muscle health. Observational study data have shown frail adults to have higher levels of intramuscular adipose tissue than non-frail individuals, and the quantity of intramuscular adipose tissue is significantly positively associated with IL-6 expression and protein within the muscle(Reference Addison, Drummond and LaStayo125). It is not clear whether the predominant direction of the relationship is that an inflammatory environment in the muscle exacerbates lipid infiltration, or conversely that an increase in inflammatory signalling molecules is a result of fat infiltration, but both may occur. Irrespective of this, the close proximity of fat to the muscle in the event of inflammatory cytokine release is likely to result in more profound effects on skeletal muscle dysfunction than of a more systemic increase in inflammatory load.
In summary, there is an important role for fatty acids in skeletal muscle health during ageing through mechanisms including fatty acid infiltration and enhanced inflammatory status, with consequences for metabolism and further adverse knock-on effects to SMM and function, see Fig. 4. While total fat intake is relevant, the balance between different fatty acids in the diet appears to be particularly important(Reference Ferrucci, Corsi and Lauretani121,Reference Maggio, Guralnik and Longo122) .
Relationships between age-related changes to morphology and quantity of skeletal muscle and fatty acid metabolism. This figure summarises the relevance of fatty acids to skeletal muscle changes during ageing, including increased loss of muscle mass, increased ceramide and fat infiltration and reduced ATP production. High total fat intake may cause some skeletal muscle changes directly, but may also act via inflammatory pathways (also affected by high SFA:PUFA dietary ratios). Decreased fatty acid utilisation as a result of skeletal muscle changes may feedback so the process continues.

Conclusions
Age-related changes in skeletal muscle in terms of quantity and morphology have important consequences for the metabolism and utilisation of macronutrients. Recent research indicates these age-related changes to skeletal muscle have the potential to impact directly on oxidation and utilisation of fatty acids as well as glucose utilisation and energy metabolism. Evidence is now clear that age-related changes to skeletal muscle contribute to lower REE during ageing, potentially playing a part in the onset of obesity from middle-age onwards. The effects of age-related changes in skeletal muscle that lead to glucose dysregulation, reduction in glycaemic control, increased insulin resistance and onset of type-2 diabetes are beginning to be recognised. That the onset of the poor glycaemic control also accelerates skeletal muscle loss and morphological changes leading to a vicious cycle of age-related muscle changes in those with type-2 diabetes is also important. There is also an important role for fatty acids in skeletal muscle health during ageing, from both total fat intake and the balance between different fatty acids in the diet, with metabolic consequences of fatty acid infiltration in muscle and altered inflammatory status causing negative effects on SMM and function. Further work is required to determine whether the role of fatty acids in skeletal muscle differs by sex and by age group.
Practical public health messages for people of middle and older age
There is a need to conserve skeletal muscle during middle and early older age, particularly for maintaining metabolic response to dietary macronutrients: carbohydrate (glucose), fat and protein during ageing. Whilst not the focus of the present paper, there is also growing evidence that certain vitamins and minerals such as vitamin C, carotenoids, magnesium and patterns of dietary intake are likely important for maintenance of skeletal muscle health, and could have a positive impact on protein synthesis in skeletal muscle(Reference Welch1,Reference Landi, Camprubi-Robles and Bear12,Reference Welch, Skinner and Hickson37,Reference Robinson, Reginster and Rizzoli126–Reference van Dronkelaar, van Velzen and Abdelrazek131) .
To date there are no dietary recommendations specifically for older people, or for maintaining skeletal muscle health during ageing, and such recommendations need to be developed(Reference Wolfe2). We also do not know whether these recommendations would need to differ between men and women of older age. Until recommendations are made, research evidence suggests that public health practitioners should encourage individuals to follow healthy eating patterns that meet the current dietary guidelines, in particular reinforcing the importance of eating five fruit and vegetables daily, consuming adequate protein (0·8 g/kg), and limiting SFA and total fat intake.
Physical activity and exercise are clearly important for maintaining and building skeletal muscle at all ages. So both individual and population approaches for maintaining physical activity are required(Reference Deutz, Ashurst and Ballesteros13,Reference Piercy, Troiano and Ballard132) . Older people should focus on resistance exercise or training, alongside activities that promote endurance and flexibility, since resistance training promotes rates of protein synthesis(Reference Deutz, Ashurst and Ballesteros13,Reference Piercy, Troiano and Ballard132) . This is particularly important for those with sarcopenic obesity and type-2 diabetes and for maintaining blood glucose control in diabetes(Reference Mori, Kuroda and Matsuhisa133).
Clinicians and service providers, such as medical doctors, nurses and dietitians responsible for clients in middle and later life need to be particularly aware of the metabolic effects of skeletal muscle loss with ageing on the metabolism of macronutrients and energy expenditure. In their practice they should also be aware of these links to the prevention of obesity and their impact on the onset and treatment of type-2 diabetes.
Given the clear importance of maintaining SMM and quality with regard to the metabolism and utilisation of macronutrients and overall energy expenditure, as well as links to obesity and type-2 diabetes, more research is needed on how to preserve healthy skeletal muscle during ageing.
Financial Support
None.
Conflict of Interest
None.
Authorship
The authors had joint responsibility for all aspects of preparation of this paper.


