


Ultra-processed foods and formulations of ingredients, primarily of exclusive industrial use and typically created by a series of industrial techniques and processes, are increasingly dominating our food supply chains. Ultra-processed foods are mostly ready-to-consume, hyper-palatable and profitable branded products designed to displace other food groups(Reference Monteiro, Cannon and Moubarac1). Consumption of ultra-processed foods has been associated with a range of detrimental health outcomes in epidemiological studies, including an increased risk of all-cause mortality, CVD, hypertension, metabolic syndrome, overweight and obesity(Reference Chen, Zhang and Yang2). Whilst there is increasing evidence that consumption of ultra-processed foods may be damaging to human health, its environmental impacts are poorly quantified. Current evidence only considers the effects of primary commodities used for their production rather than capturing the overall impact of ultra-processed foods from farm to fork, including processing, packaging and distribution(Reference Seferidi, Scrinis and Huybrechts3).
Many ready meals, defined as pre-prepared main courses sold in a pre-cooked form that only requires pre-heating prior to consumption, can be classified as ultra-processed foods. The UK has one of the largest ready meal markets globally, with a market value of over £3·9 billion(Reference O’Mahony4). It is estimated that 88 % of the UK adult population eat ready meals, with two out of five people eating them every week(5). Chilled ready meals make up 70 % of the UK ready meals market share, with frozen meals occupying the remaining 30 %(Reference Rivera and Azapagic6). Some of the main drivers for the steady rise in the purchase and consumption of ready meals include time scarcity in modern life, more women in the workplace, varying eating times, lack of cooking skills or dislike of cooking, and a growing number of single households(Reference De Boer, McCarthy and Cowan7,Reference Jabs and Devine8) .
Like most ultra-processed foods, ready meals are generally energy-dense and contain higher levels of low-cost ingredients such as saturated and trans-fats, refined starches, free sugars and salts, whilst being low in fibre and micronutrients(Reference Monteiro, Cannon and Moubarac1). Besides their poor nutritional profile, another main concern is that greenhouse gas emissions (GHGE) from the consumption of ready meals in the UK currently contribute 15·7 % of the total annual GHGE from the UK food and drink sector(Reference Rivera and Azapagic6). Also, it is estimated that ready meals represent 8 % of the total per capita carbon budget related to food production for the climate target of limiting warming to 2°C(Reference Rivera and Azapagic6). A few studies have compared the environmental effects of consuming ready meals v. home-cooked meals, with one study finding that the environmental impact of homemade meals was lower because of avoidance of meal manufacturing, reduced refrigeration and a lower amount of waste in the life cycle of the homemade meal(Reference Rivera, Orias and Azapagic9). However, another study noted that the differences in environmental impact between both ready and homemade meal options were small and highlighted that homemade meals had a higher environmental impact than semi-prepared or ready-to-eat meals(Reference Sonesson, Mattsson and Nybrant10).
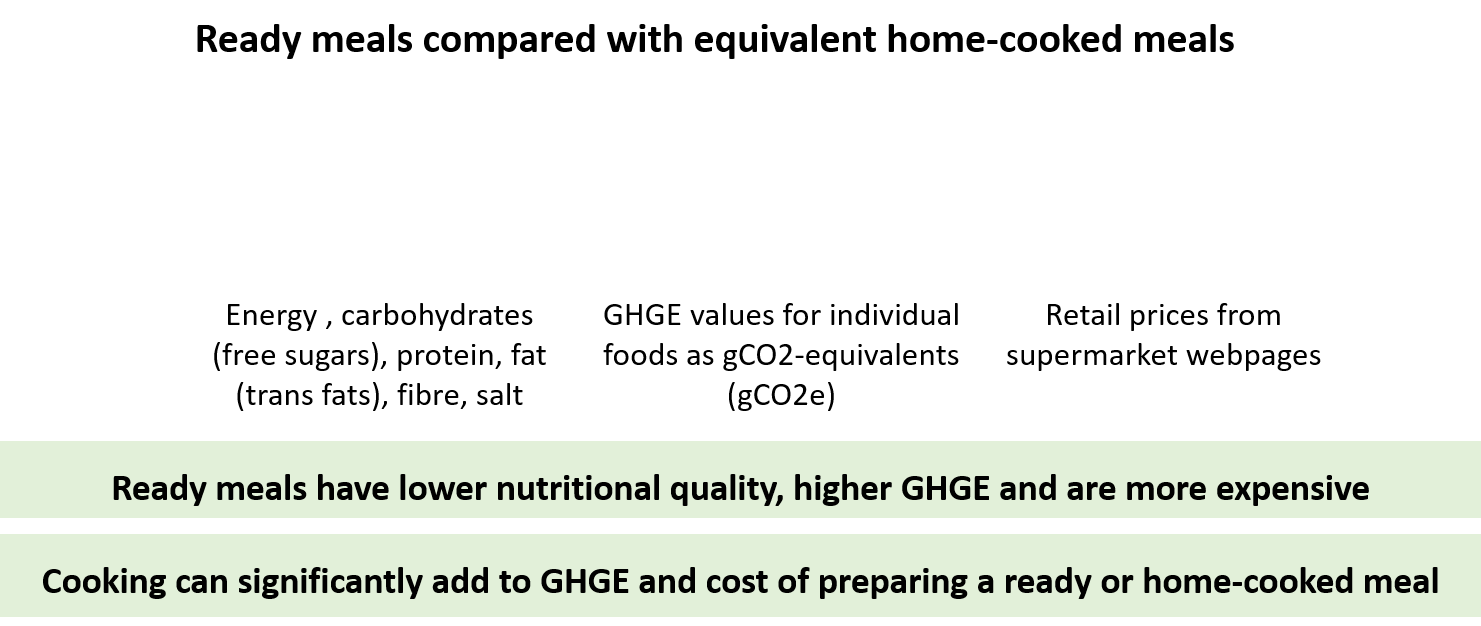
This study aimed to assess how ready meals compared with equivalent home-cooked meals in terms of nutritional quality indicators and GHGE, but also in terms of cost, in main meals consumed in the UK. Indeed, affordability is an essential determinant of food choice by consumers in the UK and a pivotal contributor to socio-economic inequalities when considering the healthiness of food and drink choices(Reference Pechey and Monsivais11–14).
Methods
Data
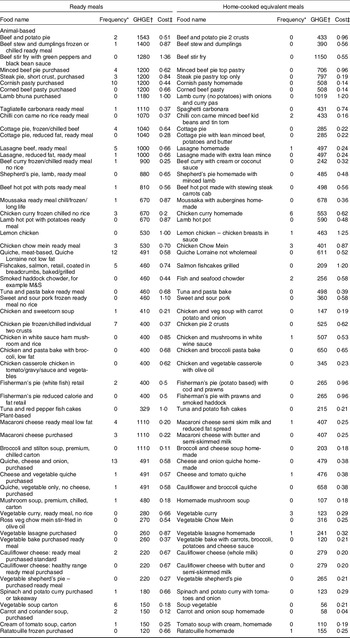
We performed a secondary data analysis using the National Diet and Nutrition Survey (NDNS) nutrient database year 11 (2018/19)(15–17). The NDNS nutrient databank contains compositional data from the nearly 6000 foods, drinks and prepared dishes available in the UK, including home-cooked and ready meals. Of these, we selected all main course meals, chilled or frozen, that needed to be heated prior to consumption, sold within a container, and had an equivalent home-cooked version in the NDNS nutrient database. As a result, we included fifty-four main courses with data on nutrient profile, and on frequency of consumption over 4 d, in 444 participants (Table 1).
Ready meal dishes, and home-cooked equivalent dishes, including frequency of consumption, GHGE and cost per dish

* Frequency of consumption across all participant’s (n 444, NDNS 2018/2019) 4-d dietary recalls.
† GHGE per 100 g of product up to supermarket shelf.
‡ Cost per 100 g of product.
Nutritional quality indicators
Relevant indicators of nutritional quality, including total kilocalories, carbohydrates (including free sugars), protein, fat (including trans-fats), fibre and salt, were selected based on previous publications reporting on differences in nutritional quality between ready-made and home-cooked meals(Reference Howard, Adams and White18,Reference Remnant and Adams19) . These indicators were estimated per 100 g of a meal.
Greenhouse gas emissions
GHGE values for individual foods and ready meals expressed as gCO2 equivalents (gCO2e) were obtained from a range of open-access sources, including academic studies, retailers and producers published between 2008 and 2016(20,Reference Bates, Chambers and Craig21) , added to the NDNS nutrient databank(Reference Bates, Chambers and Craig21,Reference Aceves-Martins, Bates and Craig22) . GHGE values were based on the emissions of six greenhouse gases which were converted into an equivalent amount of carbon dioxide (CO2 equivalent or CO2e), based on the relative global warming impact of each gas, and the final carbon footprint was expressed as the weight of carbon dioxide(20). The climate metric used to aggregate the GHGE measurements into CO2e were those reported by Department for Environment Food and Rural Affairs, UK(23). GHGE values from studies using complete cradle-to-grave life cycle analysis (LCA)(20), obtained following the international PAS 2050 standard(24), were selected where possible. We identified CO2e for 153 food and drink items in the NDNS nutrient databank, and where a GHGE value for a specific item was not available, reasonable substitute data were discussed and imputed by a team of three nutrition scientists, based on the food type, food group and compositional similarity of the products.
To estimate the GHGE for home-cooked meals, we estimated GHGE of the raw ingredients, establishing the weight of each ingredient and the weight of the whole cooked meal using Nutritics, which is nutrition management software for recipe and menu management, food labels, diet and activity analysis, and meal planning (Nutritics Ltd). Based on BBC Good Food(25) and Sainsbury’s recipes(26), we established cooking methods and times. For home-cooked meals requiring more than one cooking method, GHGE data for each cooking method were added together. In addition, we recorded the longest cooking time suggested for the frozen versions of ready meals. If there was more than one suggested cooking method (e.g. oven and microwave), data for both methods were recorded separately.
To estimate the full GHGE until serving the meal, we combined the GHGE from the recipes’ ingredients or ready meals (value up to the supermarket shelf), which include emissions due to land use change, farm-related emissions, animal feed, processing, transport, retail and packaging) with GHGE produced by the different cooking methods. For the latter, GHGE of cooking appliances were based on manufacturer information(Reference Frankowska, Rivera and Bridle27) and adjusted to the conversion factors provided by the UK government in 2021(28) and cooking time (Equation 1):
 $$GHG{E_{total}} = GHG{E_{up\;to\;shelf}} + {{{{a\, \times \,b} \over {60}}\times100} \over c}$$
where a is the cooking time, b is the GHGE of cooking appliances based on manufacturer information and adjusted to the conversion factors given by the UK government 2021, and c is the weight of the recipe or ready meal product.
Cost
For ready meals, we used the retail prices from the supermarket/products webpages (last accessed in January 2022) to estimate the total cost per 100 g. We used the price per serving of home-cooked meals published on either the BBC Good Food(25) or Sainsbury’s(26) recipes website (last accessed on November 2021). If prices were not available, we estimated the cost of the raw ingredients established the weight of each ingredient and the weight of the whole cooked meal using Nutritics (Nutritics Ltd). We added the costs from each ingredient to get the total cost for the meals and then estimated the total cost per 100 g. Our analysis did not include the costs for reheating or cooking the meals.
Analysis
We analysed nutritional quality and estimated total GHGE (values up to supermarket shelf plus GHGE after cooking) and cost for each of the fifty-four ready meals and fifty-four equivalent home-cooked meals. Distributions of data were analysed visually, and Shapiro–Wilk tests were performed to test normality for each outcome (online Supplementary Table 2). These tests suggested significant non-normality; hence, non-parametric tests (median differences) were selected for analysis. Mann–Whitney tests were used to compare nutritional values, GHGE and cost between ready meals and their equivalent home-cooked meals. The percentage change was estimated from GHGE values up to supermarket shelves and after cooking, and statistical significance was assessed through paired t test analysis. We expressed data in medians and interquartile ranges (IQR). Statistical significance was estimated at P < 0·05, but a Bonferroni correction was included in the analysis to control the family-wise error. We performed a sub-analysis of plant- v. animal-derived meals because of the published evidence on differences in nutritional quality and GHGE between these meals(Reference González-García, Esteve-Llorens and Moreira29).
Data were visualised with Tableau software, and statistical analysis was performed in R software using the libraries ‘ggthemes’, ‘tidiverse’ ‘for data visualisation and graphs), ‘dplyr’ (for testing normality), ‘psych’ and ‘pastecs’ (for descriptive statistics).
Results
Of the fifty-four ready meal and home-cooked meal main courses we identified in the NDNS nutrient database (Table 1), 65 % were animal-based and 35 % were plant-based. Ready meals, overall and those that were animal-based had significantly higher levels of free sugar per 100 g of product, compared with equivalent home-cooked meals (P < 0·0001 and P < 0·0004, respectively). Animal-based ready meals had significantly higher levels of GHGE (up to supermarket shelf) per 100 g of product (P < 0·001), whereas the cost of ready meals, overall, was significantly higher per 100 g of product (P < 0·001), compared with equivalent home-cooked meals (Table 2). Across ready meals and equivalent home-cooked meals, animal-based meals had significantly higher levels of protein (P < 0·0001), contained significantly more kilocalories per 100 g of product (P = 0·001), had significantly higher levels of GHGE (up to supermarket shelf) per 100 g of product (P < 0·0001), and were significantly more expensive (P < 0·0001), compared with plant-based meals (Table 2).
Differences in nutritional quality, greenhouse gas emissions between ready meals and equivalent home-cooked meals, and between animal-based meals and plant-based meal variants

GHGE, greenhouse gas emissions up to supermarket shelf; gCO2e, gCO2 equivalents; GBP, Great British pound £; Prm-hc, P-value of difference between ready meals and equivalent home-cooked meals; Pab-pb, P-value of difference between animal-based and plant-based meals, across ready and home-cooked meals.
Data represent medians and interquartile range (IQR).
* Statistical significance, adjusted using Bonferroni correction, estimated at a P-value < 0·0016.
Stove and microwave cooking of ready meals and equivalent home-cooked meals generally resulted in a small increase in GHGE, adding on average 1–4 % to ‘up to supermarket shelf’ GHGE. Oven cooking of ready meals and equivalent home-cooked meals resulted in much higher increases in GHGE, adding on average 19 and 8 %, respectively, to ‘up to supermarket shelf’ GHGE. Ready meals, overall and those that were animal-based, had significantly higher levels of GHGE, after cooking, compared with equivalent home-cooked meals (P < 0·0005). Levels of GHGE, after cooking, were significantly higher for animal-based meals than for plant-based meals, (P < 0·0027), across meals and cooking methods (Fig. 1, Table 3).
Distribution of GHGE per cooking method, type and origin of the meals. gCO2e,gCO2 equivalents. Boxplots presenting median values. Whisker’s extension to data within 1·5 times the interquartile ranges. Darker grey within and bar shows the lower whisker, and the lighter grey, the higher whisker. No homemade meal recipe required the use of microwave, and hence no comparison among ready meals and homemade meals was feasible for this cooking method. Oven-cooked ready meals had significantly higher levels of GHGE compared with equivalent home-cooked meals (P < 0·05). Cooking generally resulted in a significant increase in GHGE across all meals and cooking methods (P < 0·05). Across meals and cooking methods, GHGE values after cooking meals that were animal-based were significantly higher than GHGE values for plant-based meals (P < 0·005) (Table 3). Gas and electric stove-cooked meals: n 62 (twelve ready meals of which five animal-based and seven plant-based; and fifty home-cooked meals of which thirty-three animal-based and seventeen plant-based). Microwave-cooked meals: thirty-nine ready meals of which twenty-five animal-based and fourteen plant-based. Oven-cooked meals: n 77 (forty-six ready meals of which fifty-two animal-based and twenty-five plant-based; and thirty-one home-cooked meals of which twenty animal-based and eleven plant-based)

Differences in greenhouse gas emissions between ready meals and equivalent home-cooked meals, and between animal-based meals and plant-based meal variants, by cooking method

GHGE, greenhouse gas emissions; gCO2e, gCO2 equivalents; N/A, not applicable; Prm-hc, P-value of difference between ready meals and equivalent home-cooked meals; Pab-pb, P-value of difference between animal-based and plant-based meals after cooking.
Data represent medians and interquartile ranges (IQR). None of the retrieved recipes for the homemade version of the meals reported the use of microwave. Cooking generally resulted in a significant increase in GHGE across all meals and cooking methods (P < 0·05).
* Statistical significance, adjusted using Bonferroni correction, was estimated at a P-value < 0·0027. No homemade meal recipe required the use of microwave, and hence no comparison among ready meals and homemade meals was feasible.
Overall, the most environmentally friendly and affordable (i.e. cheaper) products were plant-based home-prepared meals cooked on the gas or electric stove. Some examples include vegetable chow mein, ratatouille, spinach and potato curry with tomatoes and onion, vegetable curry or carrot and onion soup. In contrast, animal-based ready meals, either cooked in the oven or the microwave, produce the highest levels of GHGE and were the most expensive (online Supplementary Fig. 1).
Discussion
This study explored how ready meals compared to equivalent home-cooked meals in terms of nutritional quality, GHGE and cost in dishes relevant to the UK market. All ready meals, but especially animal-based ready meals, had significantly higher levels of free sugars compared with equivalent home-cooked meals. In addition, ready meals had significantly higher GHGE than home-cooked meals up to the supermarket shelf, with cooking adding further GHGE, depending on the cooking method. Generally, ready meals costed significantly more (£0·30/100 g more) than their equivalent home-cooked meals. Animal-based oven-cooked ready meals had the highest levels of GHGE and were most expensive, whereas plant-based home-prepared meals cooked on the gas or electric stove had the lowest GHGE and costed least.
Diet-based studies have already shown that reductions in animal-based foods reduce GHGE, increase the nutritional quality and reduce the costs of total diets(Reference Willits-Smith, Aranda and Heller30) but thus far food-based studies are mostly lacking. No previous papers have compared ready meals to equivalent home-cooked meals in terms of nutritional quality, GHGE and/or cost; when such indicators were used, the research focused either on ready meals or home-cooked meals(Reference Mills, Brown and Wrieden31,Reference Wolfson, Willits-Smith and Leung32) . From a nutritional perspective, we did not find that ready meals were higher in salt, in line with one study(Reference Naruseviciute, Whybrow and Macdiarmid33) whilst other studies did observe higher salt levels in ready meals(Reference Howard, Adams and White18,Reference Kanzler, Manschein and Lammer34,Reference Kanzler, Hartmann and Gruber35) . However, it should be noted that the amount of salt added during cooking can vary, and furthermore, the salt content for home-cooked meals may be underestimated as many people cook with ‘salt to taste’ and may add more to the meal they consume. We did not find significant differences in the content of trans-fat, fibre and energy between ready meals and equivalent home-cooked meals, as has been observed in other studies(Reference Howard, Adams and White18,Reference Remnant and Adams19,Reference Naruseviciute, Whybrow and Macdiarmid33) . This is relevant because previous studies have argued that increased consumption of ready meals was associated with a higher energy intake, poor compliance with national nutritional recommendations and abdominal obesity(Reference Alkerwi, Crichton and Hébert36).
Our data on GHGE is in line with those presented by Reynolds (2020)(Reference Reynolds37), who found cooking to contribute between 8 and 84 % to total GHGE, with the environmental impact of cooking meats being higher than cooking vegetables. In our data, the main differences in GHGE align with the well-documented differences between plant- and animal-based meals, and differences due to the cooking method and cooking time, which are usually shorter for plant-based meals than animal-based meals. However, our data also showed that different cooking methods differentially contributed to GHGE, with oven cooking producing most GHGE, but with other cooking methods like gas and electric stove, and microwave cooking, contributing less than 10 % of total GHGE. In addition, recipes for the same type of meal can vary considerably, thereby affecting the environmental impact(Reference Rivera and Azapagic6). For example, replacing meat with soya and seitan could reduce the environmental impact by up to 27 %(Reference Rivera and Azapagic6). In our study, homemade meals were cheaper, had lower GHGE and had a better nutritional quality up to a supermarket shelf, which may be partly due to differences in nutrient composition.
Large food producers and supermarkets can influence the way we eat by offering healthier, more environmentally sustainable and affordable choices. The sector of plant-based meals is currently the fastest-growing food category in the UK, with a growth of 92 % since 2018(Reference Better38). Furthermore, a recent study highlighted that adequate labelling of ready meals could help improve food consumption-related climate change and health issues(Reference Macdiarmid, Cerroni and Kalentakis39). Therefore, cooking instructions on the back of the packaging may encourage consumers to choose the cooking method causing the least GHGE. Using cooking methods such as slow cookers, pressure cookers and microwaves, all of which have a lower energy use, would significantly lower GHGE from home-cooking(Reference Frankowska, Rivera and Bridle27).
The strengths of this study include considering three dimensions (nutritional quality indicators, GHGE and cost) that are important for healthy, environmentally sustainable and affordable food choices. Previous studies have considered the estimation of GHGE of recipes or meals(Reference Reynolds37,Reference Reynolds, Takacs and Klimashevskaia40,Reference Reynolds41) ; however, our current analysis also includes the cost of the meals. We also studied a larger number of ready meals and equivalent home-cooked meals than many previous studies, particularly concerning their GHGE(Reference Naruseviciute, Whybrow and Macdiarmid33). We also considered the differences in GHGE and cost across animal- and plant-based meals, which is relevant considering the importance of moving towards less meat-intensive diets in order to reduce GHGE(Reference Macdiarmid, Cerroni and Kalentakis39). Lastly, this study used more up-to-date data than previous studies, which is essential as ready meals are constantly being reformulated based on salt and sugar reduction targets.
An important limitation of this study is that we did not include the cost of reheating or cooking in our analysis. This is important considering that home-cooked meals can be up to six times more expensive after cooking than ready meals(Reference Howard, Adams and White18,Reference Naruseviciute, Whybrow and Macdiarmid33) , and consumers may purchase ready meals because these are quicker and cheaper to (re)heat in the microwave. Thus, whilst we found that ready meals, overall and those that are plant-based, cost significantly more than equivalent home-cooked meals, based on a large selection of meals, a previous study found that ready meals were no more expensive than buying the ingredients for home-cooked meals when considering the ten most frequently purchased ready meals in a sample of Scottish households(Reference Naruseviciute, Whybrow and Macdiarmid33). Furthermore, we did not consider the cost of household labour, which might be typically valued at the wage level of the household meal preparer, and this could be significant(Reference Rose42). These issues will need to be interpreted in the context of additional cooking costs. Another limitation of our study is that we did not examine artificial preservatives, stabilisers, colourings or flavours as part of the nutritional quality of the meals(Reference Johnson, Jung and Jin43). Also, no side dishes were considered, and all our measurements were expressed per 100 g of the meal. Thus, we did not consider the possible differences in portion sizes between home-cooked meals and ready meals. For example, ready meals are typically bought to provide for one or sometimes two portions, whilst home-cooked meals are often prepared as multiple portions. As in our study, values of GHGE were expressed per 100 g of product, and our calculations may have led to relatively higher GHGE (per 100 g of product) for ready meals, compared with equivalent home-cooked meals.
In conclusion, whilst the purchase and consumption of ready meals in the UK has increased in the past years, homemade meals have better nutritional characteristics, are cheaper and have lower GHGE, especially those that are plant-based. However, cooking can add to GHGE and the cost of preparing a ready or home-cooked meal, and better dissemination of this information to the consumer could potentially lead to more healthy, sustainable and affordable meal choices.
Acknowledgements
Acknowledgements: Ruth L. Bates, Leone C.A. Craig, Neil Chalmers, Graham Horgan and Bram Boskamp were involved in data curation of the expanded NDNS Nutrientbank version used in this study. Financial support: This research was funded by the Scottish Government’s Rural and Environment Science and Analytical Services Division (RESAS) and responsive opportunity funding from the Scottish Environment, Food and Agriculture Research Institutes (SEFARI). Authorship: M.A.-M., P.D. and B.d.R. formulated the research question and designed the study. All the authors were involved in collecting the relevant data used in the analysis of this study. All the authors contributed to writing the article. Ethics of human subject participation: This study was based on secondary analysis of data in the NDNS nutrient database, and other publicly available data, and no ethical approval was needed.
Conflict of interest:
The authors have no conflict of interest.
Supplementary material
For supplementary material/s referred to in this article, please visit https://doi.org/10.1017/S1368980023000034


 Open access