

Nutritional and metabolic exposure during critical periods of early development can have a long-term programming effect on health in adulthood (Demmelmair et al. Reference Demmelmair, von Rosen and Koletzko2006). This so-called ‘nutritional or metabolic programming’ has been described not only in mammals (de Moura & Passos, Reference de Moura and Passos2005; Langley-Evans et al. Reference Langley-Evans, Bellinger and McMullen2005; Wu et al. Reference Wu, Bazer, Wallace and Spencer2006), but also in avian species. A large number of studies have been done in chicken to investigate the long-term effect of early nutritional manipulation on body and organ growth (Deaton, Reference Deaton1995; Kwakkel et al. Reference Kwakkel, Hof, Zandstra and Ducro1998; Lee & Leeson, Reference Lee and Leeson2001), digestion (Palo et al. Reference Palo, Sell, Piquer, Soto-Salanova and Vilaseca1995a, Reference Palo, Sell, Piquer, Vilaseca and Soto-Salanovab; Pinheiro et al. Reference Pinheiro, Cruz, Sartori and Vicentini Paulino2004), reproduction (Goerzen et al. Reference Goerzen, Julsrud and Robinson1996), immunity (Khajavi et al. Reference Khajavi, Rahimi, Hassan, Kamali and Mousavi2003), lipid metabolism (Zhong et al. Reference Zhong, Nakaue, Hu and Mirosh1995), and metabolic disorders (Acar et al. Reference Acar, Sizemore, Leach, Wideman, Owen and Barbato1995; Su et al. Reference Su, Sorensen and Kestin1999). Early feed restriction (ER) has been reported recently to influence satellite cell mitotic activity (Moore et al. Reference Moore, Ferket and Mozdziak2005a, Reference Moore, Ferket and Mozdziakb), implying a possible long-term effect of early nutrition on skeletal muscle development in the chicken.
Skeletal muscle accounts for 40–50 % of the body weight and contributes to the regulation of metabolic homeostasis of the body. Skeletal muscle consists of various types of myofibres with different metabolic profiles, contractile properties, as well as biochemical and biophysical characteristics, such as fibre size, colour, glycogen and lipid content (Ashmore & Doerr, Reference Ashmore and Doerr1971). Slow-twitch myofibres (SM) are the smallest, oxidative fibres with red colour, high lipid content and many mitochondria, whereas white fast-twitch fibres (FWM) are the largest glycolytic fibres possessing high glycogen content and few mitochondria. Red fast-twitch myofibres (FRM) are intermediate oxidative-glycolytic fibres that are similar to SM in colour but resemble FWM in their contractile property, possessing both aerobic and anaerobic metabolic capabilities. Recently, myofibre-type composition of skeletal muscle has attracted great attention both in human health and animal production, owing to its close association with insulin sensitivity in mammals (Hickey et al. Reference Hickey, Carey, Azevedo, Houmard, Pories, Israel and Dohm1995; Korach-Andre et al. Reference Korach-Andre, Gounarides, Deacon, Beil, Sun, Gao and Laurent2005) and its significance for lean-mass deposition and meat quality in meat-producing animals (Maltin et al. Reference Maltin, Balcerzak, Tilley and Delday2003), respectively. However, the long-term effect of early nutrition on skeletal muscle growth and myofibre type in poultry has not been reported.
Since myofibres undergo a highly regulated process of fibre conversion and hypertrophy which contributes to lean-mass deposition and metabolic status of the organism in the postnatal period, we hypothesized that early nutritional deficiency would affect myofibre-type composition, and this influence could be carried over through later life after a long term of ad libitum feeding. The acting mechanism may involve growth-related genes expressed in the muscle that respond to the early nutritional deficiency and participate in the regulation of myofibre-type conversion and myofibre hypertrophy.
The objectives of the present study were, therefore, to observe the immediate and long-term effects of ER on body and muscle growth, as well as the myofibre composition with both histochemical and molecular typing, and to explore the associated changes of mRNA expression for growth-related genes in the muscle, employing crossbred broiler chickens as the experimental model.
Materials and methods
Animals and experimental design
Newly hatched San Huang chicks (a crossbred local broiler breed) were purchased from a commercial hatchery (Wen's Group, Guangdong, China) and allocated randomly into the control and the ER groups (n 40/group). The diets used in the experiment were formulated according to the nutritional requirements of the breed recommended by the breeding company (Table 1). Chickens in the control group were fed ad libitum for the whole period of investigation, while the ER group were subjected to feed restriction with feed provided on alternate days from hatch to 14 days of age (14 d), followed by ad libitum feeding until the end of the experiment at 63 d when chickens reached the marketing age.
Nutritional composition of the basal diet

The body weight of chickens was recorded weekly after being fasted overnight (n 40/group in first 2 weeks and n 20/group after 14 d). Feed consumption was recorded weekly. At 14 d and 63 d respectively, 10 chickens were randomly selected from each group and sacrificed for blood and tissue sampling. One side of the lateral gastrocnemius muscle was weighed and rapidly frozen in liquid N2, then stored at − 80°C until RNA isolation, while the other side was taken for measuring the cross-sectional areas and densities of SM, FRM and FWM with myosin ATPase staining.
The experiment was undertaken following the guidelines of the regional animal ethics committee.
Radioimmunoassay for serum hormone levels
The serum concentrations of total triiodothyronine (T3) and thyroxine (T4) were measured with RIA using commercial kits purchased from the Shanghai Institute of Biological Products (Shanghai, China). The kits were validated for measuring avian serum samples (Zhao et al. Reference Zhao, Wang, Zhou, Ni, Lu, Grossmann and Chen2004a).
Histochemical analysis
Myosin ATPase staining was applied to identify myofibre type and to measure myofibre size. Briefly, muscle blocks were excised perpendicularly to the direction of the myofibres. Freshly excised muscles were mounted on corks coated with gum tragacanth, rapidly frozen in liquid N2, and then stored at − 80°C. Serial tissue sections of 10 μm thickness were prepared with a cryostat at − 20°C. Sections were washed twice for 1 min each with 18 mmol CaCl2/l and 100 mmol Tris-HCl/l (pH 7·3; pre-rinse solution) and pre-incubated for 5 min at pH 10·4 (100 mmol glycine/l, 1 % CaCl2, 3·7 % formaldehyde) at room temperature. The sections were then washed twice for 30 s each time with pre-rinse solution prior to incubation in 18 mmol CaCl2/l, 20 mmol glycine/l, and 0·025 mmol ATP/l (pH 9·4) for 1 h 45 min at 37°C. Afterwards sections were washed four times in 1 % CaCl2 wash solution and then rinsed in 2 % CoCl2 for 4 min at room temperature. Subsequently sections were washed in distilled water four times for 20 s each then stained in a 1 % Azure Stain for 30 s. The stained sections were finally rinsed continuously under tap water for 10 min and washed in distilled water for 5 min, then dehydrated in ascending series of ethanol concentrations, delipidated in a solution of xylene–absolute ethanol (1: 1, v/v) and coverslipped. Six to seven fascicles (containing about 400–500 myofibres) were randomly selected from five serial sections of each sample using light microscopy (Olympus BH-2, Tokyo, Japan) with camera (JVC, Yokohama, Japan) at magnification 200, and the mean percentages of SM, FRM and FWM myofibres were calculated using image processing software (Image-Pro Plus 4.5, Silver Spring, MD, USA). The fibre type was determined as described by Wegner et al. (Reference Wegner, Albrecht, Fiedler, Teuscher, Papstein and Ender2000). FWM are stained dark blue, FRM are stained light blue, whereas SM are non-stained (Hoogenraad et al. Reference Hoogenraad, Jennekens and Tan1979).
RNA extraction and reverse transcription
Total RNA was extracted from the tissue samples with a single-step method of RNA extraction by acid guanidinium thiocyanate–phenol–chloroform (Chomczynski & Sacchi, Reference Chomczynski and Sacchi1987). Total RNA concentration was then quantified by measuring the absorbance at 260 nm in a photometer (Eppendorf Biophotometer, Hamburg, Germany). Ratios of absorption (260:280 nm) of all preparations were between 1·8 and 2·0. Aliquots of RNA samples were subjected to electrophoresis through a 1·4 % agarose–formaldehyde gel to verify their integrity.
Total RNA (2 μg) was reverse transcribed by incubation at 37°C for 1 h in a 25 μl mixture consisting of 100 U M-MLV RT (Promega, Madison, WI, USA), 8 U RNase inhibitor (Promega), 21 μmol random primers/l (6 bp), 50 mmol Tris-HCl/l (pH 8·3), 3 mmol MgCl2/l, 75 mmol KCl/l, 10 mmol DDT/l and 0·8 mmol each dNTP/l (Promega). The reaction was terminated by heating at 95°C for 5 min and quickly cooling on ice.
Semi-quantitative RT–PCR
The mRNA expression of SM, FRM, FWM, myosin heavy chain (MyHC) and growth hormone receptor (GHR), insulin-like growth factor-I (IGF-I) and type-I IGF receptor (IGF-IR) mRNA was quantified relative to 18S rRNA, using the Quantum RNA 18S Internal Standards kit (catalogue no. 1716, Ambion Inc., Austin, TX, USA), containing primers and competitors, for normalizing variations in pipetting and amplification. RT reaction mix (2 μl) was used for PCR in a final volume of 25 μl containing 0·5 U Taq DNA polymerase (Promega), 5 mmol Tris-HCl/l (pH 9·0), 10 mmol NaCl/l, 0·1 mmol DDT/l, 0·01 mmol EDTA/l, 5 % (w/v) glycerol, 0·1 %(w/v) Triton X-100, 0·2 mmol each dNTP/l, 1·6 mmol MgCl2/l, 0·4 μmol/l each primer pair specific for three types of MyHC, GHR and IGF-IR, respectively, together with 0·4 μmol 18S rRNA primers/l and competitors in proportions optimized for each target gene. Each target gene was co-amplified with 18S rRNA in the same reaction except IGF-I which was amplified separately from 18S rRNA in duplicate. The primers for MyHC and growth-related genes were designed using Primer Premier 5·0 and were synthesized by Yinjun Biotech. Ltd (Shanghai, China). The nucleotide sequences of these primers and the PCR conditions set for respective genes are shown in Table 2. The PCR products from each reaction were sent to Haojia Biotech. Ltd (Shanghai, China) for sequencing to verify the specificity. The reported sequences matched exactly those published in GenBank. Different controls were set to monitor the possible contaminations of genomic DNA and environment DNA at the stage of both RT and PCR. The pooled samples made by mixing equal quantity of total cDNA from all samples were used for optimizing the PCR condition and normalizing the intra-assay variations. The cycles of PCR were determined to ensure that the amplifications were terminated within the linear range for quantification. All samples were included in the same run of RT–PCR and repeated at least three times. Both RT and PCR were performed in a Gene Amp PCR System 9600 (Perkin Elmer, Norwalk, CT, USA).
Nucleotide sequences of specific primers and PCR conditions

SM, slow-twitch myofibres; FRM, red fast-twitch myofibres; FWM, white fast-twitch myofibres; GHR, growth hormone receptor; IGF-I, insulin-like growth factor I; IGF-IR, type I IGF receptor.
Quantification of PCR products
An aliquot (10–20 μl) of PCR products was analyzed by electrophoresis on 2 % agarose gels. The gels were stained with ethidium bromide and photographed with a digital camera. The net intensities of individual bands were measured using Kodak Digital Science 1D software (Eastman Kodak Company, Rochester, NY, USA). The ratios of net intensity of target genes to 18S rRNA were used to represent the relative levels of target gene expression.
Statistical analysis
The results were expressed as mean values with their standard errors and differences were considered significant when P < 0·05, tested by t test for independent samples. The correlations among the mRNA abundances, body weight and lateral gastrocnemius muscle weight were tested by Pearson's correlation coefficients with correlate, bivariate analysis. All statistical analyses were performed with SPSS 11.0 for windows (StatSoft, Inc., Tulsa, OK, USA).
Results
Growth performance
The growth performance and feed consumption in control and ER groups across the observation period are summarized in Table 3. Chickens in the ER group consumed considerably less feed, the average weekly feed intake being 48·5 and 62·0 % lower compared with that of the control group in the first and second week, respectively. The feed intake in the ER group remained low for 6 weeks thereafter under ad libitum feeding. The ER resulted in chickens with significantly lower body weight compared with their control counterparts throughout the experiment. Relative growth rate in the ER group, represented by percentage of daily body weight gain (average daily body weight gain relative to the initial body weight), was much lower under feed restriction in the first two weeks but rose significantly during the first week of the subsequent ad libitum feeding demonstrating a tendency of ‘catch up’ growth. However, this increased growth rate lasted only for one week and the relative growth rate declined to a level that is not different from the control group from the week. Accordingly, the weight of the lateral gastrocnemius muscle in the ER group was significantly lower both at 14 and 63 d of age (Fig. 1).
Effect of early feed restriction (ER) on body weight, relative body weight gain and average weekly feed intake of crossbred broiler chickens (Values are means with their standard errors)

Mean values were significantly different from those from the control group of the same age: * P < 0·05, ** P < 0·01, n 20.
Effect of early feed restriction (ER) on weight of the lateral gastrocnemius muscle from crossbred broiler chickens at age (a) 14 days and (b) 63 days. Values for the control (□) and the ER (![]() ) group are given as means with their standard errors represented by vertical bars. Mean value was significantly different from that of the control group: ** P < 0·01, n 10.
) group are given as means with their standard errors represented by vertical bars. Mean value was significantly different from that of the control group: ** P < 0·01, n 10.

Serum total thyroid hormone levels
As shown in Fig. 2, both T3 and T4 levels decreased with age from 14 d to 63 d, regardless of treatment. Chickens in the ER group exhibited markedly decreased serum concentrations of T3 and T4 at 14 d, while at 63 d, serum T3 remained low in the ER group but T4 restored to the level that was not different from the control.
Effect of early feed restriction (ER) on serum thyroid hormone (T3 (a) and T4(b)) levels of crossbred broiler chickens. Values for the control (□) and the ER (![]() ) group are given as means with their standard errors represented by vertical bars. Mean value was significantly different from that of the control group: * P < 0·05, n 10.
) group are given as means with their standard errors represented by vertical bars. Mean value was significantly different from that of the control group: * P < 0·05, n 10.

Morphology of the lateral gastrocnemius muscle
Fig. 3 shows the morphological changes of the lateral gastrocnemius muscle from myosin ATPase staining. The lateral gastrocnemius muscle of the ER group possessed higher density of SM at 14 d with lower density at 63 d compared with the control group of the same age. The cross-sectional area of both FRM and FWM was significantly smaller in the ER group than that in the control group at 14 d. At 63 d, all three types of myofibres in the ER group were still smaller in size, but only the FWM maintained significantly lower cross-sectional area compared with that in the control (Table 4).
Representative images of histochemical ATPase staining at magnification 200 for the lateral gastrocnemius muscle of crossbred broiler chickens from (A) the control group and (B) the early feed restriction group at 14 days of age showing a, slow-twitch myofibre; b, red fast-twitch myofibre, and c, white fast-twitch myofibre.

Effect of early feed restriction (ER) on morphology of the lateral gastrocnemius muscle (Values are means with their standard errors)
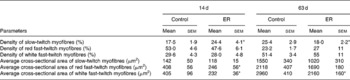
Mean values were significantly different from those from the control group of the same age: * P < 0·05, n 6.
mRNA expression of different types of myosin heavy chain and growth-related genes in the lateral gastrocnemius
As shown in Fig. 4, the ER group expressed significantly higher SM (P < 0·01), FRM MyHC (P < 0·05) and IGF-IR (P < 0·01) but lower FWM MyHC (P < 0·05) and IGF-I (P < 0·01) mRNA in the lateral gastrocnemius muscle, compared with their control counterparts at 14 d. At 63 d however, a significant down-regulation was observed in the ER group for SM MyHC expression (P < 0·05), accompanied by a significantly higher GHR (P < 0·05) and IGF-IR (P < 0·01) mRNA expression. Despite trends of decrease for FRM and numeric increase for FWM in the ER group, no significant differences were detected for either FRM or FWM MyHC mRNA expression between two groups (Fig. 5).
Effect of early feed restriction (ER) on mRNA expression of myosin heavy chain (MyHC) and growth-related genes in the lateral gastrocnemius muscle of 14 d old crossbred broiler chickens. (a)–(c) Representative electrophoresis photos of RT–PCR products for slow-twitch myofibre (SM), red fast-twitch myofibre (FRM) and white fast-twitch myofibre (FWM) MyHC mRNA, co-amplified with 18S rRNA, respectively. (d) Results of statistical analysis for abundance of SM, FRM and FWM MyHC mRNA in the control (□) and the ER (![]() ) group. (e)–(g) Representative electrophoresis photos of RT–PCR products for growth hormone receptor (GHR) and type 1 insulin-like growth factor receptor (IGF-IR), co-amplified with 18S rRNA, as well as insulin-like growth factor I (IGF-I) mRNA, amplified separately from 18S rRNA, respectively. (h) Results of statistical analysis for abundances of GHR, IGF-IR and IGF-I mRNA. mRNA levels of target genes are expressed as arbitrary units relative to 18S rRNA in the control (□) and the ER (
) group. (e)–(g) Representative electrophoresis photos of RT–PCR products for growth hormone receptor (GHR) and type 1 insulin-like growth factor receptor (IGF-IR), co-amplified with 18S rRNA, as well as insulin-like growth factor I (IGF-I) mRNA, amplified separately from 18S rRNA, respectively. (h) Results of statistical analysis for abundances of GHR, IGF-IR and IGF-I mRNA. mRNA levels of target genes are expressed as arbitrary units relative to 18S rRNA in the control (□) and the ER (![]() ) group. Values are given as means with their standard errors represented by vertical bars. Mean value was significantly different from that of the control group: * P < 0·05, **P < 0·01, n 10.
) group. Values are given as means with their standard errors represented by vertical bars. Mean value was significantly different from that of the control group: * P < 0·05, **P < 0·01, n 10.

Effect of early feed restriction (ER) on mRNA expression of myosin heavy chain (MyHC) and growth-related genes in the lateral gastrocnemius muscle of 63 d old crossbred broiler chickens. (a)–(c) Representative electrophoresis photos of RT–PCR products for slow-twitch myofibre (SM), red fast-twitch myofibre (FRM) and white fast-twitch myofibre (FWM) MyHC mRNA, co-amplified with 18S rRNA, respectively. (d) Results of statistical analysis for abundances of SM, FRM and FWM MyHC mRNA in the control (□) and the ER (![]() ) group. (e)–(g) Representative electrophoresis photos of RT–PCR products for growth hormone receptor (GHR) and type 1 insulin-like growth factor receptor (IGF-IR), co-amplified with 18S rRNA, as well as insulin-like growth factor I (IGF-I) mRNA, amplified separately from 18S rRNA, respectively. (h) Results of statistical analysis for abundances of GHR, IGF-IR and IGF-I mRNA. mRNA levels of target genes are expressed as arbitrary units relative to 18S rRNA in the control (□) and the ER (
) group. (e)–(g) Representative electrophoresis photos of RT–PCR products for growth hormone receptor (GHR) and type 1 insulin-like growth factor receptor (IGF-IR), co-amplified with 18S rRNA, as well as insulin-like growth factor I (IGF-I) mRNA, amplified separately from 18S rRNA, respectively. (h) Results of statistical analysis for abundances of GHR, IGF-IR and IGF-I mRNA. mRNA levels of target genes are expressed as arbitrary units relative to 18S rRNA in the control (□) and the ER (![]() ) group. Values are given as means with their standard errors represented by vertical bars. Mean value was significantly different from that of the control group: * P < 0·05, **P < 0·01, n 10.
) group. Values are given as means with their standard errors represented by vertical bars. Mean value was significantly different from that of the control group: * P < 0·05, **P < 0·01, n 10.

Correlations among body weight, the lateral gastrocnemius muscle weight and the expression of myosin heavy chain
The weight of the lateral gastrocnemius muscle significantly correlated with the body weight at both 14 d (r 0·962, P < 0·01) and 63 d (r 0·821, P < 0·01). Muscle weight was found to be positively correlated with FWM MyHC expression (r 0·528, P < 0·05), but negatively correlated with SM MyHC expression (r − 0·526, P < 0·05) at 14 d. A moderate positive correlation (r 0·504, P < 0·05) was observed between muscle weight and FRM MyHC expression at 63 d.
Discussion
The present experiment demonstrated that nutritional deficiency during early post-hatch development induced permanent negative effect on body weight at slaughter in crossbred broiler chickens, which was in agreement with the previous findings in mice (Widdowson & McCance, Reference Widdowson and McCance1963) and broiler chickens (Maxwell et al. Reference Maxwell, Robertson, Anderson, Dick and Lynch1991).
The majority of studies in chicken describing the influence of feed restriction of different timing, period, or severity have been focused on growth and carcass characteristics (Camacho et al. Reference Camacho, Suarez, Herrera, Cuca and Garcia-Bojalil2004; Pinheiro et al. Reference Pinheiro, Cruz, Sartori and Vicentini Paulino2004; Hiramatsu et al. Reference Hiramatsu, Nagao and Kita2005). There are scarcely any data concerning the changes of muscle morphology and metabolic properties induced by feed restriction, in addition to changes of muscle weight (Brown et al. Reference Brown, Palmer and Bechtel1990). It is known that muscle fibre formation is completed late in gestation in mammals and at hatching in avian species; the postnatal muscle growth is determined by myofibre hypertrophy which is accompanied with myofibre-type transformation following the sequence: SM → FRM → intermediate type myofibres → FWM in both mammal (Lefaucheur et al. Reference Lefaucheur, Milan, Ecolan and Le Callennec2004) and avian species (Gauthier et al. Reference Gauthier, Lowey, Benfield and Hobbs1982; Tidyman et al. Reference Tidyman, Moore and Bandman1997; Rushbrook et al. Reference Rushbrook, Huang, Weiss, Yao, Siconolfi-Baez and Becker1998; Bandman & Rosser, Reference Bandman and Rosser2000).
Traditionally myofibre typing of the skeletal muscle is achieved by using a morphological method (Hoogenraad et al. Reference Hoogenraad, Jennekens and Tan1979; Wegner et al. Reference Wegner, Albrecht, Fiedler, Teuscher, Papstein and Ender2000). Based on the knowledge that different types of myofibres express different MyHC that are encoded by respective genes (Chen et al. Reference Chen, Moore, Wick and Bandman1997; Rushbrook et al. Reference Rushbrook, Huang, Weiss, Yao, Siconolfi-Baez and Becker1998), a multiplex RT–PCR technique was developed for investigating myofibre-type composition based on the fibre-specific expression of different MyHC isoforms (Tanabe et al. Reference Tanabe, Muroya and Chikuni1998). This technique was employed in recent studies for typing porcine and bovine skeletal muscles (Muroya et al. Reference Muroya, Nakajima and Chikuni2002; Zhao et al. Reference Zhao, Yang, Xu, Wei, Xia and Chen2004b). The relative percentage of a specific myofibre type can be estimated by quantification of corresponding MyHC mRNA expressed in that muscle (Tidyman et al. Reference Tidyman, Moore and Bandman1997).
The transition of myofibre types depends on intrinsic programming related to the myoblast lineage from which muscle fibres develop and is further regulated by extrinsic influences such as neural, hormonal, dietary and mechanical factors including muscle activity (Vadaszova et al. Reference Vadaszova, Zacharova, Machacova, Jirmanova and Soukup2004). It is reported that the conversion from embryonic myofibres to neonatal myofibres and adult myofibres would be delayed by muscular dystrophy (Tidyman et al. Reference Tidyman, Moore and Bandman1997). In the present study both morphological and molecular typing pointed to higher oxidative fibres (SM and FRM) and lower glycolytic fibres (FWM) in the ER group compared with their control counterparts immediately after feed restriction at 14 d, suggesting delayed or arrested conversion from SM to fast-twitch myofibre by feed restriction, even though the molecular typing by relative quantification of mRNA expression of three different MyHC did not completely match the result of morphological study due to differences in resolution and specificity of the two methods.
The pathway mediating the effect of nutritional deficiency on myofibre type transformation is not completely elucidated, yet reduced serum concentration of thyroid hormones was suggested to be involved in the mechanism (Gunning & Hardeman, Reference Gunning and Hardeman1991; Dewil et al. Reference Dewil, Darras, Spencer, Lauterio and Decuypere1999). Hypothyroidism leads to preferential expression of slower fibre types while hyperthyroidism enhances the content of fast fibres in rats (Vadaszova et al. Reference Vadaszova, Zacharova, Machacova, Jirmanova and Soukup2004). Indeed, we detected significant reduction both for T3 ( − 26 %) and T4 ( − 28 %) serum concentrations in the ER group at 14 d (Fig. 2). In addition, morphological study revealed reduced cross-sectional area of all myofibre types in the ER group at 14 d compared with the control group, although the difference of slow fibres did not reach the statistically significant level. This result demonstrated that ER stunted the hypertrophy of myofibres in general regardless of fibre types, which may eventually result in reduced lateral gastrocnemius muscle weight and decreased body weight. Furthermore, higher proportion of slow fibres would contribute to lower muscle weight in the ER group, as indicated by the correlation analysis.
The influence of ER on the myofibre-type composition is long-lasting. To our surprise, however, the difference between the ER and the control group in myofibre-type composition at 63 d was in contrast to that observed at 14 d. Both morphological and molecular typing showed lower SM in the ER group at 63 d, with reduced cross-sectional area of all myofibre types in the ER group at 63 d compared with the control group, although only FWM reached the statistically significant level. This result demonstrated that ER may induce an accelerated myofibre hypertrophy in the long term.
The postnatal events contributing to myofibre hypertrophy comprise satellite cell proliferation, differentiation and protein turnover. Many studies indicate a possible role of a growth hormone (GH)/IGF-I system in the regulation of postnatal muscle growth (Oksbjerg et al. Reference Oksbjerg, Gondret and Vestergaard2004). The feed restriction-induced reduction in body weight in chickens was accompanied by a significant fall in circulating IGF-I (Scanes & Griminger, Reference Scanes and Griminger1990; Morishita et al. Reference Morishita, Sasaki, Wakita and Hoshino1993; Leili et al. Reference Leili, Buonomo and Scanes1997) and a rise in plasma GH (Krestel-Rickert et al. Reference Krestel-Rickert, Baile and Buonomo1986; Kuhn et al. Reference Kuhn, Herremans, Dewil, Vanderpooten, Rudas, Bartha, Verheyen, Berghman and Decuypere1991), which are restored to the normal levels by refeeding (Kita et al. Reference Kita, Tomas, Owens, Knowles, Forbes, Upton, Hughes and Ballard1996; Maxwell et al. Reference Maxwell, Butterwick, Batt and Camacho-Hubner1999). A recent study provided evidence that the in vivo effects of GH on muscle mass and strength are primarily mediated by activation of the IGF-I receptor in skeletal muscle, since mice lacking IGF-I function specifically in skeletal muscle, due to the over expression of a dominant-negative IGF-I receptor in this tissue (MKR mice) exhibited no effects of GH on the cross-sectional area of myofibres and the proliferation of satellite cells (Kim et al. Reference Kim, Barton, Muja, Yakar, Pennisi and Leroith2005). The role of the GH–IGF-I axis in the regulation of avian muscle growth is more vague and still under debate (Buyse & Decuypere, Reference Buyse and Decuypere1999). It is suggested that in the chicken, hepatic expression of IGF-I mRNA is GH-dependent after hatching, whereas IGF-I expression in other tissues, including muscle, is independent of GH and GHR (Tanaka et al. Reference Tanaka, Hayashida, Sakaguchi, Ohkubo, Wakita, Hoshino and Nakashima1996). The absence of a functional GHR in the dwarf chicken is associated with a greater decline in DNA synthesis but no alterations were observed in IGF-I mRNA or peptide in muscle (Goddard et al. Reference Goddard, Johnson, Gilhooley, Gardner, Gray, Wilkie and Butterwith1996). In avian skeletal muscle satellite cells, GHR gene expression was regulated by cGH in a biphasic manner which correlated with the GH effect on cell proliferation: 2–10 ng hormone/ml increased GHR mRNA and DNA synthesis, whereas higher concentrations attenuated these effects (Halevy et al. Reference Halevy, Hodik and Mett1996). In the present experiment, delayed conversion from SM to fast-twitch myofibre and higher percentage of slow fibres in the ER group at 14 d was associated with significantly higher IGF-IR mRNA expression but lower IGF-I mRNA in the gastrocnemius muscle, while the lower percentage of SM and retarded hypertrophy in the ER group observed at 63 d was accompanied by significantly elevated GHR and IGF-IR mRNA expression. The higher muscle IGF-IR mRNA expression at 14 d could be the consequence of decreased circulating and local level of IGF-I, as indicated by significantly decreased abundance of IGF-I mRNA in the muscle. The up-regulated expression of both GHR and IGF-IR mRNA in the muscle at 63 d may reflect the physiological response of the muscle to the ER for a compensatory growth via accelerated myofibre hypertrophy. This adaptation mechanism failed to achieve the complete growth compensation by the end of the experiment, probably due to the limited time allowed for the ‘catch-up’ growth. However, it seems unlikely that the alterations in muscle morphology and metabolic properties as reflected by the change in myofibre-type composition would be restored even if chickens in the ER group attained normal body weight. This life-long effect of ER may thus induce changes in metabolic status and compromise meat quality in later life.
In conclusion, ER delays the myofibre conversion from slow-tonic to fast-twitch types, resulting in retarded muscle growth that may account for the decreased body weight. The influence of ER on myofibre types is long-lasting, significant differences still seen after 7 weeks when chickens reach the marketing age. Changes in muscle expression of GHR and IGF-IR mRNA may be involved in the acting mechanism.
Acknowledgements
This work was supported by National Basic Research Program of China (2004CB117505) and the Sino-German Cooperation in Agriculture, Project No. 17.


