
I Introduction
Twenty years on China’s accession to the World Trade Organization (WTO) is rightly regarded as a significant milestone in global economic governance. Much analysis has been devoted to the effects of China’s accession on the economies, politics, and trade negotiating stance of its trading partners as evidenced, for example, by the literature on the so-called China Shock. In contrast, apart from papers analysing the impact of U.S. import tariff hikes on Chinese exports imposed by the Trump Administration, there is considerably less analysis on how China’s interests have been affected by policy intervention taken by its trading partners since 2001. This chapter seeks to go some way to remedy that deficit.
The often-expressed concern is that Chinese manufactured exports – supported by Chinese government policies – have caused dislocation and disruption in trading partners. In this chapter the perspective is reversed by asking: how much Chinese exports were at risk from unilateral trade policy actions taken by other governments? The goal is to elaborate the factual base, to offer a tentative assessment and, then, to cautiously draw out implications for policy and future research.
The systemic importance of this analysis is that it sheds light on the extent to which Chinese membership of the WTO protected its goods exports from excessive trade discrimination. Excessive is meant here in relative terms – that is, relative to other trading partners. In turn, this raises the possibility that over time the benefits that China enjoyed from its WTO membership may have been clawed back by trading partners.
Put starkly, if China’s exporters have faced extensive and growing trade discrimination aboard since 2001, has China’s membership of the WTO become a depreciating asset? It is not inconceivable that answers to that question influence Chinese government calculations concerning its future development strategy, in particular the shift away from export-led growth towards a so-called dual circulation strategy. Related policy-relevant questions include: has the trade discrimination faced by Chinese exports influenced Chinese assessments of the wisdom of decoupling from Western economies? And has foreign trade discrimination influenced Chinese incentives to engage in cooperative behaviour in the multilateral trading system?
The approach taken in this chapter is relentlessly empirical. Such an approach does not deny that there may be valuable theoretical and legal perspectives on the foreign treatment of Chinese commercial interests since its accession to the WTO in 2001. Yet, there is value in putting the facts on the table. That is, in documenting what unilateral trade policy actions confront Chinese exports, how long those policy interventions have lasted, and the scale of the market access at risk or, in the case of foreign trade reforms, opportunities. At some point, arguments based on first principles ought to be confronted with the factual record.
The evidence presented in this chapter is relevant to assessments of the impact of China’s WTO accession on its own economy and society and on its trading partners, not least because post-accession trade discrimination by the latter is likely to have reduced the net benefit of the former joining the WTO. To date, however, such assessments have tended to emphasise effects related to educational outcomes, the environment, labour markets, trade, and policy uncertainty (Chen et al., Reference Chen, Lin, Yao and Zhang2020; Dai et al., Reference Dai, Huang and Zhang2021; Garred, Reference Garred2018; Imbruno, Reference Imbruno2019; Kim and Xin, Reference Kim and Xin2021; Lin and Long, Reference Lin and Long2020).
This chapter is not the first to assess the impact of foreign trade discrimination on China, as the growing literature on the Sino-U.S. trade war can attest. High profile papers in this regard include Amiti et al. (Reference Amiti, Redding and Weinstein2019, Reference Amiti, Redding and Weinstein2020) and Fajgelbaum et al. (Reference Fajgelbaum, Goldberg, Kennedy and Khandelwal2020). That such trade tensions have been linked in extant literature to the economic, political, and social consequences of China’s accession to the WTO brings the discussion back to the animating theme of this volume. Assessments of the overseas impact of China’s growing exports, in particular of manufactured goods, include Autor et al. (Reference Autor, Dorn and Hanson2016, Reference Autor, Dorn and Hanson2019), Autor et al. (Reference Autor, Dorn, Hanson and Majlesi2020), Bloom et al. (Reference Bloom, Handley, Kurman and Luck2019), Dustmann (Reference Dustmann2021), and Pierce and Schott (Reference Pierce and Schott2016). While this paper focuses on policy interventions taken by China’s trading partners, it is important not to lose sight of the factors that may have driven the implementation of those foreign unilateral acts in the first place.
The rest of this chapter is organised as follows. The next section briefly describes the rise of China as a trading powerhouse since its accession to the WTO in 2001. Given the sustained growth of China’s exports and the size of those exports at present, it is unsurprising that there has been a reaction from trading partners. One part of that reaction has been to bring cases against China under the WTO’s Dispute Settlement Understanding and, in the interests of completeness, pertinent statistics in this regard are reported.
The third section of the chapter gets to the heart of the matter and reports on the frequency, form, and scale of trade implicated by the unilateral commercial policy acts of China’s trading partners. Given the best data available refers to policy intervention taken since the onset of the Global Financial Crisis, the emphasis is on developments since that systemic episode.
The final section of the paper discusses how best to assess or interpret the empirical findings presented earlier. The case is made for a relative assessment as opposed to an absolute assessment of the degree of Chinese goods export exposure to foreign trade discrimination. Four implications for policy and future research are drawn from that relative assessment.
II China’s Emergence as a Trading Powerhouse and Push Back from Trading Partners
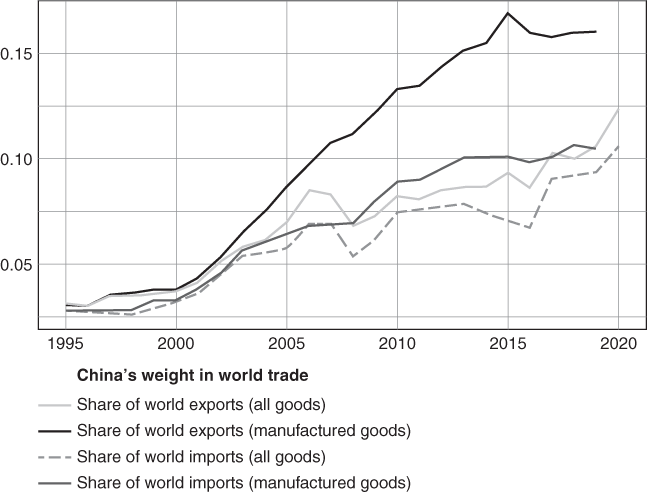
Since its accession to the WTO, China has become an exporting and importing powerhouse, especially in relation to manufacturing goods. Figure 15.1 shows that China’s share of world exports and world imports now exceeds 10%. The growth in China’s manufacturing trade is even more impressive. Before its accession China’s manufacturing exports accounted for less than 3% of the world total; now nearly one-sixth of world manufacturing exports originate in China. China’s share of world manufacturing imports has risen three-fold and reflects extensive sourcing of parts and components from abroad.Footnote 1
China has become an exporting and importing powerhouse
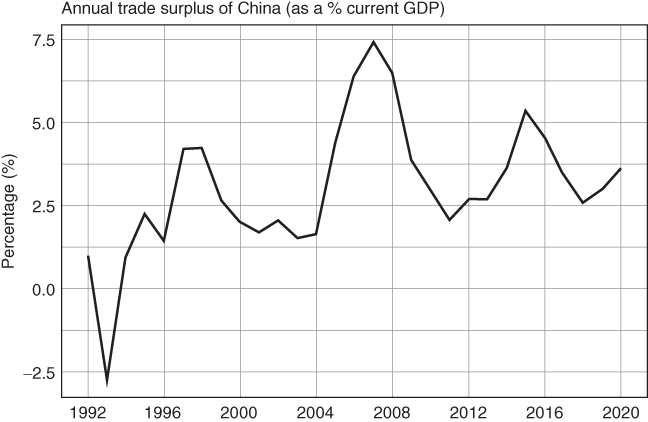
The upshot of these manufacturing trade dynamics is that China has earned sizeable trade surpluses (see Figure 15.2). Those surpluses peaked before the Global Financial Crisis at around 7.5% of current GDP and subsequently have halved. At no time since China’s accession to the WTO has it run a trade deficit.
China has consistently generated trade surpluses this century

The findings in Figures 15.1 and 15.2 shed some light on why Chinese manufactured goods became a lightening rod for criticism of Chinese government policy. First, for some such unusually high rates of export growth were considered unlikely to have been due to competition on the merits and, on this logic, must have been supported by government policy.
Second, while China’s trading partners benefited from greater variety and lower prices, the quantum of Chinese manufacturing exports that was absorbed by trading partners after its WTO accession has been linked to disruption to local labour markets, plant closures, reduced profits, and the like. Third, some policymakers associate large trade surpluses with unfair or malign commercial and macroeconomic policies. Under these circumstances, it is unsurprising that Chinese manufacturing exports became a target for foreign trade discrimination.
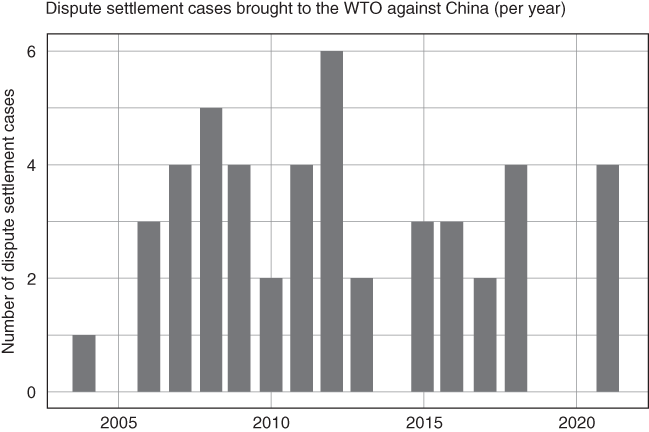
Having written this, immediate resort to trade discrimination was not the only option available to foreign governments. WTO members could avail themselves of the Dispute Settlement Understanding, bringing cases against Chinese policies considered to be in violation of multilateral trade rules. Many governments did just that. As Figure 15.3 shows, since the middle of the last decade between two to six new cases were typically brought against China every year.
A steady stream of WTO dispute settlement cases have been brought against China

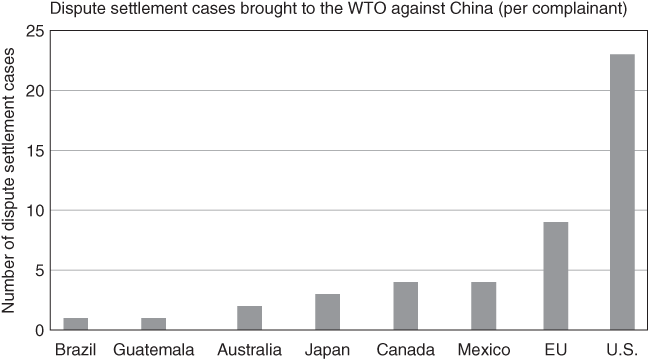
The European Union and the United States initiated a significant number of WTO dispute settlement cases against Chinese policies, see Figure 15.4 which identifies the eight nations that have brought the largest number of cases. It is noteworthy that the governments of countries on the East Asian land mass do not feature in the top eight most litigious nations.
By a large margin, the United States has brought the most dispute settlement cases against China
The contention that resort to WTO dispute settlement did not induce China to accelerate broad-based market reforms may have ultimately accelerated the resort to unilateral measures against Chinese manufacturing exports. Perhaps the most obvious manifestation of the latter was the de facto revocation of China’s Most Favoured Nation status by the Trump Administration. But were these high-profile measures, taken more than fifteen years after China joined the WTO, the only relevant acts of foreign trade discrimination? Could the accumulation over time of less salient discrimination against Chinese goods cover more of that nation’s exports? This question and others are answered in the two remaining sections of this chapter.
III Unilateral Trade Policy Responses by China’s Trading Partners
Although much tends to be written about trade policy developments in regional and multilateral fora, the focus of this paper is on unilateral trade policy actions taken by governments that implicate Chinese goods exports. This focus is justified on the grounds, as previous research has shown, that for more than a decade the majority of global goods trade has been coveredFootnote 2 by discriminatory unilateral acts taken since the onset of the Global Financial Crisis of 2008 and 2009 (Evenett, Reference Evenett2019).
Put simply, while multilateral trade processes have stalled, unilateral trade policy is where the action is. Such is the accumulation over time of unilateral acts in force – both liberalising and trade distorting – that any credible assessment of the treatment of Chinese exports after its WTO accession needs to take account of them.
The challenge for analysts is that official sources of trade policy information provide only a fraction of the information required. For sure, not all is lost. The WTO secretariat maintains a comprehensive database of antidumping and countervailing duty investigations and this will be referred to below. Beyond that, however, matters deteriorate quickly. The WTO’s Trade Monitoring Database (TMDB) does include entries where China is an affected trading partner for goods measures – but not for service sector policy interventions and policy measures affecting the protection of intellectual property rights. UNCTAD’s TRAINS database on non-tariff measures contains some valuable information but is widely regarded as incomplete.
For these reasons the principal data source used in this chapter is the Global Trade Alert database.Footnote 3 This database includes information on 61 different types of policy intervention whose implementation can affect the relative treatment of domestic firms vis-à-vis foreign rivals.Footnote 4 These policy interventions include traditional border barriers (except those associated with Technical Barriers to Trade and Sanitary and Phytosanitary Standards), behind-the-border measures that affect imports (such as government procurement measures), subsidies to import-competing firms, and policy interventions affecting exports, foreign direct investment, labour migration (not refugees), data flows, and intellectual property.
Policy interventions announced or implemented since November 2008 (the month when G20 Leaders first stated they would eschew protectionism) are in scope as the GTA is concerned These policy interventions are at all levels of government in any nation. As of this writing, the GTA database contains reports on over 43,000 distinct policy interventions.
The GTA database includes 13,563 unilateral policy interventionsFootnote 5 by foreign governments that implicate the commercial interests of China. Of that total, 12,651 policy interventions relate to trade in goods.Footnote 6 This contrasts with the 1,397 entries in the WTO’s TMDB that list China as an affected trading partner. Three-quarters of the total number of policy interventions affecting Chinese trade in goods in the GTA database were still in force on 24 March 2022.Footnote 7
Of the 12,651 total mentioned in the last paragraph, 9,416 policy interventions by foreign governments tilted the commercial playing field away from Chinese goods exporters. Over three thousand subsidies to import-competing firms have been issued by foreign governments in markets where Chinese firms export. Export measures by foreign governments (both restrictions and state-furnished incentives) that worsen the competitive conditions faced by Chinese exporters have occurred just under two thousand times. Chinese goods exporters have faced 1,631 import tariff increases and have been investigated for dumping, subsidisation, or for causing serious injury a total of 1,231 times since 1 November 2008.
On the other side of the ledger, Chinese firms have benefited from import tariff cuts implemented by trading partners on 2,005 occasions. Overall, though, for every implemented foreign unilateral act that benefited Chinese exporters since 1 November 2008 there are three that have harmed them. Still, while such counts are informative, the quantum of trade covered reveals more about the exports at risk from foreign trade discrimination. Much of the remainder of this section is devoted to reporting trade coverage calculations based on the policy interventions recorded in the GTA database.Footnote 8
One drawback to using the GTA data is that it starts reporting on policy intervention seven years after China joined the WTO. Quite reasonably, some may want to see if foreign trade discrimination against Chinese exports changed after China joined the WTO. The only known time series of sufficient length relates to antidumping and countervailing duty actions and is collected by the WTO. Figure 15.5 reports the number of such investigations into Chinese exports launched each year from 1995 to 2020.
Over time a growing number of dumping and countervailing duty investigations have been initiated on products exported from China
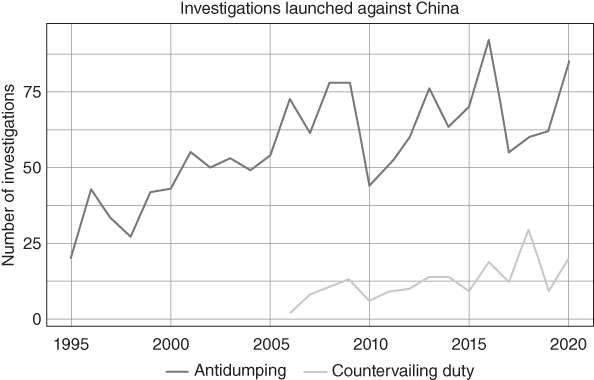
Before China joined the WTO approximately 30–35 antidumping investigations into Chinese goods exports were launched each year. After accession, that number has progressively risen and in some years the total number of new investigations exceeded 75. The number of investigations fell sharply in 2010, potentially as a result of the Global Financial Crisis. Similar dynamics, but starting from a much lower base from 2005, can be found with respect to countervailing duty investigations of Chinese exports.
To put the findings in Figure 15.5 in context, it may be useful to compare the growth in the annual totals in that figure with the growth of total Chinese manufacturing exports (as revealed in Figure 15.3). It should be evident that the latter grew faster than the former, implying the propensity to launch dumping and subsidy investigations into Chinese manufactured exports has fallen over time. Put differently, the annual totals of new investigations did not grow in line with the growth of Chinese manufacturing exports.
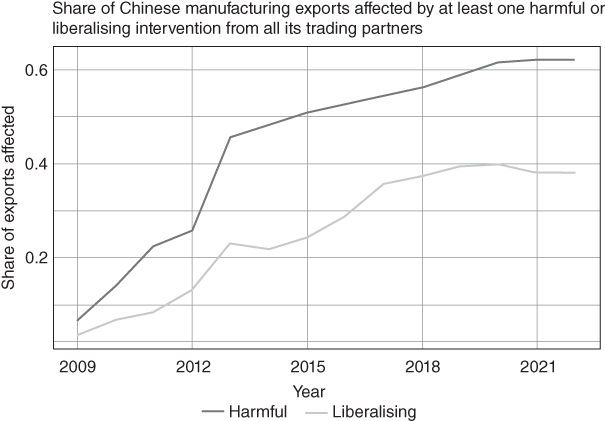
Turning now to the foreign trade discrimination and trade reform faced by Chinese exporters of manufactures found in the GTA database, Figure 15.6 reports the shares of overall exports where market access gains (potentially from WTO accession) are at risk from subsequent trade discrimination and the shares potentially benefiting from foreign trade liberalisation. The former shares always exceeded the latter and the margin grew sharply from 2013 on.
The growing shares of Chinese manufactured exports facing unilateral measures in trading partners

By the time the COVID-19 pandemic hit, over 60% of Chinese manufacturing exports faced one or more policy-induced competitive disadvantages in overseas markets. The calculations reported in Figure 15.6 take account of the duration that a foreign trade barrier is in force and, when a measure lapses, it no longer counts towards the total in subsequent years.Footnote 9 As a result, there is no inherent reason why these export exposure shares must rise over time – still they tend to. Having written that, a plateau was reached in 2019 in Chinese export exposure to foreign trade discrimination, although it should be noted that the estimated share for this and subsequent years may be revised upward as more foreign trade measures are documented by the Global Trade Alert team.Footnote 10
The share of Chinese exports of products in foreign markets where trade reforms were introduced also rises until 2019 when it plateaus at around 0.4. Any comprehensive assessment of the impact of unilateral policy choice by trading partners on Chinese exports ought to take account of the fact these reforms, although it is an open question as to whether China might have benefited from some of these reforms had she not joined the WTO.
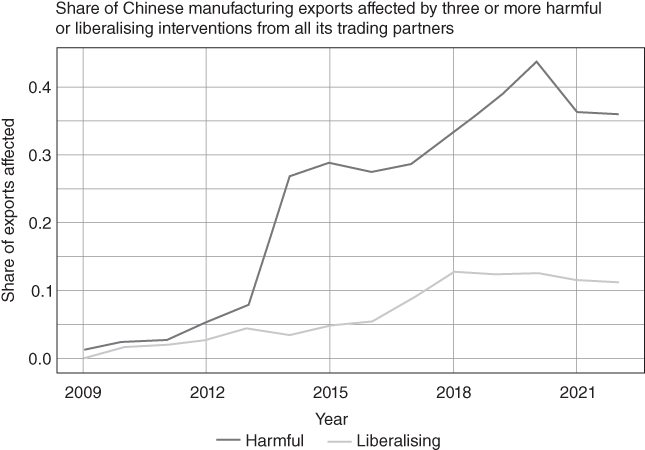
Any particular trade route that Chinese manufacturers operate in could be affected by multiple unilateral trade actions by trading partners. One might plausibly assume that the more such harmful (liberalising) actions along a trade route the greater the likely size of the adverse (beneficial) effects on Chinese exports. To examine this matter, the share of Chinese manufacturing exports facing three or more harmful unilateral foreign measures is reported for each year from 2009 to 2022 in Figure 15.7. Likewise, the share faces three or more unilateral trade reforms. The gap between the shares facing multiple harmful and liberalising measures widens, with the latter share never exceeding 0.15. Meanwhile, by 2020 the former exceeded 0.4.Footnote 11 This reinforces the finding that the weight of foreign unilateral action was to disadvantage Chinese manufacturing exports after its accession to the WTO.
Thirty percent of Chinese manufactured exports face three or more trade-related hurdles in foreign markets

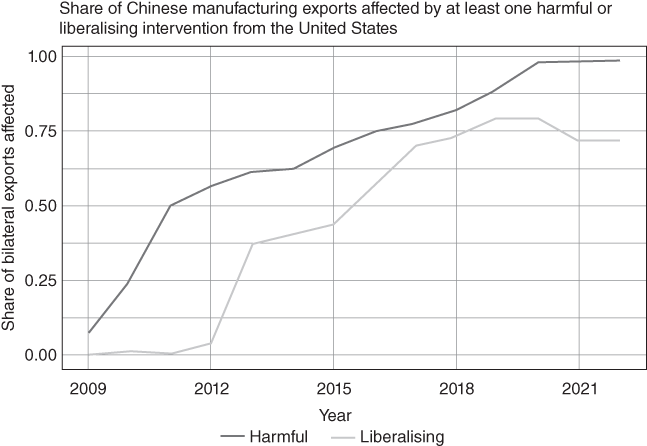
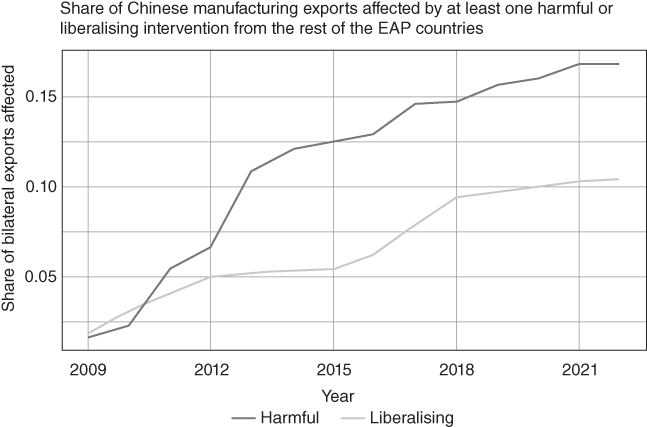
In principle, resorting to discrimination against Chinese manufacturing exports can differ across China’s trading partners. To investigate this matter, the equivalent of Figure 15.6 was produced for unilateral actions (both harmful to Chinese interests and beneficial) by the United States, by the European Union,Footnote 12 and by the other countries in the East Asia and Pacific (EAP) region.Footnote 13 The results can be found in Figures 15.8–15.10 respectively.
Large shares of Chinese exports faced hurdles in the U.S. market before President Trump took office

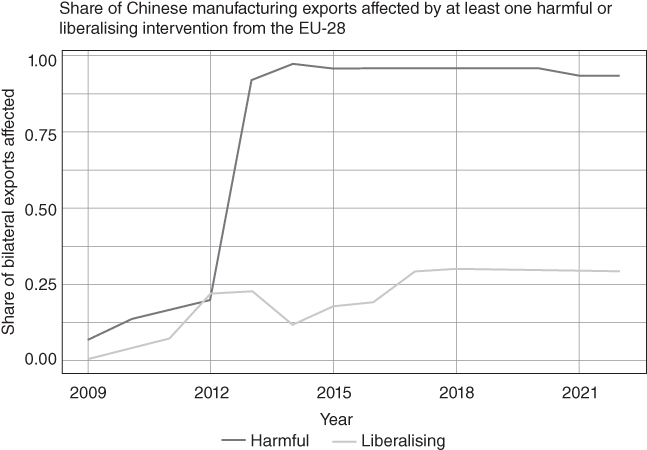
Market access impairment in the EU is longstanding
The hurdles erected to Chinese exports in its own region cover proportionally less trade than those erected in the EU and the U.S.

There are several noteworthy findings. First, while almost all Chinese manufacturing exports now face policy-induced hurdles in the American market, the share was rising and had reached 0.74 in 2016, that is, before President Trump took office. As is evident from the relevant figure, the share of Chinese exports facing worse market access conditions in the United States deteriorated sharply during the two terms of the Obama presidency (see Figure 15.8).
Second, American public bodies have undertaken enough trade reforms in the products that China exports to the United States that the share of Chinese exports facing improved market conditions is significant. It is, of course, possible that a particular product shipped to the American market faces both unilaterally imposed trade hurdles as well as reforms.
Third, the withdrawal of China from the EU’s Generalised System of Preferences (GSP) and the extensive award of free CO2 trading permitsFootnote 14 to EU firms in import-competing sectors account for the very high shares of Chinese exports facing harmful unilateral acts in the European Union (as shown in Figure 15.9). Ever since 2013 over 90% of Chinese manufacturing exports faced one or more unilateral policy-induced hurdles to competing in the European Union market. In contrast, at no point between 2009 and 2021 does 30% or more of Chinese manufacturing exports benefit from policy-induced market access improvements in the European Union.
Fourth, the shares of Chinese exports facing harmful unilateral acts in the East Asia and Pacific region are smaller than the comparable shares found in the United States and the European Union (compare the upper lines in Figures 15.8–15.10). Similar findings arise also with respect to exposure to liberalising measures implemented in the region and this may reflect the fact that China has signed regional trade agreements with many neighbouring countries.
That the United States chose to target Chinese exports with higher tariffs begs the question of whether other governments have done so and how much Chinese manufacturing exports were at stake. To address this matter, those market access-impairing unilateral trade measures where China was the sole affected exporter were identified in the Global Trade Alert database. Refer to these measures as those that “target” Chinese exports.
The shares of Chinese manufacturing exports facing targeted harmful measures in each year from 2009 to 2022 were calculated and contrasted to the shares of Chinese manufacturing exports facing targeted or non-targeted unilateral harmful measures. By construction, the latter share exceeds the former share in any given year; the gap between them reveals the extent to which Chinese exports face untargeted foreign trade discrimination.Footnote 15 The comparison is presented graphically in Figure 15.11.
Targeting Chinese exports has become more common during the past decade
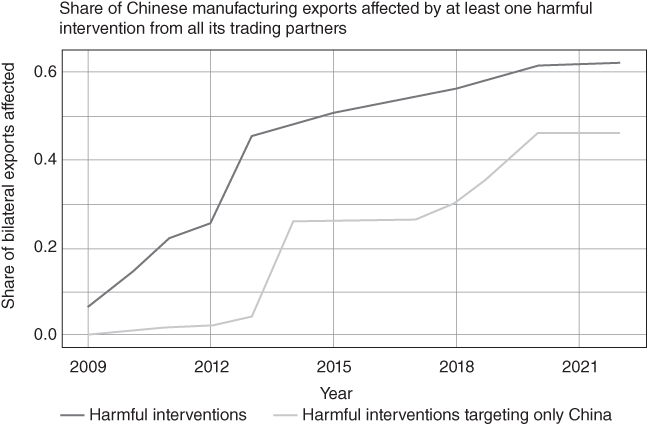
The share of Chinese manufacturing exports that are targeted by foreign governments for discrimination grows slowly over time but jumps twice; the first time with the exclusion of China from the EU’s GSP regime and the second time with the Trump Administration’s four rounds of tariff hikes issued under Section 301 of the Trade Act of 1974, as amended. By the time the COVID-19 pandemic hit, approximately 42% of Chinese manufacturing exports were singled out for worse treatment by its trading partners.
To conclude, evidence was marshalled in this section that demonstrates that the treatment of Chinese exports by trading partners evolved markedly after China’s accession to the WTO. The goal here has been to report the variation over time, across trading partners, and along other meaningful dimensions in Chinese export exposure to better and worse market access conditions abroad. Rather than focus exclusively on high-profile episodes, such as the Sino-U.S. trade war, the approach taken here also includes less salience unilateral trade policy acts by China’s trading partners and therefore presents a more comprehensive picture of the global commercial policy landscape facing Chinese exporters.
IV Assessment and Policy Implications
How should analysts and policymakers interpret the scale – reported in the last section – of Chinese goods exports facing foreign trade distortions implemented since China joined the WTO reported? What do these findings imply about the degree of protection afforded by WTO rules to one of the world’s major trading powers?
Care is needed in interpreting the empirical findings presented here. After all, they demonstrate that significant shares of Chinese goods exports were exposed to foreign trade distortions. They are silent on the effect of those trade distortions, a topic that should be taken up in subsequent research. Still, the former finding is of interest as, plausibly, it is a necessary condition for finding adverse effects.
On reflection, employing an absolute standard to judge the documented levels of export exposure is not sensible. There are reasons why a WTO member’s goods exports can legitimately be exposed to discrimination by foreign governments. The WTO rule book is not complete nor is it uncontested (the policy domain of subsidies being a case in point). Furthermore, certain types of trade policy discrimination are allowed under multilateral trade rules. Surely, no one with a basic understanding of the WTO agreements would reasonably expect that any member of that organisation is guaranteed that its exports be completely protected from foreign discrimination. Zero export exposure is not the right benchmark.
Moreover, growing absolute levels of export exposure to foreign trade distortions is not necessarily evidence of violations of WTO rules. Even so, this may offer little comfort to officials having to explain why their nation’s exporters face deteriorating market access conditions in trading partners. Just because discrimination is perfectly legal under WTO rules does not mean it cannot alter the political economy of support for multilateralism in the affected trading partner. Seen through this particular lens, the rising shares of Chinese export exposure to foreign discrimination reported earlier might cast a shadow over support in some Chinese quarters for its membership in the WTO.
Perhaps a better way to assess the findings of this paper is to employ a relative criterion. That is, to ask if the exposure of China’s goods exports to foreign trade distortions found here is larger than other WTO members. In terms of the figures discussed earlier, one might ask what Figures 15.6 and 15.7 look like for other WTO members or groups of those members.
Before exploring this line of inquiry further one might consider two hypotheses. First, that Chinese export exposure to foreign trade discrimination be lower than smaller and less influential WTO members on account of Beijing’s growing clout in world affairs. Second, that the fast pace of China’s export growth since its WTO accession made it a lightning rod for foreign trade discrimination and so the opposite outcome would be expected.
To add empirical flesh to this comparison, the exposure of Chinese goods exports to foreign trade discrimination that discourages imports was compared over the same timeframe with that the aggregate for every other nation. The focus on market access impairment from policy interventions affecting domestic conditions of competition in the implementing jurisdiction is deliberate. This design choice excludes state-provided export incentives from the calculations. China has implemented several changes in such export incentives since the onset of the Global Financial Crisis and to include them in the calculations would have increased the estimated export exposure to foreign trade distortions of other nations. In turn, this would inappropriately skew the comparison in favour of finding that China’s goods were better protected by its WTO membership.
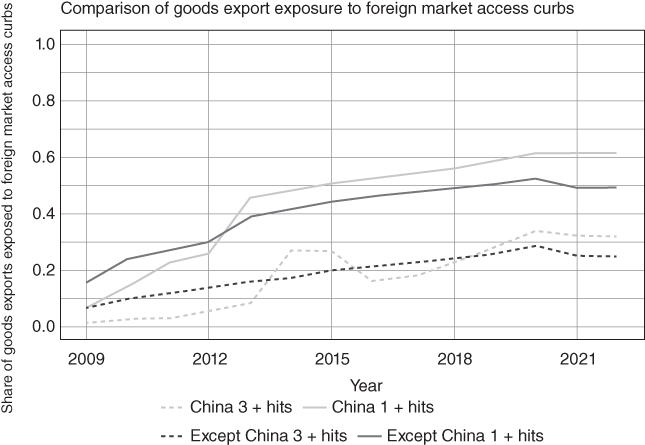
Figure 15.12 reports the changes over time in Chinese and in non-Chinese export exposure to policy interventions by trading partners that discourage importation.Footnote 16 Recall those policies include subsidies to import-competing firms, other behind-the-border policies (such as local sourcing incentives and requirements in government procurement policies) as well as import restrictions including import-related non-tariff barriers.
Chinese goods exports are more exposed to market access curbs in trading partners than exports from other nations

A comparison is provided between the annual exposure to any trade distortion abroad (represented in Figure 15.12 by line one or more trade distortions) and the annual exposure of exports to three or more foreign trade distortions. Exposure to three or more trade distortions could be thought of as being associated with exposure to greater trade discrimination abroad.
As far as the overall exposure to foreign trade distortions is concerned, since 2013 the share of Chinese goods exports exposed has been greater than for other nations. By 2021 such export exposure for China was more than 10 percentage points higher than for non-Chinese exporters.
Similarly, from 2019 Chinese export exposure to three or more trade distortions exceeded that of other nations; with the gap reaching at least five percentage points by 2021. Overall, then, it is difficult to argue that WTO rules have shielded Chinese goods exporters from foreign trade distortions. Put differently, existing multilateral trade rules have not prevented WTO members from taking steps that once added up discriminated against more Chinese exports than the goods exports of other WTO members.
In assessing the policy implications of this relative finding and others in this chapter, four thoughts come to mind. First, China’s growing clout – economic and otherwise – does not appear to have spared it from high absolute and relative levels of foreign trade discrimination. Although the finding of lower levels of Chinese export exposure to trade discrimination in the Asia-Pacific region suggests a nuanced clout-based argument might still apply. Further research might usefully investigate whether the carrots and sticks that China deployed had a greater effect in the Asia-Pacific region. The Belt and Road Initiative comes to mind.
Second, that overall exposure to foreign trade discrimination has risen for China and for other nations is a source of concern. It begs the question as to whether and why multilateral trade cooperation has broken down. As argued earlier, any breakdown cannot be solely pinned on the trade wars of the Trump Administration – the rot set in years before. The extent to which China’s accession to the WTO influenced observed levels of multilateral trade cooperation could be further researched. What needs to be explained is the gradual breakdown of cooperation (as manifested by greater shares of trade exposed to discrimination), not just the rhetorical fireworks of the past five or six years.
Third, that there is so much export exposure to foreign trade discrimination strongly suggests that either multilateral trade rules afford governments lots of policy space to influence trade flows or that violations of those rules are now widespread. This is important as many analysts and trade diplomats still cling to the notion that existing multilateral trade rules are a first-order constraint on governmental room for manoeuvre. One hypothesis worth further exploration is that existing WTO rules channel the impulse to favour local firms away from certain policy instruments towards others – rather than reducing the pressures to discriminate in the first place.
Fourth, since policy space is alive and kicking and has been deployed extensively to discriminate against Chinese goods exports, then surely ex-post assessments of China’s WTO accession ought to take into account the degree to which the benefits of accession have been eroded since 2001, in particular, since the onset of the Global Financial Crisis.
If future research were to establish that a significant share of those benefits was subsequently eroded on account of foreign trade discrimination then, other things being equal, this should moderate expectations of China’s willingness to take on additional future multilateral trade obligations in the absence of meaningful binding commitments by other WTO members to temper their resort to discrimination. As far as the potential for progress at the WTO is concerned, one implication of this line of argument is that the next twenty years of Chinese WTO membership is increasingly likely to be an “all or nothing” proposition.


 Open access