

Fibrate derivatives are widely used as normolipidaemic or hypolipidaemic drugs for the treatment of hyperlipidaemia, non-alcoholic fatty liver disease and preserving insulin signal transduction(Reference Fabbrini, Mohammed and Korenblat1, Reference Desager, Horsmans and Vandenplas2). As one of the fibrate derivatives and lipid-lowering agents, fenofibrate has been shown to lower the concentration of plasma TAG and cholesterol(Reference Juha, George and Jean-Claude3). Some mechanisms of the clinical effects of fenofibrate have been identified, including interference with fatty acid (FA) synthesis, stimulation of hepatic FA oxidation, increase in lipoprotein lipolysis, inhibition of cholesterol biosynthesis and decrease of insulin resistance(Reference Fabbrini, Mohammed and Korenblat1, Reference Black, Ennis and Young4). Fenofibrate is also known to activate the transcriptional factor PPARα, which binds to the peroxisome proliferator response element in the regulatory region of target genes, resulting in hypolipidaemic effects, glucose homeostasis and amino acid metabolism(Reference Rakhshandehroo, Knoch and Muller5). Many model animal studies have demonstrated significant lipid-lowering functions of fenofibrate under the high-fat diet (HFD) feeding condition(Reference Mancini, Lanni and Sabatino6, Reference Shin, Lim and Chung7). Similarly, fenofibrate has also been reported to lower the hyperinsulinaemia and hyperglycaemia in HFD-induced (C57BL/6) mice(Reference Guerre-Millo, Gervois and Raspé8). Furthermore, fenofibrate could stimulate the branched-chain amino acid (leucine, isoleucine, and valine) catabolism of rats, resulting in attenuating leucine-stimulated protein synthesis in a low protein (LP) diet(Reference Knapik-Czajka, Gozdzialska and Jaskiewicz9). This result suggested that fenofibrate may play an important role in amino acid metabolism and affect the animal growth.
In current aquaculture, due to the popular usage of HFD, the excess fat deposition in farmed fish has been commonly observed to impair fish health and growth(Reference Du, Clouet and Huang10). Therefore, the regulatory mechanisms and technologies to reduce fat deposition in fish have been an important research area in fish nutritional and physiological studies(Reference Guo, Liang and Fang11, Reference Du, Clouet and Degrace12). By using fibrates as an efficient lipid-lowing reagent, researchers also found that, as in mammals, fibrates could play lipid-lowering effects in grass carp, yellow catfish and Nile tilapia in HFD-induced fatty fish(Reference Du, Clouet and Degrace12–Reference Ning, He and Lu14). However, not only HFD, but also excess high protein (HP) diet could result in lipid deposition in fish(Reference Ding, Yongqing and Fasheng15). On the other hand, in the practical dietary formulation in farmed fish, HFD always contains relatively LP content. Therefore, dietary protein content could also affect fat deposition in fish. However, to the best of our knowledge, the metabolic regulatory functions of fibrate in fish at different dietary protein levels have not been fully investigated, which then limited our current understanding of the regulatory mechanisms of fenofibrate functions in fish.
Nile tilapia (Oreochromis niloticus) is an important aquaculture species cultured worldwide. A number of studies have indicated that the optimal dietary protein level in Nile tilapia is 30 to 35 % during the size of 3·2- to 43·0-g fish(Reference Abdel-Tawwab, Ahmad and Khattab16, Reference Wang, Takeuchi and Watanabe17). To understand and characterise the possible metabolic regulation function of fenofibrate through different dietary protein levels in Nile tilapia, an 8-week feeding experiment was performed to investigate the metabolic effects of fenofibrate on growth, body morphometric parameters, plasma biochemical parameters and selected genes which are related to lipid and protein metabolism at HP (38 % protein level) or LP (28 % protein level) in the diet. Considering in our earlier study that the lipid-lowering effect of fenofibrate in Nile tilapia was affected by dietary fat levels(Reference Ning, He and Lu14), if the metabolic effects of fenofibrate were also affected by dietary protein level, then it could verify our hypothesis that metabolic regulation of fenofibrate in Nile tilapia was dependent not only on feed energy content but also on dietary nutrient composition, such as dietary protein and/or lipid levels.
Materials and methods
Feeding trial
More than 400 juvenile Nile tilapias (male) were obtained from Guangdong Tilapia Breeding Farm. Before the feeding experiment, all fish were acclimated in three 300-litre tanks for 1 week. Fishes were fed with the commercial diet (Tongwei Feed Group) at 3 % of biomass per d. The feeding experiment started after 1-week acclimation of fish. A toal of 240 healthy juvenile Nile tilapia with similar body weights (8·02 ± 0·03 g) were selected and randomly distributed into twelve circular fibre glass tanks (300 litres, twenty fish per tank) that were connected as a closed recirculating system containing freshwater in Baiyun experiment base, Guangdong Academy of Agricultural Sciences. This recirculating system has a well-assembled filter system, and it is composed of eight phases of filter materials, including one phase of cotton filter, one phase of foam, two phases of coral stone, two phases of activated charcoal and two phases of biofilms (mainly nitrifying bacteria). During the feeding trial, the cotton filter, foam filter, coral stone and activated charcoal were washed and renewed every week, and this could efficiently maintain water quality and largely reduce the residue of fenofibrate and its metabolites. Two semi-purified basal diets were made from two protein levels (28 and 38 %) and one fat level (7 %). Each group of feed was either supplemented with fenofibrate (fenofibrate groups) or not (control groups), resulting in four diets in total. The formulation of each group diet is presented in Supplementary Table S1, and the diet was made as described previously(Reference Du, Clouet and Degrace12, Reference Kobayashi, Murakami and Obayashi18). Gross energy values of the diets were calculated based on 23·65, 17·16 and 39·77 kJ/g for protein, carbohydrate (N-free extract) and lipid, respectively(Reference El-Sayed and Teshima19). Fenofibrate was purchased from the Sigma Chemical Co. and mixed into the corresponding diet by grade mixing protocol, to the final dose of 200 mg fenofibrate/kg body weight per d when the feeding rate was set as 4 % body weight. The fish weight from each tank was recorded and weighed every 2 weeks, and the feed supply among different groups was adjusted by the exact fish weight with the fixed feeding rate 4 %. Because the fish growth among groups would be different during the trial, the final feed intake (FI) would also be different. During the acclimation and 8-week trial, the fish were fed at 09.00 and 18.00 hours with an equal portion of diet, and all fish could completely eat up all diets within 30 min after each feeding. To limit the possible accumulation of excreted fenofibrate and its metabolites in water, all water was renewed by using stock water daily at 17.00 hours. Water temperature was maintained at 28 ± 1°C and NH4–N2 <0·01 mg/l with a 12-h light–dark cycle. The dissolved oxygen and pH during acclimation and the formal trial were 6·17 ± 0·36 mg/l, 7·26 ± 0·35 and 6·11 ± 0·30 mg/l, 7·30 ± 0·33, respectively.
Growth performance
At the end of 8-week exposure, fish were weighed and the weight gain rate (WGR), FI, protein efficiency ratio (PER), visceral somatic index, mesenteric fat index and hepatosomatic index (HSI) were calculated using the following equations:
 $${\rm{WGR}}\ \left ( {\rm{\% }} \right){\rm{\!\;=\!(final\, weight - initial\, weight) \times 100/}}\left( {{\rm{initial\, weight}}} \right){\rm{;}}$$
 $${\rm{FI }}\ \left ( {{\rm{g/}}\;{\rm{fis}}{{\rm{h}}}} \right){\rm{ }} = {\rm{ feed\, consumption }}\, \left( {\rm{g}} \right)/{\rm{number\, of\, fish}};$$
 $${\rm{PER}}\ \left ( {\rm{\% }} \right){\rm{ = }}\left( {{\rm{fish\, wet\, weight\, gain}}} \right) \times {\rm{100/}}\left( {{\rm{protein\, intake}}} \right){\rm{;}}$$
 $${\rm{VSI}}\ \left ( {\rm{\% }} \right){\rm{ = }}\left( {{\rm{viscera\, weight}}} \right) \times {\rm{100/}}\left( {{\rm{whole\, body\, weight}}} \right){\rm{;}}$$
 $${\rm{MFI}}\ \left ( {\rm{\% }} \right){\rm{ = }}\left( {{\rm{mesenteric\, fat\, weight}}} \right) \times {\rm{100/}}\left( {{\rm{whole\, body\, weight}}} \right){\rm{;}}$$
 $${\rm{HSI}}\ \left ( {\rm{\% }} \right){\rm{ = }}\left( {{\rm{liver\, weight}}} \right) \times {\rm{100/}}\left( {{\rm{whole\, body\, weight}}} \right).$$
Sampling and samples analysis
At the end of the experiment, all fish were fasted for 24 h, and six fish from each group (two fish × three experimental units) were euthanised (MS-222-water solution, 20 mg/l). Each fish was used as an individual sample (n 6) to collect blood and tissues for measurements of the components, molecular or biochemical parameters. The blood was taken by heparinised syringes from the caudal vein, and the plasma was separated from the blood via centrifugation at 3000 rpm for 10 min at 4°C. The plasma and tissues were stored at –80°C until analysis. The weight of each individual fish was recorded, and its viscera, liver and mesenteric fat (the fat attached to the organs) were quickly separated with tweezer (the whole process was completed within 2 min) and weighed. The moisture was analysed by drying the samples to constant weight at 105°C. Protein of whole body and muscle was analysed by Kjeltec™ 8200 (FOSS). The lipid of whole body, liver and muscle were measured by using methanol and chloroform (1:2) as previously described(Reference Lambert and Dehnel20). The plasma glucose, TAG, HDL, LDL, total protein, total amino acid, NH4 and methane dicarboxylic aldehyde (MDA) were assessed using the commercial kits (Jiancheng Biotech Co.). NEFA were measured by ELISA kits (YiFei Co.), and the absorbance was measured at 450 nm using the Multiskan Spectrum microplate reader (Thermo Scientific). The experiment was conducted under the Guidance of the Care and Use of Laboratory Animals in China. The procedures were approved by the Committee on the Ethics of Animal Experiments of South China Agricultural University (protocol number: 2017D006).
Determination of residues of fenofibrate or fenofibric acid in culture water
Three 2-litre water samples from the system were collected into 2·5-litre pre-rinsed amber glass bottles with Teflon-lined caps. Upon collection, all samples were immediately transported at 4°C to the laboratory and vacuum filtered through a 0·45-µm glass fibre filter (Millipore). The solid-phase extraction (carried out with Oasis hydrophilic–lipophilic balance cartridges), clean-up and derivatisation were performed as previously described(Reference Ternes, Stumpf and Schuppert21). Determination of the fenofibrate and fenofibric acid was done by GC-MS (7890B-5977B; Agilent). Injection temperature was 275°C and 2 μl was injected splitless for 1 min. A fused-silica capillary column (length, 30 m; internal diameter, 0·25 mm; film thickness, 0·25 μm) of DB-35 (Agilent) was used. Helium with a purity of 99·9990 % was used as carrier gas. For GC separation, the temperature program started at 65°C (held for 2 min), set at 30°C/min to 180°C, set at 5°C/min to 300°C and was held isothermally for 12 min. Detector temperature was 200°C. The ion-trap MS was run in the full-scan mode from 80 to 400 m/z. The measurement showed that the water residue of fenofibric acid was very low (63 ng/l), while the fenofibrate was not detected (Supplementary Table S5). Because the residue concentration of fenofibric acid was close to the environmental concentration (0–280 ng/l)(Reference Ternes22), and previous report also showed that in zebrafish, 703 μg/l fenofibric acid did not exert any effect on morphometric indices(Reference Madureira, Rocha and Cruzeiro23), the water residue of fenofibric acid in the present study was not likely to affect the fish that were not fed with fenofibrate diet.
Quantitative real-time PCR analyses
Total RNA was isolated by using an RNAiso Plus Kit (Takara). The quality and quantity of the total RNA were determined by using a NanoDrop 1000 (Thermo Scientific), and only RNA with a 260:280 ratio of >1·9 was used for cDNA synthesis. cDNA of the total RNA from the tissues were synthesised using a PrimeScript™ RT reagent kit with a gDNA Eraser (Perfect Real Time) (Takara). β-Actin and elongation factor 1α (EF1α) were used as the reference genes. Our team cloned partial coding region sequences for these two genes of Nile tilapia and deposited them in GenBank (β-actin: KJ126772, EF1α: KJ123689). All the primers used for quantitative PCR were designed to overlap an intron and were provided in Supplementary Table S2. The different PCR products were initially checked by sequencing to confirm the nature of the amplicon. Quantitative PCR was conducted by using SYBR Green Premix Ex Taq (Takara) in a CFX96 real-time PCR system (Bio-Rad). Quantitative PCR efficiency was between 98 and 102 % and the correlation coefficient was over 0·97 for each gene. The PCR reaction volume was 25 μl containing 2·0 μl of cDNA template, 12·5 μl of SYBR Premix Ex Taq, 2·0 μl of PCR primers (5 μm) and 6·5 μl of nuclease-free water. PCR reactions were run with the following program: 95°C for 30 s, forty cycles of 95°C for 5 s and 60°C for 20 s. The melting curves of the amplified products were analysed at the end of each PCR. Each PCR run performed in triplicate and negative controls (no cDNA) was conducted. The relative cDNA abundance was estimated using the 2−ΔCt method, thereof, ΔCt=Cttarget− (CtEF1α+Ctβ-actin)/2.
Statistical analysis
All data were expressed as means and standard deviations and performed using IBM SPSS Statistics 21 (IBM). Two-way ANOVA was used to explore the effects of dietary protein levels, fenofibrate treatment and their interactions. Comparisons between the Control (LP or HP) and Fenofibrate groups were performed using Student’s t tests.
Results
Growth performance and body composition
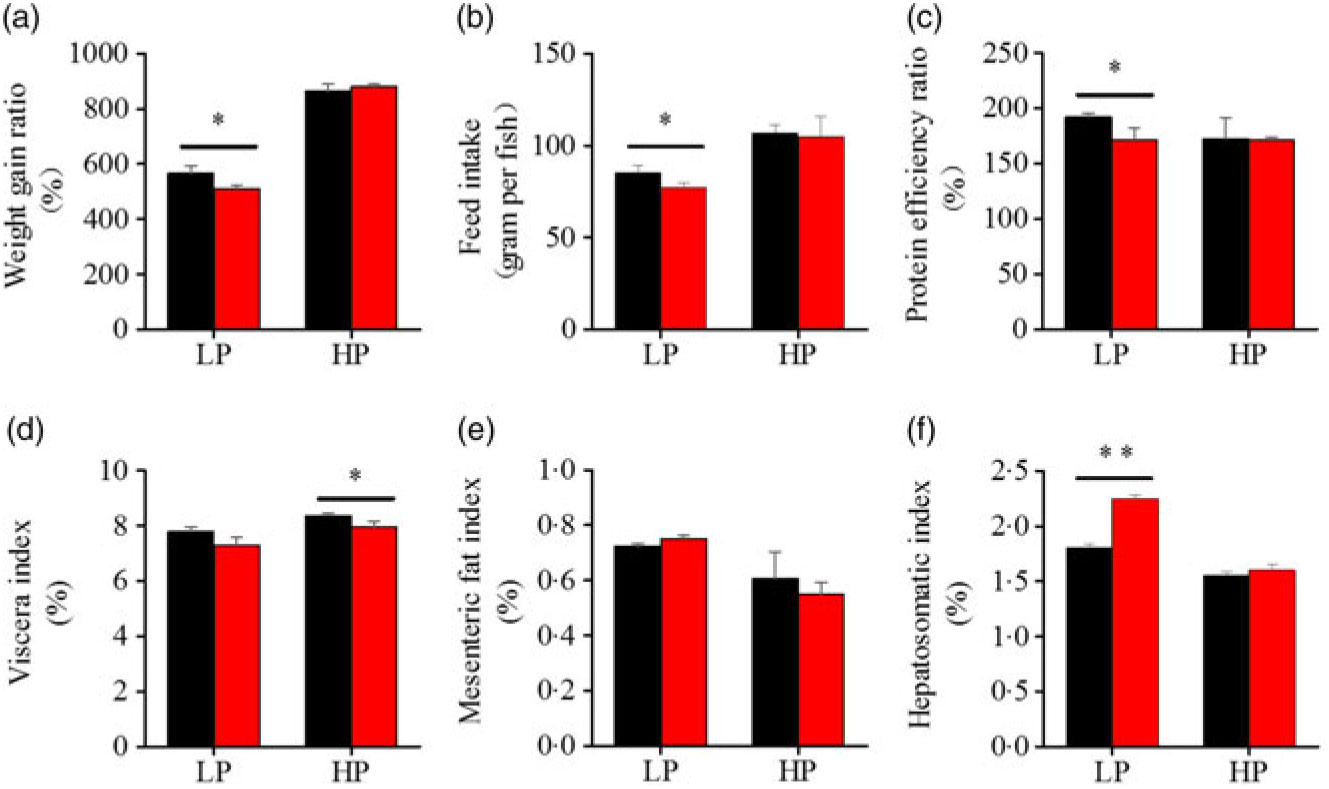
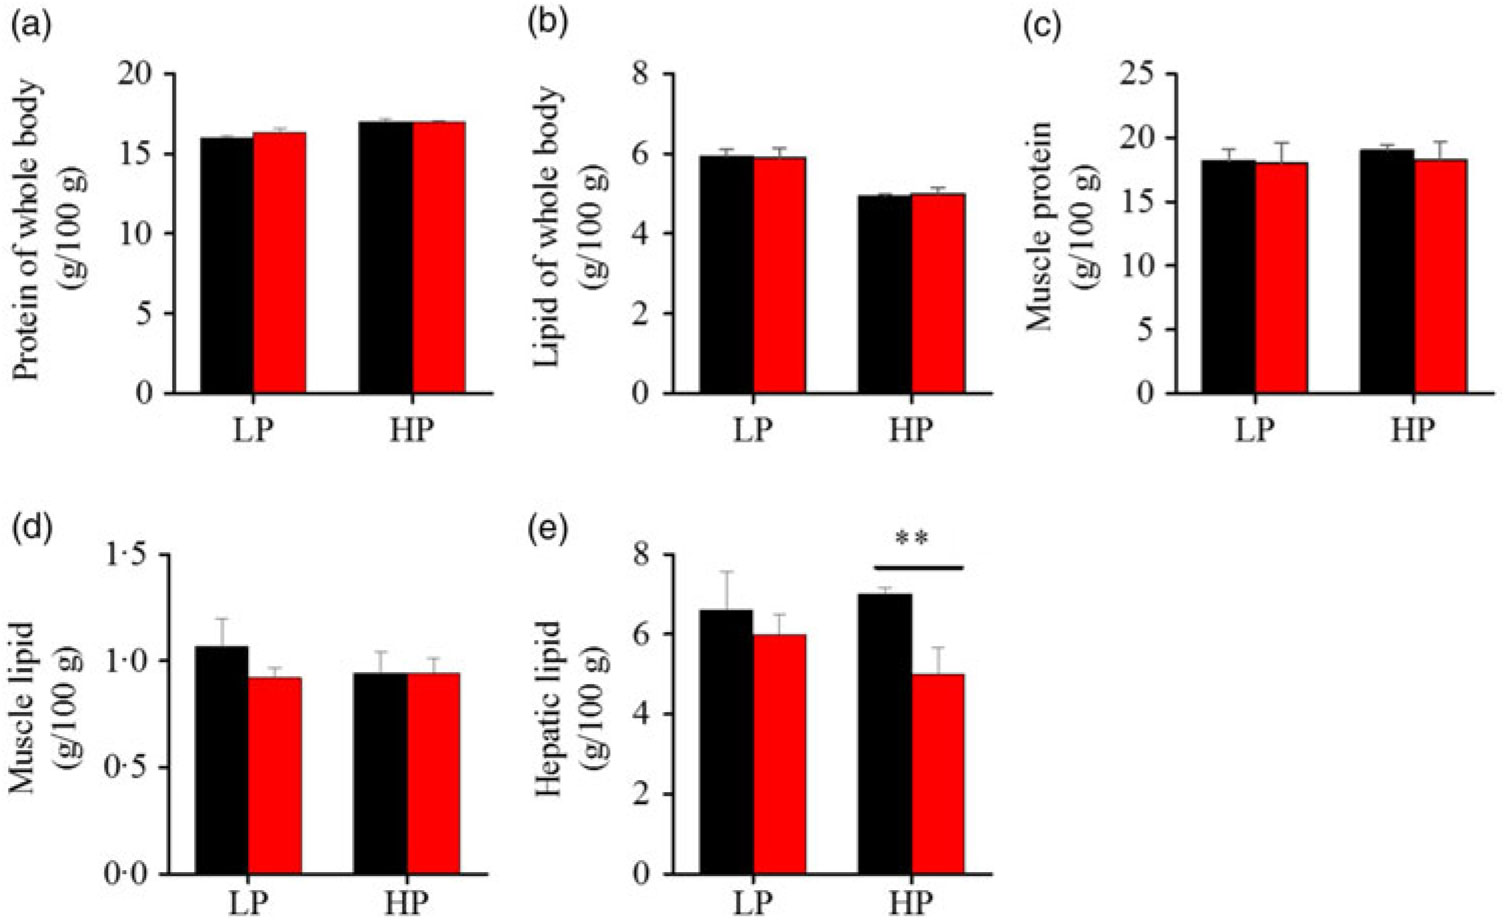
To investigate whether fenofibrate would affect the growth performance and body composition of metabolic regulation at different dietary protein levels, related indices were determined. As shown in Figs. 1 and 2, in the LP group, fenofibrate significantly reduced FI, WGR and PER, but significantly increased HSI, with no effect on the visceral somatic index and mesenteric fat index over the 8-week exposure. In the HP group, 8-week fenofibrate treatment did not reduce FI, WGR and PER, but significantly reduced the visceral somatic index, with no effect on HSI and mesenteric fat index. Nevertheless, fenofibrate did not change the whole body protein and lipid concentrations (Fig. 2(a) and (b)), or the protein and lipid concentrations of muscle (Fig. 2(c) and (d)), except a significantly lower hepatic lipid (HL) in the HP group (Fig. 2(e)). There were no interaction effects of the protein content and fenofibrate found in FI, PER, visceral somatic index, mesenteric fat index in the liver, except in the WGR and HSI (Supplementary Table S4), showing WGR and HSI are simultaneously regulated by protein content and fenofibrate supplementation. These results indicated that fenofibrate did play a lipid-lowering effect in liver of the HP group, while having a negative effect on the weight loss and an increase of HSI in the LP group. No mortality in all treatments was detected during the 8-week trial.
Effects of fenofibrate (![]() ) compared with control (
) compared with control (![]() ) on growth performance in Nile tilapia fed with high-protein (HP) or low-protein (LP) diet. (a) Weight gain rate. (b) Feed intake. (c) Protein efficiency ratio. (d) Visceral somatic index. (e) Mesenteric fat index. (g) Hepatosomatic index. Values are means (n 3), with standard deviations represented by vertical bars. Mean values were significantly different: * P < 0·05, ** P < 0·01 (t test).
) on growth performance in Nile tilapia fed with high-protein (HP) or low-protein (LP) diet. (a) Weight gain rate. (b) Feed intake. (c) Protein efficiency ratio. (d) Visceral somatic index. (e) Mesenteric fat index. (g) Hepatosomatic index. Values are means (n 3), with standard deviations represented by vertical bars. Mean values were significantly different: * P < 0·05, ** P < 0·01 (t test).
Effects of fenofibrate (![]() ) compared with control (
) compared with control (![]() ) on body composition in Nile tilapia fed with high-protein (HP) or low-protein (LP) diet. (a) Protein of whole body. (b) Lipid of whole body. (c) Muscle protein. (d) Muscle lipid. (e) Hepatic lipid. Values are means (n 3), with standard deviations represented by vertical bars. ** Mean values were significantly different (P < 0·01; t test).
) on body composition in Nile tilapia fed with high-protein (HP) or low-protein (LP) diet. (a) Protein of whole body. (b) Lipid of whole body. (c) Muscle protein. (d) Muscle lipid. (e) Hepatic lipid. Values are means (n 3), with standard deviations represented by vertical bars. ** Mean values were significantly different (P < 0·01; t test).
Plasma biochemical parameters
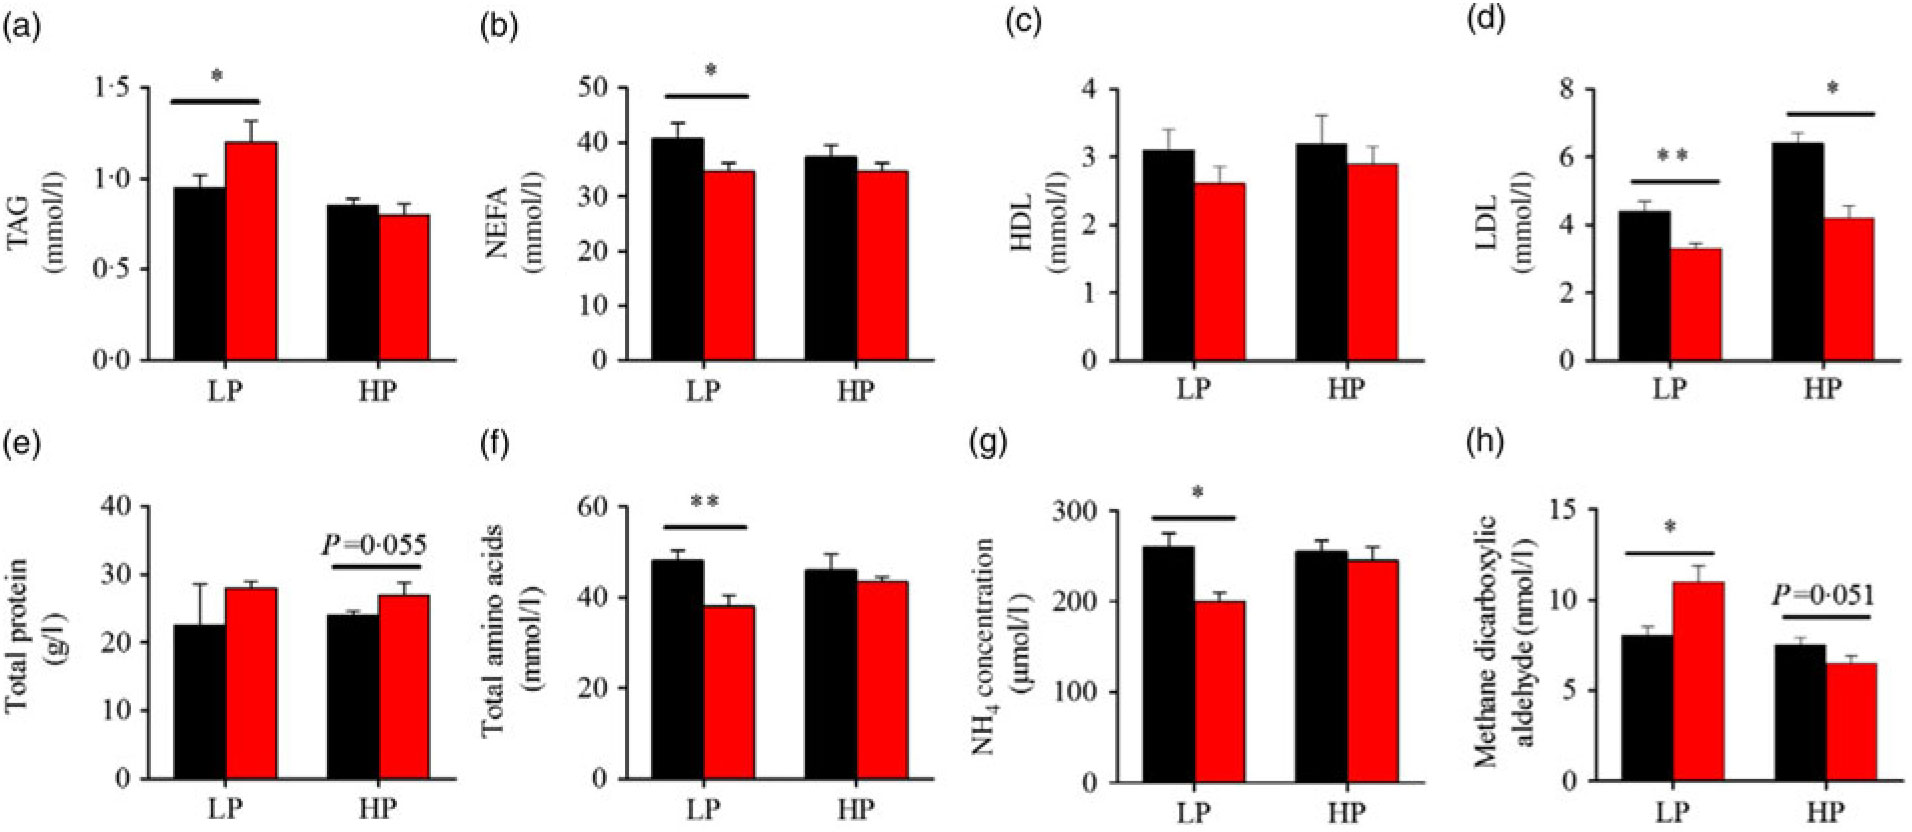
Fig. 3 presents the plasma composition of fish from different dietary protein levels with fenofibrate supplement. Firstly, fenofibrate significantly decreased the plasma NEFA, total amino acid and NH4, but significantly increased TAG and MDA in the LP group (Fig. 3(a) and (b), (f)–(h)). In the HP group, fenofibrate significantly increased the concentrations of plasma total protein, accompanying with a lower MDA (Fig. 3(e), (h)). In addition, fenofibrate significantly decreased LDL in both groups (Fig. 3(d)). The significant interaction between the protein content and fenofibrate was seen in plasma TAG, LDL and MDA (Supplementary Table S4).
Effects of fenofibrate (![]() ) compared with control (
) compared with control (![]() ) on plasma biochemical parameters in Nile tilapia fed with high-protein (HP) or low-protein (LP) diet. (a) Plasma TAG. (b) Plasma NEFA. (c) Plasma HDL. (d) Plasma LDL. (e) Plasma total protein. (f) Plasma total amino acids. (g) Plasma NH4. (h) Plasma methane dicarboxylic aldehyde. Values are means (n 3), with standard deviations represented by vertical bars. Mean values were significantly different: * P < 0·05, ** P < 0·01 (t test).
) on plasma biochemical parameters in Nile tilapia fed with high-protein (HP) or low-protein (LP) diet. (a) Plasma TAG. (b) Plasma NEFA. (c) Plasma HDL. (d) Plasma LDL. (e) Plasma total protein. (f) Plasma total amino acids. (g) Plasma NH4. (h) Plasma methane dicarboxylic aldehyde. Values are means (n 3), with standard deviations represented by vertical bars. Mean values were significantly different: * P < 0·05, ** P < 0·01 (t test).
mRNA expression of lipid metabolism genes in liver
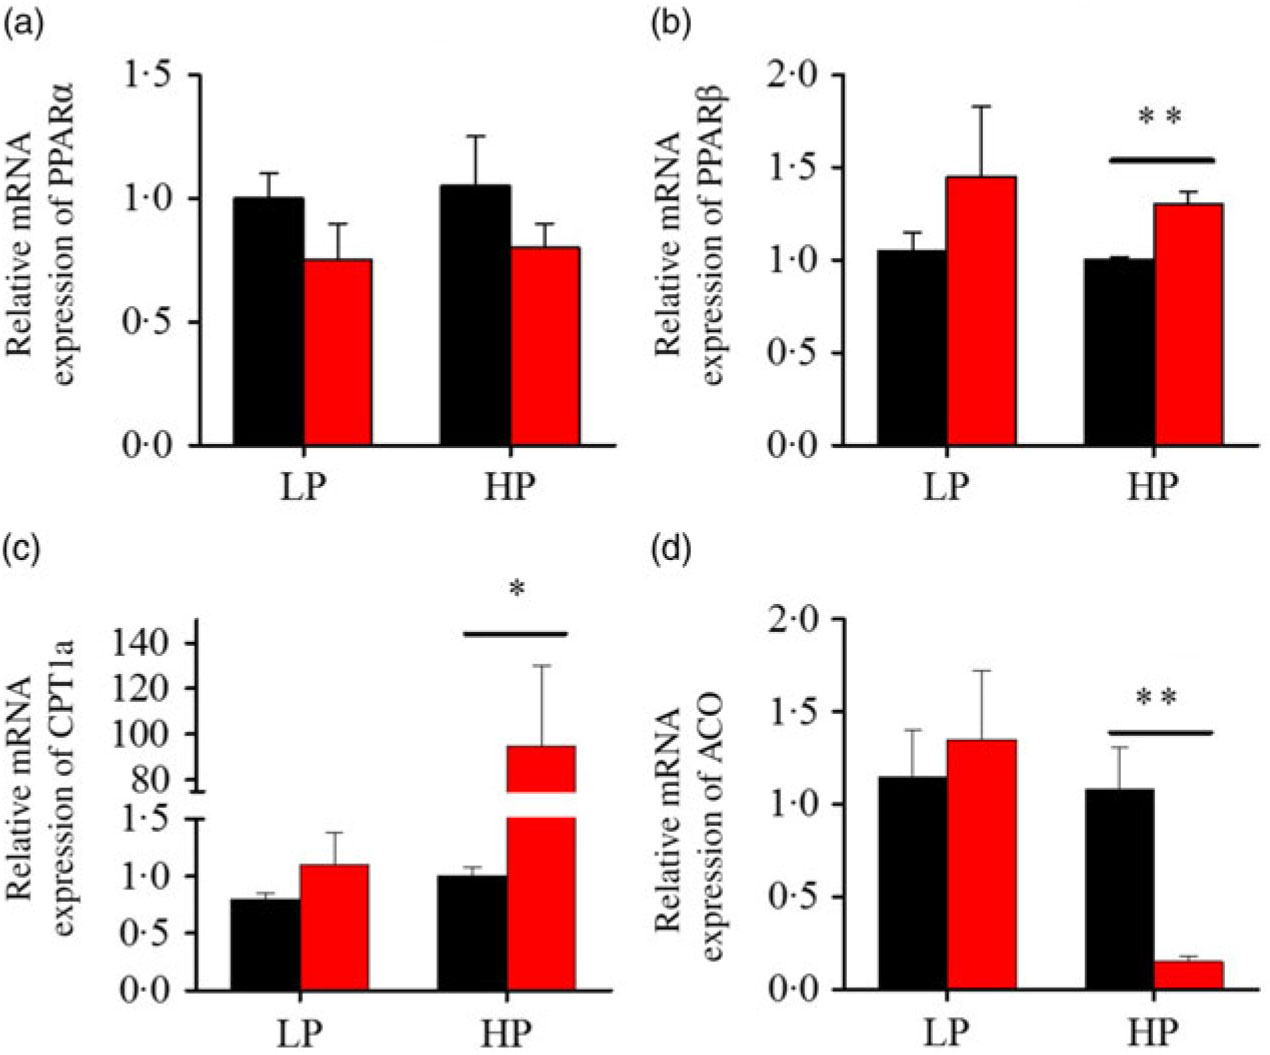
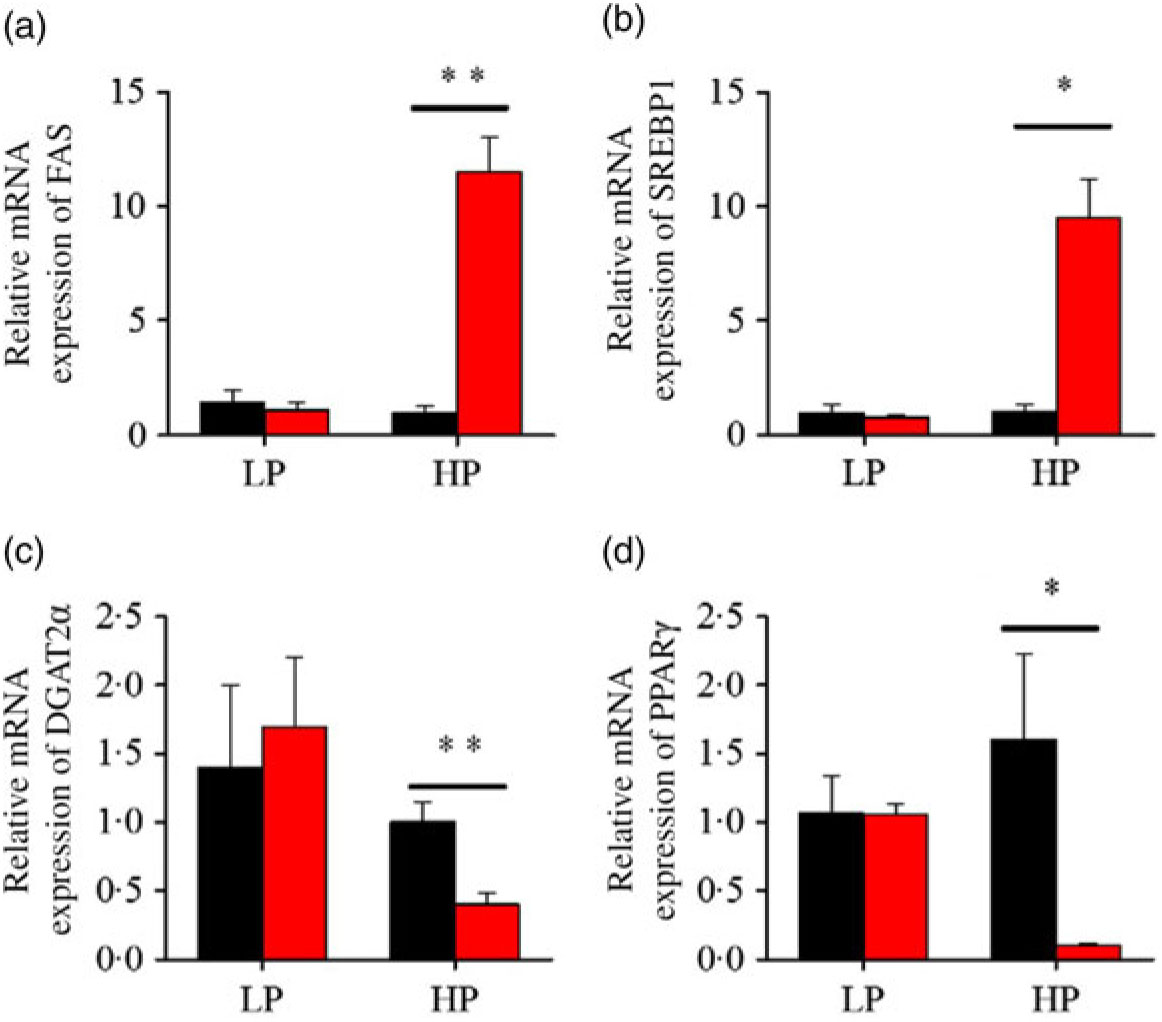
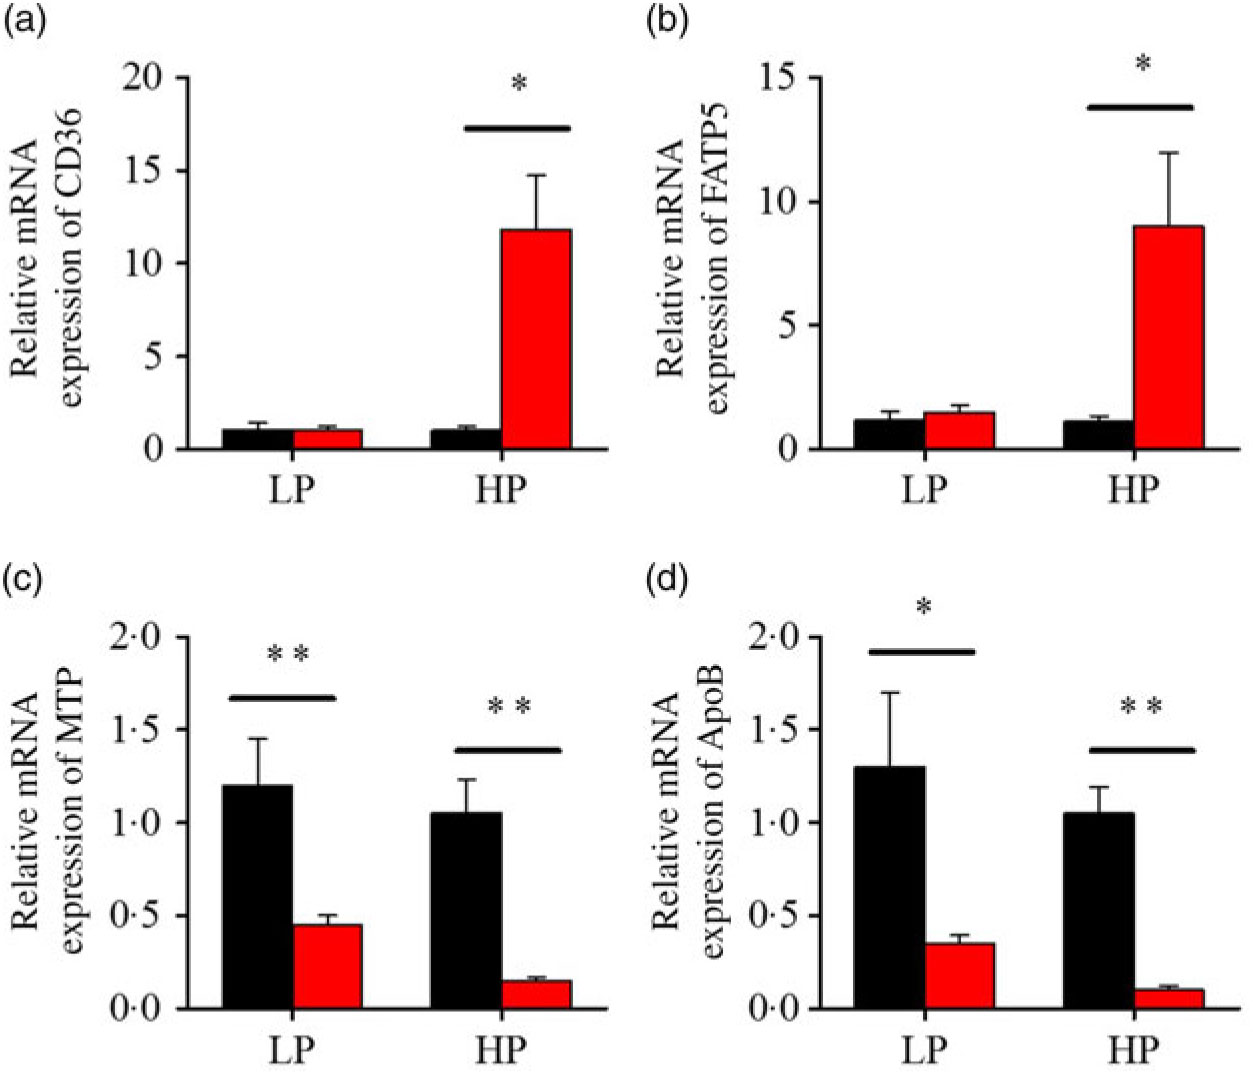
After fenofibrate treatments (Figs. 4–6), the expressions of lipid metabolism-related genes were highly up-regulated in the HP group. However, these genes were slightly down-regulated in the LP group. In general, 91·7 % of genes in the HP group were significantly changed in contrast to 16·7 % of those in the LP group. With respect to the nuclear receptor genes, fenofibrate significantly increased SREBP1c and PPARβ accompanied with a significantly decrease of PPARγ in the HP group (Fig. 4(b) and 5(b) and (d)). No significant difference in most of genes in the LP group was found. There was no significant change of PPARα expression in both groups (Fig. 4(a)). With respect to the genes-related FA transport, fenofibrate significantly increased CD36 and fatty acid transport protein 5 (FATP5) in the HP group (Fig. 6(a) and (b)). For genes-related lipoprotein assembling secretion, fenofibrate significantly decreased microsomal TAG transfer protein and ApoB (Fig. 6(c) and (d)) in both the LP and HP groups. No significantly effect was found in the LP group for genes-related lipid anabolism and catabolism, while fenofibrate significantly increased carnitine palmitoyltransferase 1a (CPT1a) and fatty acid synthase (FAS) accompanied by a decrease of acyl-CoA oxidase (ACO) and diacylglycerol O-acyltransferase 2α in the HP group (Figs. 4(c) and (d) and 5(a) and (c)). Interaction effects between the protein content and the fenofibrate were observed in the mRNA levels of CPT1α, FAS, SREBP1c, PPARγ, CD36 and FATP5 in liver (Supplementary Table S4), showing protein content and fenofibrate both regulated the lipid synthesis and lipolysis.
Effects of fenofibrate (![]() ) compared with control (
) compared with control (![]() ) on the mRNA expression of the genes related to lipid catabolism in liver of Nile tilapia fed with high-protein (HP) or low-protein (LP) diet. (a, b) Relative mRNA abundance of PPARα and PPARβ. (c, d) Relative mRNA abundance of carnitine palmitoyltransferase 1a (CPT1a) and acyl-CoA oxidase (ACO), showing the activity of fatty acid β-oxidation. Values are means (n 3), with standard deviations represented by vertical bars. Mean values were significantly different: * P < 0·05, ** P < 0·01 (t test).
) on the mRNA expression of the genes related to lipid catabolism in liver of Nile tilapia fed with high-protein (HP) or low-protein (LP) diet. (a, b) Relative mRNA abundance of PPARα and PPARβ. (c, d) Relative mRNA abundance of carnitine palmitoyltransferase 1a (CPT1a) and acyl-CoA oxidase (ACO), showing the activity of fatty acid β-oxidation. Values are means (n 3), with standard deviations represented by vertical bars. Mean values were significantly different: * P < 0·05, ** P < 0·01 (t test).
Effects of fenofibrate (![]() ) compared with control (
) compared with control (![]() ) on the mRNA expression of the genes related to lipid anabolism in liver of Nile tilapia fed with high-protein (HP) or low-protein (LP) diet. (a, c) Relative mRNA abundance of fatty acid synthase (FAS) and diacylglycerol O-acyltransferase 2α (DGAT2α), showing the activity of fatty acid and TAG synthesis. (b) Relative mRNA abundance of SREBP1c playing an important regulation role in the activity of lipid synthesis. (d) Relative mRNA abundance of PPARγ. Values are means (n 3), with standard deviations represented by vertical bars. Mean values were significantly different: * P < 0·05, ** P < 0·01 (t test).
) on the mRNA expression of the genes related to lipid anabolism in liver of Nile tilapia fed with high-protein (HP) or low-protein (LP) diet. (a, c) Relative mRNA abundance of fatty acid synthase (FAS) and diacylglycerol O-acyltransferase 2α (DGAT2α), showing the activity of fatty acid and TAG synthesis. (b) Relative mRNA abundance of SREBP1c playing an important regulation role in the activity of lipid synthesis. (d) Relative mRNA abundance of PPARγ. Values are means (n 3), with standard deviations represented by vertical bars. Mean values were significantly different: * P < 0·05, ** P < 0·01 (t test).
Effects of fenofibrate (![]() ) compared with control (
) compared with control (![]() ) on the mRNA expression of the genes related to lipid transport metabolism in liver of Nile tilapia fed with high-protein (HP) or low-protein (LP) diet. (a, b) Relative mRNA abundance of CD36 and fatty acid transport protein 5 (FATP5), showing the ability of fatty acid uptake. (c, d) Relative mRNA abundance of microsomal TAG transfer protein (MTP) and ApoB, showing the activities of TAG-rich lipoprotein assembling and excretion. Values are means (n 3), with standard deviations represented by vertical bars. Mean values were significantly different: * P < 0·05, ** P < 0·01 (t test).
) on the mRNA expression of the genes related to lipid transport metabolism in liver of Nile tilapia fed with high-protein (HP) or low-protein (LP) diet. (a, b) Relative mRNA abundance of CD36 and fatty acid transport protein 5 (FATP5), showing the ability of fatty acid uptake. (c, d) Relative mRNA abundance of microsomal TAG transfer protein (MTP) and ApoB, showing the activities of TAG-rich lipoprotein assembling and excretion. Values are means (n 3), with standard deviations represented by vertical bars. Mean values were significantly different: * P < 0·05, ** P < 0·01 (t test).
Discussion
Although the effects of dietary lipid content on fenofibrate functions in fish have been previously reported( Reference Ning, He and Lu14), whether the lipid-lowering effect of fenofibrate was dependent on the dietary protein levels is unknown. In the present study, the two-way ANOVA did show many interactions between dietary level and fenofibrate treatment as two factors in HSI, TAG, LDL, MDA and gene’s mRNA level of lipid metabolism. Besides, the results indicated that fenofibrate reduced the feeding intake and WGR and increased the oxidative stress and HSI in the LP-fed fish. In contrast, fenofibrate exhibited a lipid-lowering effect as well as up-regulated the genes related to lipid catabolism, transport and anabolic metabolism in the HP-fed fish. These data strongly suggested that the effect of fenofibrate in fish was highly dependent on the dietary protein level.
In the present study, a number of key genes were affected by fenofibrate at different dietary protein levels. CPT1 is an essential and rate-limiting enzyme in the FA β-oxidation. In mammals, CPT1 is encoded by three genes, one being expressed predominantly in the liver (CPT1a) and the second (CPT1b) in the skeletal muscle, and CPT1c is expressed predominantly in the brain and testes(Reference Lavrentyev, Matta and Cook24). However, there is relatively little information on the expression and functions of CPT isoforms in fish(Reference Morash and Le25). Similarly, the members of the FATP family are also not equally expressed in all tissues, implying tissue-specific regulation of the various subtypes(Reference Frohnert and Bernlohr26). In mammals, FATP5 is expressed only in the liver and shows a highest FA transport ability(Reference Hirsch, Stahl and Lodish27). However, as most of other genes, the FATP isoforms have not been fully investigated in fish. In the HP group, fenofibrate decreased the HL content and increased the lipid-catabolism-related gene CPT1a and lipid-transport-related genes CD36 and FATP5, which partially agreed with previous studies on lipid-lowering effect of fibrates in yellow catfish, lactating sows and monkeys(Reference Zheng, Luo and Hu13, Reference Gessner, Grone and Rosenbaum28, Reference Hoivik, Qualls and Mirabile29). Nevertheless, fenofibrate also increased FAS and Srebp1c, the genes related to lipid synthesis in the HP group. Such results may be a physiological compensatory mechanism for the lipid-lowering effect of the fenofibrate in the HP group. Consequently, the concentrations of circulating NEFA were maintained relatively constant (Fig. 3(b)). In fact, a previous study in mice showed that increased PPARα and Srebp1c by fenofibrate treatment collectively ensured proper handling of FA to protect the liver against cytotoxic damage(Reference Oosterveer, Grefhorst and van Dijk30). Conversely, in the LP group, both the HL content and the genes related to lipid metabolism alteration were abolished, and the WGR was significantly reduced. By taking the plasma biochemical parameters into account, a decreased NH4 accompanied with decreased total amino acid in the present study implied that not only amino acid catabolism, but also the protein catabolism was both decreased by fenofibrate in the LP group. Thus, further investigation is warranted in protein synthesis in the LP group. Nevertheless, a dose of fenofibrate (200 mg/kg per d) in the present study reduced the FI as well as the PER (Fig. 1(b) and (c)) in the LP group. Therefore, the observed significant difference in WGR could be mostly attributed to the decreased FI and a negative N balance as reported by previous studies in sheep(Reference Kamalzadeh, Bruchem and Koops31) and mice(Reference Carmona, Louche and Nibbelink32). On the other hand, plasma TAG and MDA were increased, while the expressions of microsomal TAG transfer protein and ApoB, which are two key regulators in the excretion of TAG-enriched lipoprotein (VLDL)(Reference Gibbons, Wiggins and Brown33), were down-regulated in the LP group after fenofibrate treatment. Previous study on Nile tilapia showed that the time to first spawning was significantly longer when fed at low gross energy (14·6 MJ/kg, 30 % protein group) than those fed at 16·7 MJ/kg, 35 and 40 % protein groups(Reference Abdelfattahm and Mamdouh34). Another study also showed that Nile tilapia fed with low-energy diets (12·56 MJ/kg, 30 % protein) exhibited extremely poor growth and feed conversion efficiency with high mortality rates, compared with those fed with moderate- (16·75 MJ/kg, 40 % protein) and high-energy (20·93 MJ/kg, 50 % protein) diets(Reference El-Sayed and Teshima19). Furthermore, fenofibrate was reported to exacerbate energy stress and cell death in three human tumour cell lines which had been induced energy stress by 2-deoxy-glucose (a glycolytic inhibitor)(Reference Liu, Kurtoglu and Leónannicchiarico35). In agreement with these studies, increasing oxidative stress and HSI could further reflect the energy stress induced by fenofibrate in the low energy intake situation (LP-fed fish) (14·5 MJ/kg, Supplementary Table S1). Therefore, the adverse effect of fenofibrate in the LP group might be related to the low energy intake.
Compared with earlier studies, the lipid-lowering effects, accompanied with the increased lipid-catabolism-related genes expression, were consistent only at the HP or high lipid level, instead of at the LP or low lipid level(Reference Ning, He and Lu14). PPARα is recognised as a master regulator of lipid catabolism and could be induced by fenofibrate in both fish and mammals(Reference Fabbrini, Mohammed and Korenblat1, Reference Zheng, Luo and Hu13, Reference Ibabe, Herrero and Cajaraville36). Interestingly, in the present study, PPARβ expression instead of PPARα increased significantly, accompanied with a decreased HL content in the HP group after fenofibrate treatment, in contrast to previous studies that specific PPARα was activated in fish or mammals(Reference Zheng, Luo and Hu13, Reference Casas, Pineau and Rochard37). Previous studies generally used diet with different fat levels rather than different protein levels, which may partly explain the discrepancy among different studies. In addition, PPARβ was reported to play a role as a transcription repressor-regulator of PPARα and PPARγ in 3T3-cells, with the blocked expression of acyl-CoA oxidase(Reference Shi, Hon and Evans38). Similarly, our results showed that PPARβ activation was concomitant with decreasing ACO expression (Fig. 6(a)). Furthermore, CPT1a was induced in the HP group by fenofibrate (Fig. 6(b)), and a previous study showed that CPT1 mRNA expression was highly correlated with the expression of PPARβ in gilthead sea bass white muscle and liver(Reference Boukouvala, Leaver and Favre-Krey39). In contrast to the hypolipidaemic effect of PPARα activation mediated by fenofibrate in HFD, PPARβ was more sensitive to fenofibrate activation in the HP-diet-fed fish. On the other hand, dietary fenofibrate addition induced HL depletion only in high-lipid or HP diet rather than low-lipid or LP diets. The HP diet and HFD could be classified as ‘high energy’ based on the calculation above(Reference Ning, He and Lu14, Reference El-Sayed and Teshima19). Furthermore, fenofibrate increased HSI and induced dysfunction of lipid metabolism in the LP group, in contrast to previous studies which found no alteration of hepatic and plasma lipid content in low-fat-diet-fed fish(Reference Ning, He and Lu14). In fact, when the exact dietary energy was calculated, the gross energy of the low-fat feed was much higher than the LP diet, even close to the HP diet(Reference Ning, He and Lu14). Therefore, these results consistently suggested that the lipid-lowering or adverse effect of fenofibrate in Nile tilapia might dependent on the energy intake of fish feed. Nevertheless, fenofibrate only significantly reduced HL contents but compensatorily up-regulated the lipid-anabolism-related genes FAS and Srebp1c expressions in the HP-fed fish. However, there were no compensatory effect was found in fish fed with HFD(Reference Zheng, Luo and Hu13, Reference Ning, He and Lu14). Thus, these results indicated that the lipid-lowering effect of fenofibrate in fish might not only related to the feed energy content, but also the dietary nutrient composition.
Conclusion
In the HFD-fed mammals, PPARα is regarded as an important transcriptional regulator of the genes involved in lipid breakdown and could be activated by fibrates in mammals. In the present study, we demonstrated that the metabolic regulation of fenofibrate was closely related to both dietary protein and energy levels. We also illustrated that fenofibrate activated PPARβ mRNA expression and played a hypolipidaemic effect only under the HP feeding condition. At the LP-diet-feeding situation, Nile tilapia showed no lipid-lowering effect but induced adverse effects.
Supplementary material
To view supplementary material for this article, please visit https://doi.org/10.1017/S0007114519001594
Acknowledgements
We thank Professor Junming Cao and Professor Yan-Hua Huang,from Guangdong Academy of Agricultural Sciences, for providing great culture conditions.
This research was funded by the National Natural Science Foundation of China (31830102 and 31772859) and the Program of Shanghai Academic Research Leader (19XD1421200).
L. N. and Z.-Y. D. designed the study. Y. L. and L. N. conducted the research, collected and extracted the data. W. W. performed the statistical analysis. L. N. wrote the draft of the manuscript. Z.-Y. D., W. W., Y. L. and L. C. critically revised the manuscript and approved the final version of manuscript to be submitted. All authors read and approved the final version of the article.
The authors declare that there are no competing interests associated with the paper.


