


Introduction
Dietary proteins should supply the nine dietary indispensable amino acids (IAA) in proper proportions and in adequate quantity to allow synthesis of the tissue proteins in the body. The remaining eleven amino acids present in the dietary proteins, though required for body protein synthesis are considered dispensable in the diet, since the body can synthesize them from other carbon and nitrogen sources, although tyrosine and the nutritionally important cysteine are formed from the IAAs phenylalanine and methionine respectively. Since most of the body nitrogen (N) requirement is met by protein nitrogen, protein and nitrogen requirement estimates are used interchangeably. The estimated daily requirement for total protein in humans has recently been reviewed by the joint WHO/FAO/UNU Consultation(1) based on N balance experiments at different N intakes, conducted around the world in different conditions and age groups. The Estimated Average Requirement (EAR) for protein in the adult was determined to be 0·66 g/kg/d and the safe requirement was determined to be 0·83 g/kg/d which is 10 % higher than the recommendations of the earlier 1985 WHO/FAO/UNU Consultation(2). This implies that people, whose protein intakes were considered marginally adequate by the earlier recommendations, would move into the deficient group, using the current recommendations.
The key change in the recent WHO/FAO/UNU consultation(1) was in relation to the requirement for amino acids. In the last two decades, an expanding body of evidence has emerged to suggest that the requirements of IAA are probably higher than previously thought. A review of these data led the WHO/FAO/UNU Consultation(1) to recommend, in the case of adult human beings, the use of revised indispensable amino acid requirement values which are about two to three times higher (Table 1) than the earlier recommendations(2). The earlier estimates of adult IAA requirements were so low that it would have been possible to achieve adequate intakes of IAA's from almost any diet, and dietary protein quality would have been of little practical consequence for adult human protein nutrition. The re-evaluation of the IAA requirement was based firstly, on the inadequacies of the method for measuring IAA requirements from estimations of nitrogen balance(Reference Rose3), and secondly, on the results of experiments based on tracer studies and predicted obligatory amino acid losses(Reference Meguid, Mathews and Bier4–Reference Young, Bier and Pellett6), driven by the work of the late Dr Vernon Young. Newer and more accurate methods of determining daily IAA requirements based on the indicator amino acid method(Reference Kurpad, Regan and Raj7) were considered.
Table 1 Dietary indispensable amino acid (IAA) requirements of adult humans
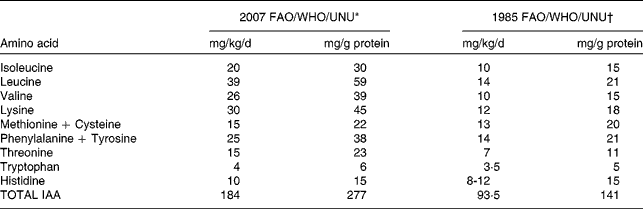
IAA: Dietary indispensable amino acid
* From reference 1
† From reference 2
These new recommendations have implications for dietary protein quality evaluation and Table 2 shows how food proteins that were earlier considered to be of good quality are now deemed to be of poorer quality. The latter findings, along with consideration of the new recommendations for lysine in particular, have profound implications with respect to an assessment of the protein nutritional quality of diets, especially in developing regions, where cereal-based diets, which are limited by lysine, supply the major proportion of the dietary indispensable amino acid intake(Reference Hoshiai8, Reference Young and Pellet9). The populations at greatest risk of dietary lysine inadequacy, therefore, are those in developing regions of the world(Reference Young and Pellet9). This paper will present data on dietary protein intakes in India, with specific reference to the following questions: a) What is the daily protein intake in India and are there north-south differences? b) What are the trends in protein intake in the rural and urban populations in India over the last decade? c) What are the sources of protein in the diet, and what is the quality of dietary protein intake? d) What is the dietary protein: energy (PE) ratio in India? e) What are the dietary protein intakes during pregnancy and lactation?
Table 2 Amino acid scores of different dietary proteins eaten in India
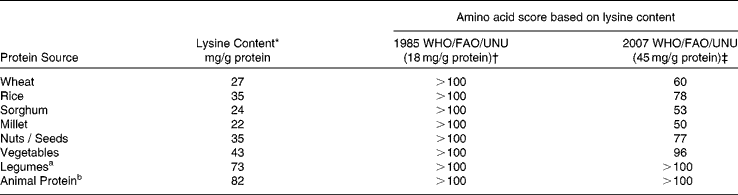
* Source : Reference 30, 31
† Source: Reference 2.
‡ Source: Reference 1
a Limited by sulphur containing amino-acids
b Limited by tryptophan
Methods and results
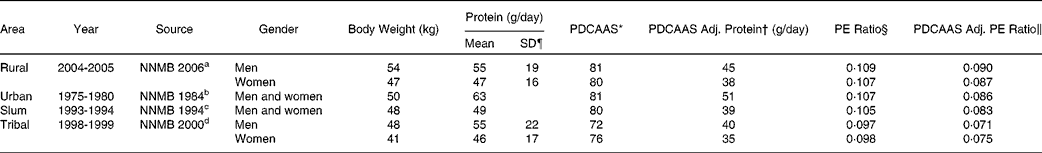
The primary data that were used were from the National Nutrition Monitoring Bureau (NNMB), of the National Institute of Nutrition, Hyderabad, India(10). The NNMB was established in 1972, with surveys of Andhra Pradesh, Gujarat, Karnataka, Kerala, Madhya Pradesh, Maharashtra, Orissa, Tamil Nadu, Uttar Pradesh and West Bengal. The data collected, using standardized pre-tested questionnaires(10), included household demographic and socioeconomic status, individual dietary intake by 24 hour recall, anthropometry, information on population, agricultural production, nutrition and other developmental programs, and in the most recent survey, the prevalence of diet related chronic diseases such as obesity and hypertension. In all surveys, problems include whether the diet is representative of the region as a whole, as well as the variability of the intake within surveys, and from survey to survey. Typically, these are not comprehensive surveys, and usually assess about 100–200 households in a particular area. The methods used are typically 24h recall, with some 20 % of the intakes being validated by a 24h weighing of intake. Between 1000 to 2000 individual's intakes were usually recorded to calculate the mean intake. The average intake of protein was assessed for the rural population(11). For all states surveyed, the protein intake was about 1 gm/kg/day (Table 3). The average intake per day was slightly but not significantly higher in the northern states, but still overall was about 1 gm/kg/day (SD = 0·07). The trends in intake of protein in rural populations(11, 12) showed that over a decade (1995-2005), there was a drop of 7 and 6 gm/day for men and women respectively (Table 4). This represents about 10 % of their protein intakes, but was accompanied by a similar change in their energy intakes, indicating a probable decreased food intake in general. However, in all NNMB reports(11–16), intakes were reported “per Consumption Unit” representing a man or woman weighing 60 and 50 kg respectively, even though actual mean body weights of the studied populations were provided. It would appear that the dietary intakes are actually quite similar over this time period, if standardized for body weight differences. In tribal populations, over a decade, there was no change in protein intake(15)
Table 3 Dietary protein and energy intakes, and the dietary protein: energy ratio in populations in rural India*
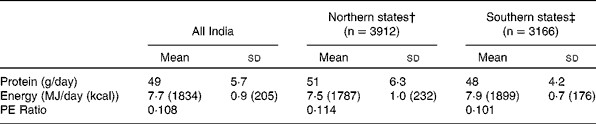
* Source: NNMB, 2006 (from reference 11).
† Northern states: Gujarat, Madhya Pradesh, Maharashtra, Orissa and West Bengal
‡ Southern states: Andhra Pradesh, Kerala, Karnataka and Tamil Nadu
Table 4 Trends in dietary protein and energy intakes in men and women from different areas of India
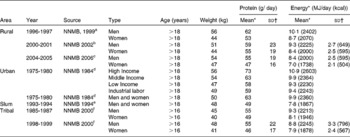
Source: a Reference 12 b Reference 13 c Reference 11 d Reference 14 e Reference 16 f Reference 15
* NNMB values are for a “Consumption Unit (CU)”; this refers to a man and woman weighing 60 and 50 kg respectively.
† SD- Standard deviation provided where available.
Table 5 and Fig. 1 show the contribution of various food groups to the protein intake, based on the latest surveys available(11, 14–16). In general, cereal (including millet) was the highest contributor to protein intake, particularly in rural and tribal populations, and accounted for 57-70 % of the protein intake. In urban men and women, milk and milk products begin to show some significant contribution. The PDCAAS of mixed protein was about 80, while in tribal areas, the PDCAAS was between 72 in men and 76 in women. Given that protein quality may not be adequate, it is also important to correct the protein intake for quality, and by extension, the PE ratio. These values are given in Table 6. The quality protein intake in rural, urban and tribal areas dropped, based on the protein digestibility corrected amino-acid score (PDCAAS), to about 0·8 gm protein/kg/day. If the variability of intake were assumed to be about 30 % (for the rural population the coefficient of variation is about 34 %)(11), then based on an EAR of protein of 0·66 gm/kg/day, the proportion of the sedentary rural population at risk of deficiency would be 32 %, while in sedentary tribal populations, this would amount to about 28 % in men and 37 % in women. Likewise, in the slum, in sedentary people, the risk would be about 30 %.
Table 5 Sources of dietary protein and protein quality in different diets in India (based on the latest available surveys)

Source: NNMB: aReference 11, bReference 14, cReference16, dReference 15
* Food group intakes for each group were taken from each referenced source. The food groups were: cereal & millets, pulses, nuts & oils, flesh foods, milk.
† Protein and lysine content for each food group protein was taken as the average of lysine content of different items in each food group.
● Cereal protein lysine content: taken as rice.
● Millet protein: approximately same as rice
● Pulses: red gram dhal
● Nuts and oils: mean of coconut and groundnut (peanut)
● Flesh foods: Fish and lamb
● Milk: cow's milk
‡ Food lysine content from ref 30. The lysine content of the food eaten may be slightly underestimated, as a mean value of coconut and peanut protein in the nuts/oilseeds intake was assumed.
§ PDCAAS: Protein digestibility corrected amino-acid score, calculated as the product of true faecal–digestibility and amino acid score (AAS); AAS calculated as the ratio of lysine content in digestible mixed protein and lysine content of reference protein.
¶ SD-Standard deviation provided where available.
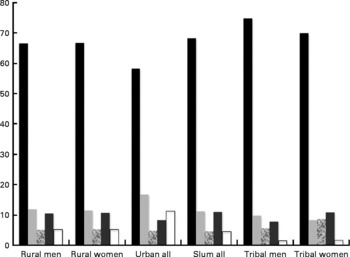
Fig. 1 Percentage contribution of different foods to protein intake. Black bar: cereals and millets; Light gray bar: pulses and legumes; Hatched bar: nuts and oilseeds; dark gray bar: fish and flesh foods; white bar: milk and milk products. ‘Urban all’ and ‘slum all’ refer to mean values for both men and women.
Table 6 Protein quality adjusted intake and PE ratio in different diets
Source: aReference 11, bReference 14, cReference 16, d Reference 15
* PDCAAS: Protein digestibility corrected amino acid score
† Protein digestibility corrected amino-acid score adjusted protein.
§ Protein Energy ratio
∥ PDCAAS adjusted protein-energy ratio.
¶ SD- Standard deviation provided where available
While protein requirements are expressed as a fixed requirement based on body weight, regardless of antecedent adaptations that may or may not be present, energy intake and requirements are dependent on energy expenditure, which in turn depends on activity and possibly adaptations to chronically altered intakes(Reference Soares and Shetty17). If the dietary intake of protein is expressed in terms of the ratio of protein energy to total energy intake (as a protein: energy (PE) ratio) then protein intakes in populations can be assessed in relation to those factors that influence energy requirements, such as age, gender, and lifestyle. Therefore, while the assessment of the PE ratio is a good way to assess the protein contribution in the diet of populations, it is also important to make judgements in the context of the antecedents and BMI of the population studied, their physical activity and the contribution of relatively empty calories, such as fats and sugars to their diet. Potential dietary protein deficiency can be determined in the context of diets that are presumed to meet energy needs. The PE ratio was also corrected for the PDCAAS, and Table 6 shows the PDCAAS corrected PE ratios of the intakes of different populations. To evaluate these, one can calculate the PE ratio of the requirement, based on protein and energy requirements(Reference Millward and Jackson18). While the energy requirement varies depending on the age and activity of the population, the protein requirement is constant. The PE ratio of the requirement is calculated by taking the ratio of the protein requirement (EAR) and the energy requirement. There are several important considerations behind the choice of this formula, and these have been explained in detail elsewhere(Reference Millward and Jackson18). The PE ratio of the requirement was calculated as an average for all adult ages, since the NNMB surveys present data for adults of all ages together. Admittedly, since the average PE ratio of the requirement was not a weighted mean based on the proportion of age groups in the populations surveyed, some error may be present. The mean adult PE ratio of the requirement was 0·073 and 0·075 for sedentary male and female adults respectively. Based on these values, the proportion of the male and female rural sedentary population at risk of inadequate diets (assuming a normal distribution) to meet their protein requirements is 27 and 32 % respectively. As individuals in the population become more active, their requirement PE ratios will fall, since the energy requirement will increase. In such a situation, the risk of a deficient diet would drop considerably. For tribal populations, the risk of an inadequate diet was highest owing to the quality of protein in their diets. When their PDCAAS corrected PE ratio of intakes was assessed against the requirement, in sedentary populations, the risk for inadequacy was 55 and 52 % for male and female adults respectively.
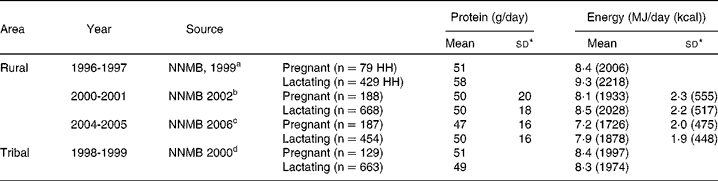
Finally, one can look at protein intakes during pregnancy. Based on accurate measurements of body nitrogen and potassium through pregnancy to measure protein deposition that supported a mean gestational weight gain (GWG) of 13·8 kg, and with the assumption that there is a linear relationship between the amount of GWG and protein deposition, one can then deduce a protein deposition rate for Indian women with a presumed GWG of 10-12 kg(1, 19). The efficiency of utilization of dietary protein (in a small group of women) has been found to be about 42 %(1), and it is unlikely, based on Indian studies(Reference Kurpad, Dwarkanath and Thomas20), that this is different in low BMI women who eat normally. By adding maintenance costs of the additional weight and the maintenance requirement value of protein of 0·66 g/kg/day to the protein deposition requirements, the safe level of increased intake to support a GWG of 10-12 kg is 7-8 and 23-27 gm protein/day in the 2nd and 3rd trimester respectively. Therefore, the question of how much total protein is eaten by pregnant women, particularly during late pregnancy must be addressed. For example, in a woman with an early pregnancy weight of about 50 kg, and a GWG of about 10 kg, the total daily protein requirement in the 3rd trimester would be 73 g/day (50+23 g/day), assuming that, the non-pregnant diet mixed protein PDCAAS was about 80, such that the requirement was about 1 gm/kg/day. Expressed as the total daily protein requirement per kg bodyweight, this requirement would be about 1·2 g protein/kg/day for a woman weighing 60 kg in the 3rd trimester. In addition, the PE ratio of this requirement would be in the range of 0·13. Table 7 shows protein intakes for rural and tribal pregnant women reported by the NNMB(11, 15). It is evident that the protein intakes are low, and have shown no trend towards improving.
Table 7 Trends in protein and energy intake in pregnant and lactating women
Source: a Reference 12, b Reference 13, c Reference 11, d Reference 15
* SD provided where available
Discussion
The quality of protein intakes of rural and tribal populations in India is a cause for concern, given the high proportions of cereal-based protein in their diets. Although high intakes of cereal are also present in the urban populations, the intake of milk (or milk product equivalents) to an extent of greater than 200 ml/day increases the protein quality to an acceptable level. Given that rural populations are about 65 % of the total population, and that tribal populations make up a further 7 %, we thought this approach was reasonable to assess the risk of under-nutrition. In any case, these survey data should be viewed with caution in a transitioning environment. The National Sample Survey Organisation (NSSO) survey(21) in India, which uses household food expenditure to arrive at nutritional intakes, also indicates that about 66 % of the protein in the rural population and 56 % in the urban population is derived from cereals. Further, many of the diets that have been reported were also suboptimal in micronutrients and other dietary constituents. For instance, in the tribal and rural surveys(11, 15), the NNMB report stated that the fruit and vegetable intake was “woefully inadequate”. It seems impossible to quantitatively judge the optimal utilization of protein in these situations, particularly since not all micronutrient intakes are energy dependent. Alternatively, if the protein intake could be linked to some physiological or pathophysiological outcome, a much better functional definition of risk would be available; but that is very difficult to do. In addition, there are so many environmental hazards that it is difficult to pin down protein as the cause of suboptimal function or an adverse outcome; however, studies on lysine requirements in undernourished Indians, before and after eradication of intestinal parasites(Reference Kurpad, Regan and Raj22, Reference Kurpad, Regan and Nazareth23), would suggest that the environmental stresses are real.
Regardless of functional evaluations, dietary protein nutritional quality can be measured by an amino acid score (AAS). This concept, first introduced by Block & Mitchell in 1946(Reference Block and Mitchell24), is now defined as the concentration of the limiting amino acid in the food protein as a proportion of the concentration of the same amino acid in a reference amino acid pattern(Reference Pellett and Young25). The different reference patterns that have been recommended(1, 2) are shown in Table 2. The next step is to identify the first limiting (of the least concentration in mg/g protein) amino acid in various proteins, from different sources, and to use these amino acids in the consideration above. The amino acid score can be made more accurate by the correction for digestibility of the protein source. Thus, the digestibility of mixed vegetable protein diets may approximate 65-85 %(Reference Viteri, Arroyave and Torun26), yielding the PDCAAS. Lysine has been shown to be the most limiting in cereal protein, and in general, is at a much lower concentration in most plant foods (Reference Young and Pellett27, Reference Gopalan, Ramasastry and Balasubramaniam28). The lysine content of legumes is high, and their sulphur containing amino acids are limiting, while animal foods have a high concentration of these amino acids, and are limiting in tryptophan. If the amino acid score is calculated for wheat flour, it would be >100 when the 1985 FAO/WHO/UNU amino acid requirement pattern(2) for the adult is used as the reference pattern. This in effect equates the nutritional value of wheat with that of high quality animal protein foods, such as milk, egg or meats, and there would be no concern with the assessment of the quality of plant protein in adults. On the other hand, for scoring purposes, if the recent 2007 WHO/FAO/UNU pattern(1) is used, a protein quality for wheat of < 50 would be obtained (Table 2). Therefore, a diet containing predominantly cereal, as its protein source, would be a cause of concern, for risk of lysine inadequacy.
It is worth considering the impact of this in the context of an Indian diet, supplying 10 % of the energy intake as protein, which could come largely from cereal sources. For example, if a large proportion of the protein intake comes from cereals, and assuming a protein intake of 62 g (with a coefficient of variation of 20 %), a cereal protein intake of 48 g, a legume (assuming that all non cereal plant protein was legume) intake of 10 g, and an animal protein (milk/eggs/meat) intake of 4 g per day, the lysine intake per day would be about 2400 mg (assuming cereal, legume and animal protein to contain 30, 64 and 85 mg lysine/g protein respectively). For a 60 kg individual, the lysine intake would be 40 mg/kg/d. Further, assuming that this would be utilized to an extent of 70 %(Reference Millward and Jackson18) this would amount to the physiological equivalent of 28 mg/kg/d, which is just about the estimated minimum requirement for lysine. Complementing cereal intake with high quality protein sources is also desirable and an effective way to meet IAA requirements. This underscores the efficacy of legumes or animal (milk) protein in increasing the lysine content of the whole diet. For example, the ratio of cereal to legume in the above diet was about 80:20. In order to improve this diet and achieve a lysine intake of about 3000 mg/kg/d, a change in the cereal: legume ratio, from its previous value, to about 60:40, would suffice. Therefore, a mix of different plant protein sources would be adequate to meet a desirable lysine intake, even when the amount of animal protein was small or negligible.
It is also possible to calculate the risk of dietary protein deficiency in a food-based framework, by calculating the PE ratio after adjusting the protein intake for its quality. This allows the PE ratio to be compared with either the requirement or a reference PE ratio, in which it is assumed that the protein quality is adequate. However, even with this integrated index, there are many unknowns. The physiology of an interaction between protein and energy requirement, or of the interaction between exercise and protein requirement is not taken into account in the reference PE ratio. Since the PE ratio has energy in the denominator, increasing this variable would inevitably reduce the requirement for a high PE ratio. Calculations of protein requirement on the basis of energy intake assume an “average” or “standardized” energy expenditure, and therefore the required protein:energy ratio will be different for people with low energy expenditure and high energy expenditure, contrary to the misconception that higher energy expenditure requires a higher protein intake. The example of the sedentary individual is a case in point here: to satisfy this individual's requirement PE ratio (which would increase because of the lower energy requirement), one would have to drive protein content of the food upward. With a normal diet, in which the protein content is constant, there is the potential for eating more than what is required in terms of energy in order to meet protein needs. This would inevitably result in higher energy intakes and fat accretion. It is tempting to speculate that this is one reason that there is a burgeoning obese population in India, but that would invoke the existence of a speculative protein-stat mechanism that drives appetite, although some data exists to show that there is a satiating effect of protein linked to diet induced thermogenesis(Reference Westerterp-Plantenga, Rolland and Wilson29). However, from a public health viewpoint, it is worth inverting that reasoning to state that it is very important for the sedentary individual to lead an active life with exercise; thereby increasing their energy requirement and lowering their requirement PE ratio to a more attainable level. Equally, the framework within which protein requirements are derived restricts the role of protein to maintaining nitrogen balance and the fat free mass. There are now several lines of evidence that relate to the potential for protein (and its quality) to promote functional benefits beyond the maintenance of nitrogen balance, for example, its anabolic influence on muscle and bone, the regulatory role of leucine on muscle protein synthesis, as well as the role of protein in glycaemic control and appetite(Reference Millward, Layman and Toméreviewed in 30).
It would also appear that the diets of Indian pregnant women do not meet their increased protein requirement. This has also been observed in urban studies in Bangalore (Kurpad et al., unpublished results) and urban and rural studies in Pune in Western India(Reference Kanade, Rao and Kelkar31, Reference Rao, Kanade and Yajnik32), where the protein intakes in the 3rd trimester were well below the required amount. In the Bangalore study, for example, the observed extra protein intake was about 13 g/day versus the GWG based requirement of 23 g/day. This meant that these women had protein intakes that were only slightly higher than 1 g/kg/day, which work out to being about 80 % of the daily total protein requirement. It is not very clear yet whether an intake lower than that required has any effect on birth weight or length probably through a self-regulatory mechanism. Studies on rats(Reference Naismith33) indicate that suppression of amino-acid catabolism occurs through decrease in the activity of enzymes regulating the rate of amino acid deamination and of urea synthesis, thus increasing the amino-acid supply for foetal growth without increasing dietary intake. Amino acid oxidation studied in pregnant women showed that those in whom the decrease in oxidation was greater between the 2nd and 3rd trimester of pregnancy gave birth to infants with higher birth weights, but not birth lengths, probably through the process of adaptation by conservation of amino acid and nitrogen, with preferential partitioning toward net deposition(Reference Duggleby and Jackson34).
One key element in dietary considerations is a focus on the protein quality and content of a predominantly cereal based diet. Simply increasing the intake of a cereal-based diet during pregnancy ensures energy, but not protein, intake. Therefore, the implementation of a balanced diet during pregnancy in these populations presupposes that the quality of dietary protein is given adequate attention. These arguments are borne out in urban affluent women from Pune, India with a large observed range of protein intake(Reference Rao, Kanade and Yajnik32). In that study, energy adjusted protein intake, and particularly milk intake, was related to birth weight outcome.
In summary, while the proportion of individuals at risk of a deficient protein intake is high in rural and tribal adult populations, this occurs against a backdrop of a high prevalence of low BMI, sometimes to an extent of 50 %(15). This is a big burden in disadvantaged populations; it is not simply the burden of enhancing the quality of protein intake but also the quality of the diet in general, and represents a severe challenge that needs to be met.
Acknowledgements
The authors declare that there are no conflicts of interest. All authors drafted, interpreted the data and critically reviewed the manuscript. This research received no specific grant from any funding agency in the public, commercial or not-for-profit sectors.


