


As production of fish for human consumption continues to increase due to higher demand, the expansion of aquaculture has increased the demand for aquafeed. To optimise fish growth, aquaculture relies on feeds that meet the nutritional requirements of the fish while also being as inexpensive as possible. The availability of traditional aquafeed ingredients, especially fishmeal (FM) and fish oil (FO), has not increased with demand(1). Thus, to address this growth and limit environmental impacts of aquaculture, FM and FO must be replaced with renewable, eco-friendly and less expensive ingredients(Reference Naylor, Hardy and Bureau2). For production of rainbow trout (RT, Oncorhynchus mykiss), the total replacement of FM and FO by alternative plant-products negatively affect the feed utilisation of fish, it reduces survival and growth rates compared with commercial diets, due to changes in feeding behaviour among other factors(Reference Lazzarotto, Médale and Larroquet3). This kind of replacement changes the fatty acid (FA) profile. FM and FO are rich in ω-3 long-chain polyunsaturated FAs (ω-3 LC-PUFA), such as EPA and DHA, which are not found in plants. Due to their textural properties, dietary lipids such as ω-3 LC-PUFA can regulate feeding behaviour and influence hedonic sensation or pleasure in mammals, thus specifically influencing the regulation of feeding behaviour after a meal(Reference Martínez-Ruiz, López-Díaz and Wall-Medrano4–Reference Kindleysides, Beck and Walsh6). Thus, the absence of particular FA in plant products could influence feed intake (FI) regulation in fish.
Nutrient sensing plays an essential role in the selection, evaluation and intake of foods by vertebrates(Reference Behrens and Meyerhof7). This sensory system can detect nutrients, which influences the regulation of feeding behaviour(Reference Chaudhari and Roper8). The perception and discrimination of palatable nutrients by the central nervous system is initiated by the activation of specific taste receptors in taste bud cells (TBC). The mechanisms of taste sensation in mammals is well documented(Reference Jaime-Lara, Brooks and Vizioli9). The gustatory system distinguishes five fundamental taste qualities: sweet, salty, umami, sour and bitter. However, when it comes to detecting fats, the reliance shifts towards factors like texture, olfaction and oral irritation rather than only the sense of taste(Reference Liu, Archer and Duesing10). Free FA are detected after cleavage of triglycerides by lingual lipase(Reference Jaime-Lara, Brooks and Vizioli9) due to the activation of specific G protein-coupled receptors called ‘free FA receptors’. Depending on the length of their carbon chain, free FA activate different members of the FFAR family. In mammals, medium- and long-chain free FA (6–12 and > 12 carbons, respectively) activate FFAR1 (GPR40) and/or FFAR4 (GPR120), while short-chain free FA (< 6 carbons) activate FFAR2 (GPR43) and/or FFAR3 (GPR41)(Reference Kimura, Ichimura and Ohue-Kitano11). Activation of these receptors in TBC induces an intracellular signalling cascade (e.g. involving phospholipase C, Ca release-activated Ca modulator (Orai), stromal interaction molecule and sarco/endoplasmic reticulum Ca2+ (Serca)). This increases the amount of intracellular Ca, which depolarises the membrane, facilitating the release of neurotransmitters such as serotonin, which is considered the key neurotransmitter in TBC(Reference Roper12). This signal transduction is then transmitted to the nucleus of the solitary tract in the myelencephalon (medulla oblongata) via gustatory nerves (VII and IX)(Reference Khan, Keast and Khan13). This gustatory signal is propagated to the central level and processed, which regulates feeding behaviour(Reference Laugerette, Passilly-Degrace and Patris14).
For fish, little is known about fat detection or its involvement in regulating FI especially concerning fat sensing(Reference Morais15). Nevertheless, a distinct level of dietary ω-3 LC-PUFA(Reference Roy, Mercier and Tonnet16) and alternative plant ingredients(Reference Roy, Baranek and Mercier17) has been shown to influence RT feeding behaviour, which suggests that palatability influences the perception of fat taste. Although oro-gustatory structures in RT are similar to those in mammals (i.e. the presence of TBC(Reference Abbate, Guerrera and Levanti18) and some sensing receptors(Reference Roy, Baranek and Mercier17)), few studies have focused on the molecular mechanisms underlying lingual fat detection and integrated feeding responses in this species.
In farmed fish, understanding the mechanisms that regulate FI is essential to ensure the development of sustainable aquaculture in a context of changing availability of feed ingredients. This could help to develop specific diets that trigger a positive appetite response (via craving, hedonic sensation or pleasure) and maximise growth performance. Here, we hypothesise that the alteration in growth performance observed in RT fed a V diet from their first meal may be linked to a disruption of their feeding behaviour, which could be itself due to a differential regulation of the nutrient detection system, particularly with respect to ω-3 LC-PUFA.
The present study evaluated the long-term influence (for 8 months from the first feeding) of a vegetable diet devoid of EPA and DHA on the mechanisms that regulate fat detection in RT. To this end, we studied the expression of ffars and their signalling pathways in tongue tissue and assessed the integrated response in the central nervous system. We focused on the signalling pathways involving Ca and serotonin.
Materials and methods
Fish rearing and experimental design
The fry used in this study came from diploid RT females of the same parental stock reared at INRAE’s experimental facilities at Lees-Athas (permit no. A64·104·1, Aspe valley, France). Swimming fry with an initial body weight of 104 ± 0·1 mg were transferred to INRAE’s experimental facilities at Donzacq (permit no. A40–228·1, Landes, France) for the feeding trial. Fingerlings were randomly allocated to five tanks per dietary treatment, with 150 fish per tank. Tanks ranging from 50 to 200 l were used, depending on fish size (maximum stocking density: 22 kg/m3; to avoid any selection, reduction in the number of fish was done randomly), to minimise the influence of tank size on feeding behaviour(Reference Roy, Terrier and Marchand19). The feeding trial was conducted for 8 months (238 d) from the first meal at a constant water temperature (17 ± 1°C), with a natural photoperiod and a water flow rate adjusted to ensure a dissolved oxygen concentration greater than 90 % of saturation. Fish were fed until apparent satiety. Fish were fed seven times a day during the first days then the feeding frequency was gradually decreased to reach two meals per day from 10 grams until the end of the trial. Throughout the trial, dead fish were removed daily and weighed. Every three weeks (21 d, for a total of 11 periods), fish biomass and the quantity of feed distributed per tank were measured to calculate mean body weight, estimated daily FI (in units per day) and estimated feed efficiency, as calculated below. For FI, due to the difference in body weight between the two diets throughout the trial (Fig. 1), these values were expressed per kg metabolic body weight per day. Metabolic body weight was calculated as the geometric mean body weight, as previously described(Reference Saravanan, Schrama and Figueiredo-Silva20–Reference Figueiredo-Silva, Kaushik and Terrier22).
 $${\rm{Growth}} = {{Wf} \over {NBf}}$$
 $${\rm{Feed}}\;{\mkern 1mu} {\rm{intake}} = {{Feed\;distributed} \over {{\raise0.7ex\hbox{${({{Biomass\; + \;Wi} \over 2}){\;^{0.\cdot75}}}$} \mathord{/} }{1000\, *\;day}}} $$
 $${\rm Feed \;efficiency}{\mkern 1mu} = {\mkern 1mu} {{\left( {Biomass\; + \;Wd} \right)\; - \;Wi} \over {Feed\;distributed}}$$
Wf: Final weight
NBf: Final number of fish
Wi: Initial weight
Wd: Death weight
Zootechnical parameters of rainbow trout (RT) fed a control (C) or vegetable (V) diet from first feeding to eight months. Comparison of (a) body weight, (b) feed intake (FI, g feed/kg0·8 d-1) and (c) feed efficiency (FE, g of BW/g of feed) per 3-week period for RT fed the C or V diet from first feeding to eight months (days 238). An asterisk (B and C) indicates a significant difference between the dietary treatments as determined by one-way ANOVA (repeated measures) (P < 0·05). Results are expressed in g as means ± sem (n 5 tanks).

For sampling, fish were first anaesthetised in a benzocaine bath at 30 mg/l and then sacrificed in a benzocaine bath at 60 mg/l. After 8 months of feeding, fish were sampled 20 min and 4 h after the last meal. To characterise the expression and regulation of the gustatory-sensing pathways, tissues were collected after frozen in liquid nitrogen and stored at −80°C. A total of 78 fish were sampled with seven or eight fish per tank and per diet (39 for C and 39 for V). Twenty-eight fish were collected for qPCR analysis (tongue, hypothalamus and myelencephalon), with seven fish per diet (C or V) and per timing (20 min or 4 h after meal). Fourteen fish were collected 4 h after meal for WB analysis (tongue and myelencephalon), with seven fish per diet (C or V). Thirty-six fish were collected for high-pressure liquid chromatography (tongue and myelencephalon) and monoamine oxidase (MAO) analysis (myelencephalon), either nine per diet (C or V), 4 h after meal and for each analysis (high-pressure liquid chromatography and MAO).
Experimental diets
Diets were manufactured at INRAE’s experimental facilities at Donzacq using a twin-screw extruder (BC 45, Clextral). Pellet size was adapted to that of RT throughout the trial: 1 mm from 0–2 months, 2–3 mm from 2–4 months and 4–5 mm from 4–8 months. Two control diets (C diet) and two vegetable diets (V diet) composed of 50 % or 40 % protein were formulated using Allix® software (A-Systems, Versailles, France). The diets (Table 1) were formulated to meet the nutritional requirements of RT as they grew (54·08 % ± 0·45 % protein in the two diet up to 20 g of BW, then 42·03 % ± 0·83 % until the end of the trial)(23). To decrease the protein level, the proportion of whole wheat was increased, while the proportions of wheat and corn gluten were decreased.
Ingredients and composition of the experimental diets as a function of fish mass/age

* Mineral premix: (g or mg kg–1 diet): calcium carbonate (40 % Ca), 2·15 g; magnesium oxide (60 % Mg), 1·24 g; ferric citrate, 0·2 g; potassium iodide (75 % I), 0·4 mg; zinc sulphate (36 % Zn), 0·4 g; copper sulphate (25 % Cu), 0·3 g; manganese sulphate (33 % Mn), 0·3 g; dibasic calcium phosphate (20 % Ca, 18 % P), 5 g; cobalt sulphate, 2 mg; sodium selenite (30 % Se), 3 mg; KCl, 0·9 g; NaCl, 0·4 g (UPAE, INRAE).
† Vitamin premix: (μg or mg kg–1 diet): DL-a tocopherol acetate, 60 μg; sodium menadione bisulphate, 5 mg; retinyl acetate, 15 000 μg; DL-cholecalciferol, 3000 μg; thiamin, 15 mg; riboflavin, 30 mg; pyridoxine, 15 mg; B12, 0·05 mg; nicotinic acid, 175 mg; folic acid, 500 mg; inositol, 1000 mg; biotin, 2·5 mg; calcium pantothenate, 50 mg; choline chloride, 2000 mg (UPAE, INRAE).
‡ Omegavie® DHA 70 (Polaris, Quimper, France): concentrated anchovy and sardine oil that contains DHA n-3 fatty acids in TAG form.
The change in the diet profile occurred between period 4 and 5 (between day 84 and day 105) and between period 5 and 6 (between day 105 and day 126) for the C and V diets, respectively. This change in the proximate composition of the diet did not appear to have impacted the zootechnical parameters, as published elsewhere(Reference Lazzarotto, Médale and Larroquet3). Furthermore, we accounted for differences in animal weight (geometric mean body weight) during measurements of the zootechnical parameters to avoid any potential biases in our analyses as previously published(Reference Saravanan, Schrama and Figueiredo-Silva20–Reference Figueiredo-Silva, Kaushik and Terrier22).
The C and V diets with identical protein content were also isoenergetic (24·79 kJ/g ± 0·41 % dry matter) and isolipidic (22·14 % ± 0·38 % dry matter) (Table 1). The ω-3 PUFA were present in similar percentages in the C and V diets (ca. 30 % FA in the diet), but consisted mainly of DHA in the C diet and α-linolenic acid (ALA) in the V diet (Table 2). This percentage of ω-3 PUFA was chosen to correspond to that found in the marine diet, as previously determined(Reference Lazzarotto, Médale and Larroquet3). The C diet contained FM (27 %), FO (12·1 %) and plant ingredients; the V diet was devoid of FM and FO, which were replaced with a blend of plant ingredients. The blend of vegetable oil in the V diet was chosen to equal the percentages of the main FA classes in the C and V diets. To ensure the same amount of ω-3 PUFA in the diets, DHA was replaced with ALA from linseed oil (10·8 %) in the V diet. To obtain 26 % DHA in the C diet, marine-based oil containing 70 % DHA (OmegaVie® DHA 70 TG; Polaris, Quimper, France) was added (7·3 %) in addition to fish oil (4·8 %).
Fatty acid composition of experimental diets (% of total FA)

Synthetic L-lysine, L-methionine, dicalcium phosphate and soya lecithin were added to all diets to correct deficiencies in essential amino acids, phosphorus and phospholipids(23). A vitamin and mineral premix was also added to each diet. The profile of amino acid of the diet is already published(Reference Heraud, Hirschinger and Baranek24).
Determination of proximate and hFA composition
The nutrient composition of the diets was analysed after 24 h of drying at 105°C. Ash content was determined by combustion in a muffle furnace for 16 h at 550°C. Gross energy was measured using an adiabatic bomb calorimeter (IKA, Heitersheim Grißheimer). Crude protein was determined using the Kjeldahl method(Reference Kjeldahl25). Crude lipids were determined using the Soxhlet method. Total lipid content was extracted, purified and measured gravimetrically according to the Folch method(Reference Folch, Lees and Stanley26) using dichloromethane instead of chloroform. All these analyses were performed following previously described protocols(Reference Heraud, Hirschinger and Baranek24).
Total RNA isolation and real-time quantitative PCR
Total RNA were isolated from the tongue and myelencephalon. Tissues were ground in TRIzol® reagent (Invitrogen) using a tissue homogeniser (Precellys® 24, Bertin Technologies) and 1·4 mm ceramic beads for 2 × $ \!\times\! $
20 s at 3075g, separated by a 15 s break, for the myelencephalon, or 2·8 mm ceramic beads for 2 ×
$ \!\times\! $
20 s at 3075g, separated by a 15 s break, for the myelencephalon, or 2·8 mm ceramic beads for 2 × $ \!\times\! $
30 s at 3720 × g, separated by a 30 s break, for the tongue. The quantities of extracted RNA were measured using a spectrophotometer (ND-1000, Nanodrop, Thermo), and the quality of extracted RNAs was estimated using the 260 nm:280 nm OD ratio (purity of DNA and RNA) and 260 nm:230 nm OD ratio (purity of solution, to avoid phenol contamination). For gene-expression analysis, only total RNA with a 260 nm:280 nm OD ratio exceeding 1·8 and a 260 nm:230 nm OD ratio exceeding 2·0 were utilised.
$ \!\times\! $
30 s at 3720 × g, separated by a 30 s break, for the tongue. The quantities of extracted RNA were measured using a spectrophotometer (ND-1000, Nanodrop, Thermo), and the quality of extracted RNAs was estimated using the 260 nm:280 nm OD ratio (purity of DNA and RNA) and 260 nm:230 nm OD ratio (purity of solution, to avoid phenol contamination). For gene-expression analysis, only total RNA with a 260 nm:280 nm OD ratio exceeding 1·8 and a 260 nm:230 nm OD ratio exceeding 2·0 were utilised.
Two micrograms of total RNA were reverse-transcribed into cDNA using the Super-Script III RNAse H-Reverse transcriptase kit (Invitrogen) and random primers (Promega, Chartonniéres-les-Bains) (Table 3) according to the manufacturer’s recommendations.
Nucleotide sequences of the PCR primers used to evaluate mRNA abundance of transcripts by real-time quantitative PCR

The LightCycler® 480 system (Roche Diagnostics) was used to measure mRNA levels via real-time quantitative PCR (RT-qPCR). The reaction mixture was 6 µl and consisted of 2 µl of diluted cDNA (1:10), 0·24 µl of each primer (10 µmol/l), 3 µl of LightCycler® 480 SYBR Green I Master mix and 0·52 µl of DNAse/RNAse-free water (5 Prime GmbH). Thermal cycling was initiated with incubation at 95°C for 10 min for the initial denaturation of the cDNA and hot-start Taq-polymerase activation, followed by 45 cycles of a two-step amplification program (15 s at 95°C; 10 s at 60°C). Cycle thresholds greater than 35 cycles were not considered. Melting curves were controlled systematically (temperature gradient: 1·1°C/15 s from 65°C to 97°C) at the end of the last amplification cycle to ensure that only one fragment was amplified. During a run, each sample was deposited twice, and two negative controls were added: a pool of samples without reverse transcriptase and a pool of samples without cDNA. The efficiency of all qPCR reactions was 96–100 %. The sequences of amplicons had been previously assessed via sequencing(Reference Roy, Baranek and Marandel27). Data were extrapolated from standard curves and normalised to the housekeeping elongation factor 1α gene (eef1α) in the myelencephalon and keratin 8b gene (krt8b) in the tongue. Relative expression of the target genes was determined using the ΔΔCT method(Reference Pfaffl28).
Indolamine release measurement using ultra-high-pressure liquid chromatography
All reagents and standards were purchased from Merck KGaA (Darmstadt, Germany). All organic solvents used were gradient high-pressure liquid chromatography grade (ADL & Prochilab). Ultrapure water was made daily using a water purification system (Simplicity®, Merk Millipore).
The myelencephalons and tongues were homogenised using a tissue homogeniser (Precellys® 24) in 20 mM phosphate and 1 mM EDTA buffer (pH = 6·5 ± 0·05). An initial centrifugation (14 000 × g, 20 min, 4°C) with a 10 % volume-to-volume metaphosphoric acid solution deproteinised the supernatant. After a second centrifugation (14 000 × g, 5 min, 4°C), the supernatant was filtered with a 0·22 µm polyvinylidene fluoride unit. Metabolite mixtures were stored at −20°C (for no longer than 1 week) until analysis.
Indolamines from standard mixtures and polar metabolite extracts were separated and detected using ultra-high-pressure liquid chromatography (ACQUITY H-Class PLUS System, Waters) equipped with a thermostatted autosampler supported by a fluorescence detector (ACQUITY Multi-λ, Waters). Data were obtained and quantified using Empower™ Pro software (Waters). Chromatographic separation was performed on a ultra-high-pressure liquid chromatography column (150 × 4·6 mm, i.d. 3 μm) at 30°C (PFP(2), Phenomenex, Torrance, CA, USA). The injection volume was 10 μl, and the flow rate was set at 0·4 ml/min.
A quaternary solvent system was used, which consisted of (A) a 10 mM phosphate buffer (pH 4·3 ± 0·05), (B) methanol, (C) ultrapure water and (D) acetonitrile. The mobile phase was filtered through in-line 0·2 μm membrane filters. The following linear gradient elution was used: 0–11 min: 80 % A, 20 % B; 16 min: 50 % C, 50 % D; 16–26 min: 50 % C, 50 % D; 27 min: 80 % A, 20 % B; and 27–35 min (column equilibration): 80 % A, 20 % B. The eluate was monitored using dual excitation/emission fluorescence detection: 285 nm and 355 nm for serotonin (5-hydroxytryptamine; 5-HT) and 5-hydroxyindolacetic acid, respectively. Metabolites of interest were identified by comparing retention times to standards. Quantification was based on integrating peak areas and comparing them to standard calibration curves (R2 > 0·999) of each metabolite of interest. Calibration curves were linear from 0·01 to 3 pmol per injection for serotonin and 5-hydroxyindolacetic acid.
Protein extraction and western blotting
Whole RT tongues were ground with a mortar and pestle under liquid nitrogen, and 200 mg of powder was collected. The tongue and myelencephalon were then homogenised in 1 ml T-Per extraction reagent (#78510, Thermo Fisher Scientific, Waltham, MA, USA) using a tissue homogeniser (Precellys® 24) at 4°C. The homogenates were subjected to two successive centrifugations (1000 × g, 15 min, 4°C and 20 000 × g, 30 min, 4°C), and then supernatants containing cytoplasmic proteins were collected. Protein concentrations were determined using the bicinchoninic acid assay method (#BCA1–1KT, Sigma-Aldrich, Saint Louis, MO, USA). Proteins in the tongue and myelencephalon (20 µg of protein for each) were separated using SDS-PAGE gel electrophoresis with different percentages of acrylamide, depending on the size of the protein (6 %, 7·5 %, 12 % and 15 %) and transferred to a 0·45 µm polyvinylidene fluoride membrane (#IPFL00010, Merk Millipore) via electrophoretic transfer. Membranes were blocked at room temperature for 1 h with an Intercept® phosphate buffered saline (PBS) blocking buffer and then incubated overnight at 4°C with the appropriate primary antibody: ORAI1 rabbit polyclonal IgG (PA5-26378, Invitrogen) (1:2000), STIM1 rabbit monoclonal IgG (D88E10#5668, Cell Signalling) (1:1000), TPH2 rabbit polyclonal IgG (PA5–37 803, Invitrogen) (1:1000), or VMAT2 mouse monoclonal IgG (Sc-374079, Santa Cruz Biotechnology) (1:1000). The specificity of the mammalian antibodies used had been previously assessed via alignment of amino acid sequences of peptides using the SIGENAE database (http://www.sigenae.org) to check for conservation of the antigen sequence with the corresponding sequence from mammals, which ensured good specificity (> 88 %) of the mammalian antibodies used to analyse the samples. The molecular weight of the band agreed with that of the desired protein. Membranes were washed three times with PBS containing 0·1 % TWEEN® 20 (Sigma-Aldrich) and then incubated with the corresponding secondary antibodies for 1 h at room temperature. Membranes were washed three times with PBS containing 0·1 % TWEEN® 20 and twice with PBS. Immunoreactivity was detected using enhanced chemiluminescence after incubating the membrane in Super Signal™ West Pico PLUS Chemiluminescent Substrate (#34 580, Thermo Fisher Scientific) at room temperature. Chemiluminescence was acquired using an imager (iBright FL1500, Thermo Fisher Scientific). Two types of normalisation were required due to the weight of the protein and the protein-loading control. ORAI1 and VMAT2 were normalised using tubulin, while STIM1 and TPH2 were normalised with total protein staining, using No-Stain™ Protein Labelling Reagent (#44717, Thermo Fisher Scientific).
Enzymatic activity
MAO-Glo™ Assay (#V141A, Promega) was used to measure enzymatic activity of monoamine oxidase (MAO) A and B, an enzyme responsible for degradation of serotonin to 5-hydroxyindolacetic acid. Whole RT tongues were ground with a mortar and pestle under liquid nitrogen, and 200 mg of powder was collected and placed in a centrifuge (Eppendorf) with an MAO reaction buffer. The whole myelencephalon was placed in the same centrifuge without prior gr inding. Fractions were separated using centrifugation (5000 × g, 10 min, 4°C). Samples and analysis plates were prepared according to manufacturers’ recommendations. Tongue tissue was diluted two times and myelencephalon 40 times. Mixtures of samples and the MAO solution without luciferin were used as negative controls. To calculate the MAO A signal, we subtracted the mean luminescence of the negative control and then subtracted that of the MAO B reaction.
Statistical analysis
All statistical analyses were performed using R software (version 3.6.1) (R Core Team (2019). R: A language and environment for statistical computing. R Foundation for Statistical Computing, Vienna, Austria) with the R Commander graphical user interface. The tank was the experimental unit for data on growth parameters and one-way ANOVA (repeated measures) was used for statistical analysis of growth parameters. In comparison, individual fish were the experimental unit for data on gene expression, indolamine release, protein abundance and MAO activity. The results were calculated as means ± standard error of the mean (sem). Gene expression data were statistically analysed using two-way ANOVA considering both time and diet as factors. When the interaction between time and diet was found significant, a one-way ANOVA was performed to asses the individual effects of diet or time. When appropriate, analysis was followed by Tukey’s post hoc test. When the normality and homogeneity of variances were confirmed (Shapiro–Wilk and Levene’s test, respectively), t test (student) were performed on the different variables obtained by WB, MAO, high-pressure liquid chromatography and qPCR (Myelencephalon; Fig. 2 and hypothalamus, Fig. 3) analysis. Kruskal–Wallis non-parametric tests were performed when the conditions of application were not respected (for npya, npyb, pomcb, cartpt, MAO B). Differences were considered significant at P < 0·05.
Influence of C and V diets on serotonin-signalling pathways in tongue tissue. (a) Brain concentrations 20 min after feeding of indolamines (serotonin, 5-HIAA and 5HIAA:serotonin turnover ratio in tongue tissue of RT fed the C or V diet for 8 months. Data are shown as means ± sem; fold change compared with the C diet (n 9). An asterisk indicates a significant difference between dietary treatments determined by t test (P < 0·05). (b) mRNA levels of genes involved in metabolic pathways of indolamines (tph1a, tph1b, tph2, 5ht1aa, 5ht1ab, sert, vmat2, mao) in myelencephalon tissue of RT fed the C or V diet for eight months (fold change compared with the C diet for each gene) and measured by RT-PCR 20 min and 4 h after the last meal. Data are shown as means ± sem; fold change compared with the C diet (n 7). An asterisk indicates a significant difference between dietary treatments determined by t test (P < 0·05). (c), (d) Protein abundance 4 h after feeding of TPH2 and VMAT2 measured by western blotting of tongue tissue of RT fed the C or V diet for eight months. Data are shown as means ± sem; fold change compared with the C diet (n 7). An asterisk indicates a significant difference between dietary treatments determined by t test (P < 0·05). (d) Enzymatic activity 20 min after feeding of MAO A and B measured via luminescence of tongue tissue of RT fed the C or V diet for eight months. Data are shown as means ± sem; fold change compared with the C diet (n 9). An asterisk indicates a significant difference between dietary treatments determined by t test (P < 0·05).

mRNA levels of FI markers in hypothalamus at the end of the 8-month feeding period and 4 h after the last meal. mRNA levels of genes involved in FI markers (npya, npyb, agpr1, agrp2, pomca, pomcb, cartpt and mc4ra) in the hypothalamus of RT fed the C or V diet and measured by RT-qPCR 20 min and 4 h after the last meal. Data are shown as means ± sem; fold change 2 –ΔΔCt v. the C diet. t test was performed (n 7).

Results
Zootechnical parameters
Throughout the trial, fish fed the V diet grew statistically less than those fed the C diet for all periods measured (Fig. 1(a), P < 0·05). At the end of the trial, the difference in mean body weight between fish fed the C v. V diet was nearly 34 % (P < 0·05): 337·0 and 228·9 g, respectively. FI was significantly lower for fish fed the V diet for the first three periods (first feeding to 62 d) and from days 125–146 (Fig. 1(b)). FI was significantly higher for fish fed the V diet from days 104–125 and 188–209. Feed efficiency was significantly lower for fish fed the V diet for four 3-week periods (days 20–41, 62–104 and 188–209) (Fig. 1(c)). The survival (data not shown) did not differ between RT fed the C v. V diet (87·0 % ± 3·47 % v. 87·1 % ± 2·02 %, respectively).
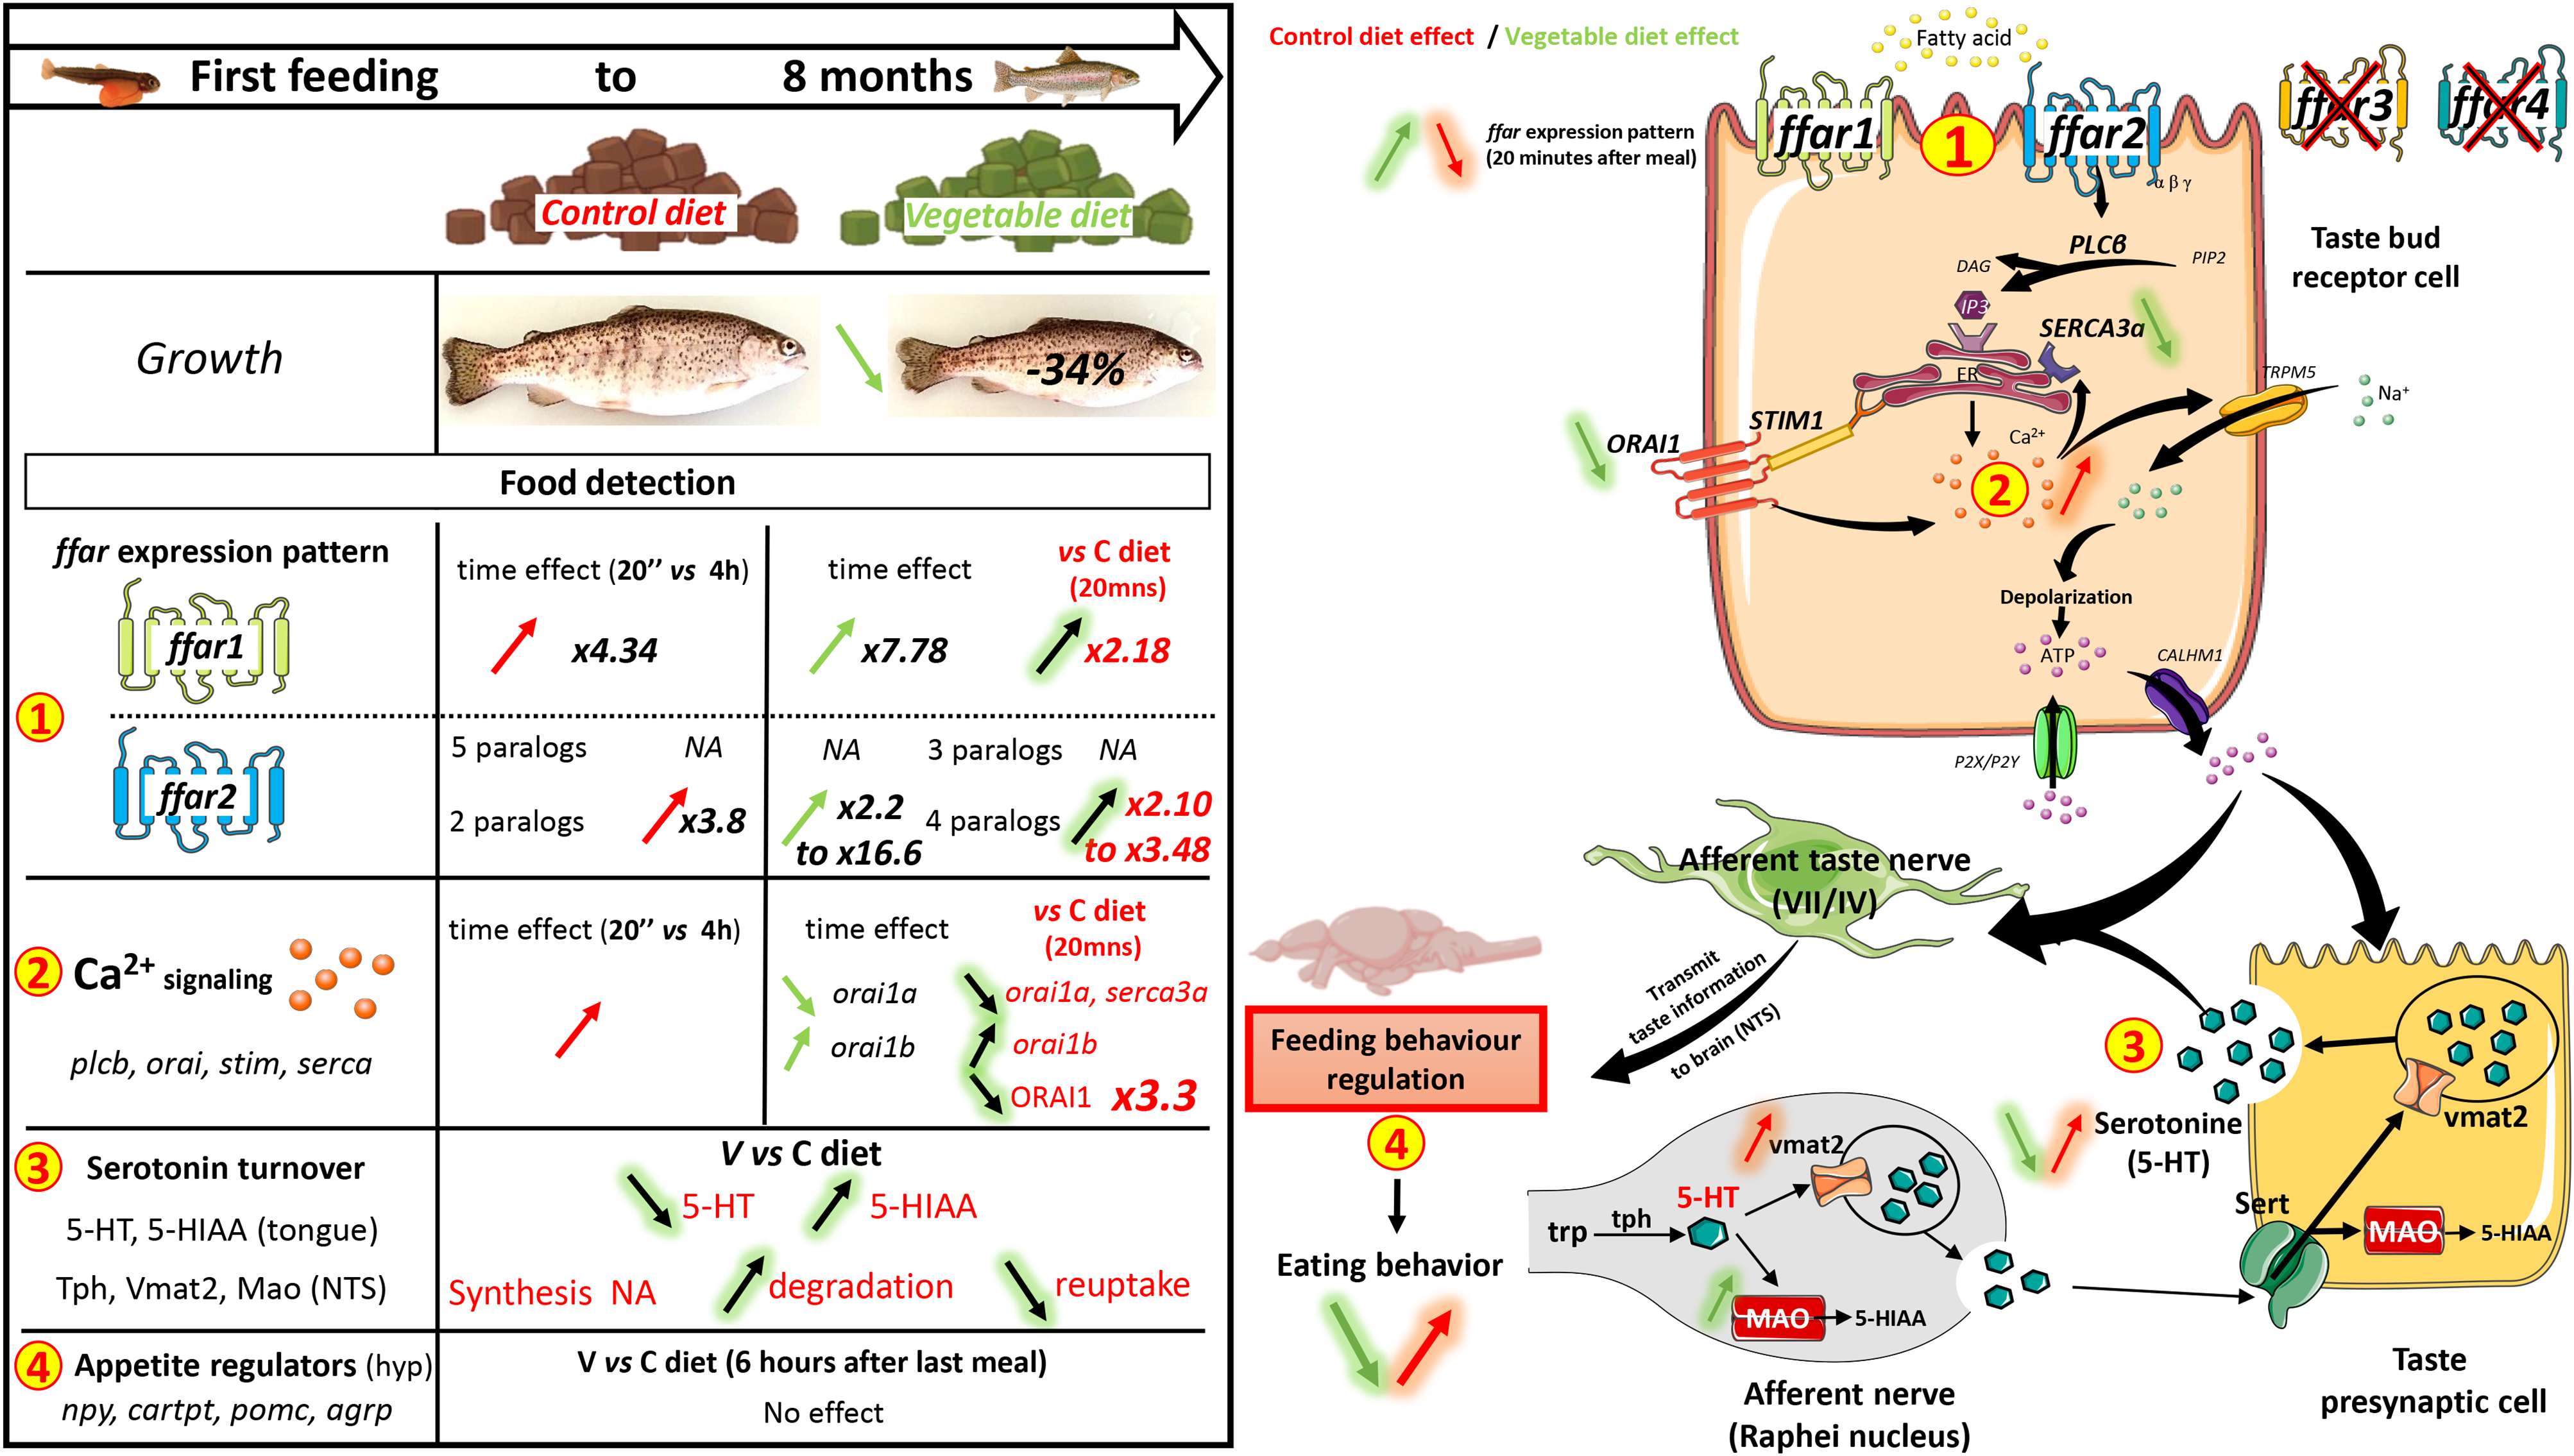
Long-term influence of the V diet on mRNA level of ffar in RT
Expression of ffar1 and ffar2 measured in the tongue of RT 20 min and 4 h after the last meal varied (Fig. 4). The mRNA level of ffar2b1·1, ffar2b1·2 and ffar2b2b2 had the same expression pattern. The highest expression was measured 20 min after feeding for fish fed the V diet. The expression decreased significantly from 20 min to 4 h and reached that measured in fish fed the C diet, for which no significant difference was observed between 20 min and 4 h. The mRNA level also decreased from 20 min to 4 h for ffar2a1a in fish fed the V diet, but not for those fed the C diet. The mRNA level of ffar1 was downregulated between 20 min and 4 h for both diets, but mRNA level at 20 min was significantly higher in fish fed the V diet than those fed the C diet. The mRNA level of the ffar2a2, 2b2a and 2b2b1 isoforms did not differ as a function of time or diet.
mRNA level of ffar at the end of the 8-month feeding period, 20 min and 4 h after the last meal. The mRNA levels of genes of the ffar family (ffar1, ffar2a1a, ffar2a2, ffar2b1·1 ffar2b1·2, ffar2b2a, ffar2b2b1, ffar2b2b2) in tongue tissue of RT fed either the C or V diet were examined after a duration of feeding of eight months. Gene expression analyses were performed at two time points, measured by RT-qPCR 20 min and 4 h after the last meal. Data are shown as means ± sem; fold change 2 –ΔΔCt v. C diet 20 min after feeding for all genes. Two-way ANOVA followed by one–way ANOVA when the interaction was significant, followed by Tukey’s post hoc test; different letters indicate a significant difference (P < 0·05) between diet and time (n 7). ns: not significant.

Calcium-signalling pathway gene expression and protein abundance in tongue tissue
The mRNA levels of Ca-signalling pathway markers in the proximal tongue of fish varied (Fig. 5). Isoforms of phospholipase C showed different kinds of regulation. The mRNA level of plcb2 (phospholipase C β 2) showed a time effect, with higher expression at 4 h for both diets (Fig. 5(a)). The mRNA level of plcb3 increased from 20 min to 4 h after the last meal, but only in fish fed the C diet (Fig. 5(b)). The mRNA level of plcb4 showed higher expression in fish fed the C diet (Fig. 5(c)). The expression of stim1a and stim1b was influenced by a postprandial effect, with increased expression from 20 min to 4 h, regardless of the diet (Fig. 5(d) and (e)).
mRNA levels and protein levels of markers of the Ca-signalling pathway evaluated at the end of the 8-month feeding period, 20 min and 4 h after the last meal. (a)–(e), (g), (h) and (j) mRNA levels of genes involved in the Ca-signalling pathway (plcb2, plcb3, plcb4, stim1a, stim1b, orai1a, orai1b and serca3a) in tongue tissue of RT fed the C or V diet for eight months and measured by RT-qPCR 20 min and 4 h after the last meal. Relative gene expression measured using RT-qPCR. Data are shown as means ± sem; fold change 2 –ΔΔCt v. the C diet 20 min after feeding for all genes. Two-way ANOVA followed by one–way ANOVA when the interaction was significant, followed by Tukey’s post hoc test; different letters indicate a significant difference (P < 0·05) between diet and time (n 7). (f) and (i) Protein abundance 4 h after feeding of STIM1 and ORAI1 measured by western blotting in tongue tissue of RT fed the C or V diet for eight months. Data are shown as means ± sem; fold change 2 –ΔΔCt v. the C diet. t test was performed (n 7). ns: not significant.

For fish fed the C diet, the mRNA level of orai1a and orai1b increased from 20 min to 4 h (Fig. 5(g) and (h)). In contrast, orai1a expression decreased sharply from 20 min to 4 h after feeding, while orai1b expression increased the highest level of the four experimental conditions. The mRNA level of serca3a was upregulated at 4 h, but only for fish fed the C diet (Fig. 5(j)). Protein abundance of STIM1 and ORAI1 was also investigated 4 h after the meal, but neither differed significantly (Fig. 5(f) and (i), respectively).
Serotonin-signalling pathway in tongue tissue and the myelencephalon
For indolamine turnover in the tongue 20 min after feeding, fish fed the V diet had less serotonin than fish fed the C diet, but more 5-hydroxyindolacetic acid; thus, fish fed the V diet had a higher 5HIAA:serotonin ratio than fish fed the C diet (Fig. 2(a)). The mRNA level of genes encoding components of the serotonin-signalling pathway in the myelencephalon varied little: of the genes analysed, only the mRNA level of the serotonin receptor (5ht1aa) increased for fish fed the V diet (Fig. 3(b)). The protein abundance of TPH2 (tryptophan hydroxylase, isozyme of serotonin synthesis from tryptophan) was similar for both diets (Fig. 2(c)), while that for VMAT2 (vesicular monoamine transporter 2 of serotonin) was significantly higher in fish fed the C diet (Fig. 2(d)). The enzymatic activity of MAO A in the myelencephalon was significantly higher in fish fed the V diet (Fig. 2(e)).
Hypothalamus neuropeptide gene expression profile
In the hypothalamus 6 h after the last meal, diets had no influence on the mRNA level of orexigen npy (neuropeptide y) (a and b paralogs) or agrp1 and 2 (agouti-related neuropeptide) or on mRNA level of anorexigenic pomc (proopiomelanocortin) (a and b paralogs) or cartpt (cocaine and amphetamine regulated transcript protein) peptides (Fig. 3). Likewise, diets had no influence on mRNA level in the hypothalamus of mc4ra (melanocortin 4 receptor), a gene-encoding receptor upregulated by anorexigenic POMC peptide and downregulated by AGRP orexigenic peptide.
Discussion
In mammals, taste perception plays a key role in food acceptability and provides critical information about the quality and nature of nutrients. Nutrients interact with specific receptors and induce specific feeding behaviours (consumption or avoidance) that determine growth and survival(Reference Besnard, Passilly-Degrace and Khan29). However, in fish, especially farmed fish, the mechanisms of feed detection that can ultimately influence the regulation of FI are largely unknown(Reference Morais15,Reference Velasco, Otero-Rodiño and Comesaña30) . The present study is the first to identify the mechanism of feed sensing, specifically FAs sensing, in the tongue and brain of RT. Additionally, it highlights the regulation of this mechanism through a comparison between a V diet (with ALA as the primary source of ω-3 LC-PUFA) and a diet containing FM and FO with a high level of DHA.
RT fed the V diet had significantly lower growth rates than those fed the C diet containing marine ingredients (i.e. mean body weight nearly 34 % lower after 238 d). This decreased growth due to diets without FM and FO is well known in the literature, with several studies concluding that RT fed a plant-based diet grew less than those fed a diet containing FM and FO(Reference Lazzarotto, Médale and Larroquet3,Reference Panserat, Kolditz and Richard31,Reference Welker, Barrows and Overturf32) . This decreased growth could be due to changes in feeding or reduced feed efficiency. We assumed that this decreased growth was related to changes in FI, which was lower for RT fed the V diet from first feeding to day 63. This decrease in growth performance due to the V diet could be related to the absence of marine products, such as FM and particularly FO(Reference Kaushik, Cravedi and Lalles33,Reference Gómez-Requeni, Mingarro and Calduch-Giner34) . Plant ingredients have other disadvantages, particularly the imbalance of certain nutrients such as ω-3 LC-PUFA (DHA and EPA), which change feeding behaviour (motivation to consume feed) and decrease growth performance greatly. In the present study, both diets were isolipidic but the C diet was rich in DHA (and to a lesser extent EPA), while the V diet had no EPA or DHA, but contained ALA to maintain the ω-3 LC-PUFA content. Recently, RT were observed to prefer diets rich in EPA and DHA(Reference Roy, Mercier and Tonnet35). Thus, we assume that the level of DHA and EPA in the present study’s diet may have influenced the regulation of FI in trout. Nonetheless, although DHA and EPA were the only FAs in the C diet that were absent in the V diet, the formulation of the two diets differed; thus, the influence on FI may have been related to compounds other than ω-3.
Fish have been studied for their response to various taste modalities, including sourness, bitterness, saltiness, sweetness (sucrose), as well as substances such as acetic or hydrochloric acid, quinine and sodium chloride. However, the compounds that have received the most attention are free amino acid (reviewed by Kasumyan and Døving, 2003)(Reference Kasumyan and Døving36). Free amino acids elicit strong behavioural responses in all fish species, predominantly stimulatory, although some can act as deterrents and, very often, indifferent (no effect on fish behaviour). Although only a few amino acids are known to stimulate the gustatory system in RT, a recent study demonstrated that a single oral administration of proline and glutamic acid decreased feed intake(Reference Comesaña, Conde-Sieira and Velasco37). The effect of proline is consistent with classical electrophysiological studies in rainbow trout, where proline was found to be the most effective amino acid in stimulating both the extraoral surface, the rostral (palate) and posterior parts of the oral cavity(Reference Kohbara and Caprio38). Furthermore, existing literature indicates that carbohydrates are widely recognised as palatable to various herbivorous fish species such as grass carp (Ctenopharyngodon idella). Additionally, carbohydrates have been found to be palatable to omnivorous fish, including dace (Leuciscus leuciscus), roach (Rutilus rutilus), guppy (Poecilia reticulata), black molly (Poecilia sphenops) and platy (Xiphophorus maculatus), whose natural diet in the wild predominantly consists of algae. However, it is noteworthy that carnivorous fish tend to show indifference towards carbohydrates(Reference Kasumyan and Døving36). In RT, one study found that sugars elicited a positive behavioural response (cotton pellets flavoured or not; swallowed v. rejected)(Reference Jones39). In addition, fish are known to be attracted to various substances other than free amino acids and sugars. These include quaternary amines such as betaine (glycine betaine, tri-methylglycine), nucleotides, carboxylic acids (e.g. citricacid, lactic acid, butyric acid, etc.), bile salts, steroid hormones and prostaglandins. For RT, Jones et al. have demonstrated a positive behavioural response to certain amides (acetamide, valeramide and caproic amide), alcohols (hexanol and octanol) and four types of sugars(Reference Jones39). These findings suggest that RT are sensitive to a wide range of compounds not only FA, which may be important to study in the context of alternative plants products.
After 62 d, it is interesting to note that the decrease in FI was not observed. The initial changes observed in FI from day 1 to day 62 did not persist over the long term between 62 to 238 d. While 5 weeks periods were not different in FI between the two diets (including the last period of the trial corresponding to the analyses presented in this study), 2 weeks periods showed better FI on V diet and one for C diet. We postulate that the fish underwent adaptations to accommodate the provided diet, or alternatively, the juvenile fish were compelled to consume it in order to ensure their survival. In a recent study that included a similar formulation, we demonstrated that from the juvenile stage, RT had no preference for a commercial (with DHA and EPA) or plant-based (with ALA but without DHA and EPA) diet using a self-feeder method(Reference Roy, Baranek and Mercier17). Thus, we were interested in the postprandial regulation of FI in RT fed the V diet over the long term. FI are regulated in the central nervous system, where the neural circuitry integrates incoming sensory information via the lingual system to orchestrate an integrated feeding response. Thus, taste receptors in mammals have many functions(Reference Behrens and Meyerhof7). They guide appetite and trigger physiological processes for absorbing nutrients and facilitate the regulation of satiation(Reference Roper and Chaudhari40). In the present study, we observed differential expression of ffar1 and paralogs of ffar2 genes and their signalling pathways depending on the diet. First, ffar1 and four out of seven paralogs of ffar2 were upregulated 20 min after the meal in RT fed the V diet. This is in agreement with studies on rodents(Reference Hichami, Khan, Khan, Palmer and Servant41) that observed higher expression of the ffar4 gene (GPR120) immediately after a meal, which could indicate the influence of postprandial mechanisms in fat-eating behaviour. The literature indicates that activation of ffar1 and ffar4 could result in an anorectic effect that decreases FI. Indeed, Gorski et al. (Reference Gorski, Pachanski and Mane42) showed that early (20 min after meal) activation of FFAR1 (by an agonist) in mice decreases FI (by more than 38 %) and body weight. FI is mainly centrally regulated, which raises questions about whether the influence of FFAR on body weight is due to direct or indirect effects on the central nervous system(Reference Gorski, Pachanski and Mane42). Many studies show that ffars are upregulated immediately after a meal and that FFAR1, 2 and 4 could play a critical role in several physiological homoeostasis mechanisms, especially the regulation of appetite, eating disorders or food preferences(Reference Kimura, Ichimura and Ohue-Kitano11,Reference Sleeth, Thompson and Ford43–Reference Ichimura, Hirasawa and Poulain-Godefroy45) . Our results indicate this also occurs in RT. Ozdener et al. (Reference Ozdener, Subramaniam and Sundaresan46) demonstrated that in humans and mice, incubation of TBC with ALA resulted in the upregulation of ffar4. These results agree with our results that indicate higher expression of the ffars gene 20 min after the meal for fish fed the V diet v. the C diet. However, these studies are unable to relate the expression pattern of ffars to the signalling pathways (no difference in the expression pattern in response to Ca-signalling markers and a decrease in serotonin with the V diet) or the integrated response that we observed. This could be due to other taste receptors associated with the same signalling pathways that could mask the influence of ffar observed in the present study. However, our results suggest that FFAR1 and some paralogs of FFAR2 could be involved in the FA-sensing system. In mammals, this role is performed by FFAR1(Reference Gorski, Pachanski and Mane42) and FFAR4(Reference Auguste, Fisette and Fernandes47). We speculate that FFAR1 and paralogs of FFAR2 in RT could have acquired the function of FFAR3 and FFAR4 reported in similar studies that used other models. However, this must be confirmed in future studies especially in short-term experiment from the first meal where FI appears to be particularly affected for fish fed a V diet.
The binding of free FA on free FA receptors could activate the receptors, resulting in an increase in intracellular Ca concentrations. One of the first actors in this Ca-signalling pathway is plcb, which plays a role in G protein-coupled receptor-mediated signal transduction in RT(Reference Wang, Liu and Wang48) and in the feeding response. The regulation of the three plcb isoforms followed the same trend: they were upregulated 4 h after the meal compared with 20 min in RT fed the C diet. Velasco et al. showed that plcb1 expression was upregulated after 2 h of treatment with a FFAR4 agonist, but not the expression of plcb 2, 3 or 4 in the hypothalamus of RT(Reference Velasco, Conde-Sieira and Comesaña49). In contrast, our observation of the tongue suggested that plcb could be expressed in particular isoforms depending on the tissue considered. Store-operated Ca channels, responsible for Ca entering the cell, are composed of Orai1 and Orai1/3 proteins(Reference Dramane, Abdoul-Azize and Hichami50). Two orai1 isoforms were upregulated after 4 h with the C diet. The postprandial response of the orai1a and orai1b genes differed with the V diet, with orai1a expression downregulated 4 h after the meal, while orai1b expression was upregulated. Studies of rodents showed that orai1 is expressed in TBC and functions in store-operated Ca channels to assure Ca2+ influx after depletion of the endoplasmic reticulum pool induced by LC-PUFA(Reference Shanmugamprema, Muthuswamy and Subramanian51). Thus, our study confirms that the FA profile in the diet can also influence the regulation of orai1 in RT. STIM is another actor involved in opening the store-operated Ca channels. In the present study, the two isoforms (stim1a and stim1b) had higher expression after 4 h for both diets. Shanmugamprema et al. (Reference Shanmugamprema, Muthuswamy and Subramanian51) suggest that stim1 plays a key role in regulating fat taste in mice(Reference Shanmugamprema, Muthuswamy and Subramanian51). These actors of the Ca-signalling pathways are regulated by diet and the FA profile. In RT, they are involved in Ca-signalling pathways in intestinal tissues and are regulated by diet(Reference Calo, Blanco and Comesaña52).
The processing and cerebral integration of gustatory sensory information is complex. The same cell-signalling cascades and molecular actors are involved in activating these receptors. However, the membrane depolarisation that triggers the electrical signal, which is transmitted to the cerebral areas connected to different nerve bundles and cellular structures, differs. Thus, the brain areas involved must be able to process complex signals that are quantitative (i.e. signal intensity depending on the number of molecules bound and receptors activated), qualitative (i.e. discriminating receptors depending on the binder) and hedonic (e.g. good, bad and pleasant) in correlation with internal signals of the body (e.g. hunger, thirst). Thus, in animals (including fish), the large number of sensory receptors and paralogs for the same receptor (e.g. ffar2), combined with the strong discriminating ability of the animal (i.e. several thousand taste molecules), could reflect the presence of highly sophisticated and divergent mechanisms of amplification and coding of sensory information. After oral detection of a nutrient, the signals are transmitted to the brain and induce an integrated feeding response(Reference Behrens and Meyerhof7). However, we observed no differences in the expression pattern of markers in FI in central areas of feeding behaviour regulation. This is puzzling because our results showed that reduced FI had a major influence on RT fed the V diet especially at early stage. It is possible that sampling was not performed during the most suitable postprandial period, even though 6 h postprandial is adequate to study the regulation of these genes by free FA receptors in the hypothalamus of RT(Reference Velasco, Otero-Rodiño and Comesaña30). In addition, FI did not differ between the two dietary groups during the last period of the trial, which could also explain the lack of difference in FI markers in the brain.
The brain’s reward circuitry involved in regulating FI is activated by taste and the consumption of palatable food(Reference Leigh and Morris53), two essential criteria met by dietary lipids such as ω-3 LC-PUFA. Studies have shown that sensory information is related to taste sensitivity and palatability(Reference Narukawa54). Dietary lipids influence feeding behaviour due to their textural properties in the mouth (e.g. gluiness, smooth, succulent, tender and velvety). Thus, beyond a purely neuropeptide regulation, the influence of FI could be related more to hedonic sensations of the diet. A previous study based on the same trial(Reference Roy, Baranek and Mercier17) indicated that changes in the FI of the V diet are related to a decrease in desire to eat rather than changes in the mechanisms of FI (i.e. regulation of appetite neuropeptide). RT can discriminate different levels of ω-3 LC-PUFA in the diet and prefer and consume more of diets richer in ω-3 LC-PUFA(Reference Roy, Mercier and Tonnet35). Based on our results, ω-3 LC-PUFA appear to provide textural properties to feed and render it more palatable, which ALA does not. In mammals, the sensation of fat plays an important role in the desire to eat due to sensory perception and/or pleasure, independent of regulation by the homoeostatic regulatory circuit in the hypothalamus (i.e. regulation of appetite neuropeptide). This is called ‘hedonic eating behaviour’. This hedonic regulation of FI is influenced by sensory and reward signals, which can dominate the homoeostatic control and result in overconsuming foods with high palatability, even when energy requirements have been satisfied(Reference Shanmugamprema, Muthuswamy and Subramanian51). The reward circuit, such as the serotonin system, drives the hedonic motivation for FI. Serotonin signalling occurs in several regions of the brain involved in the homeostatic and hedonic circuits of FI regulation(Reference Galen, Horst and Serlie55,Reference Tavares, do Amaral Almeida and de Souza56) . Serotonin also influences cognitive and behavioural functions, especially depressive disorders, motivation and stress or anxiety-like behaviour when low levels are detected(Reference Bacqué-Cazenave, Bharatiya and Barrière57). We observed a higher level of serotonin in its synthesis areas (i.e. raphe nucleus in the myelencephalon)(Reference Galen, Horst and Serlie55) in RT fed the C diet. The higher level of serotonin associated with the C diet could be due to reuptake and storage in the vesicles(Reference Bacqué-Cazenave, Bharatiya and Barrière57), and not necessarily to an increase in synthesis. This mechanism and the brain turnover of serotonin regulation is the main prototypical neuromodulator involved in the adaptation (for the fine-tuning of most behaviours) of all animals(Reference Bacqué-Cazenave, Bharatiya and Barrière57). This is supported by the higher level of VMAT2, which controls entry of serotonin into the vesicles, and the lower degradation of serotonin related to lower MAO activity (an enzyme that degrades serotonin) in fish fed the C diet. However, the increase in serotonin in tongue tissue in RT fed the C diet cannot explain the increase in their hedonic eating behaviour. In contrast, in previous study of the same RT, we observed a higher serotonin level in the telencephalon, which is the major centre for decision making that receives serotonin neurons inputs in fish, during a fasting period(Reference Heraud, Hirschinger and Baranek24). The telencephalon can be responsible for this hedonic sensation in RT(Reference Díaz-Rúa, Chivite and Comesaña58). In the same way, in this area, the precursor of dopamine (L-DOPA), a neurotransmitter that is a marker of the stress response, motivation and ill-being when high in a chronic situation or due to long-term effects of feeding(Reference Heraud, Hirschinger and Baranek24), was higher in RT fed the V diet. We also demonstrated that RT fed a diet enriched in ω-3 LC-PUFA increased the markers of brain activity that may be associated with higher acceptance of these specific diets (e.g. decrease markers of inflammatory and oxidant status and cortisol pathways; increase genes regulating normal animal behaviour)(Reference Roy, Larroquet and Surget59). The increase in hedonic sensation in RT fed the C diet in the long term may have increased the desire to eat (potentially induced by ω-3 LC-PUFA in the diet). The response of fish fed a plant-based diet in the long term could be interpreted that they do not like the feed and that it does not provide pleasure or stimulate the appetite. Changes in FI would be visible in the initial stage after the first meal and would decrease over time due to the fish’s need to eat to survive. The deregulation of serotonin turnover instead of regulation by the homoeostatic regulatory circuitry in the hypothalamus (regulation of appetite neuropeptide) confirmed this long-term lack of desire to eat. Thus, a dynamic short-term experiment from the first meal could identify this defect in the brain and establishment of this defect in serotonin. It would also be very interesting to understand the relation between the decrease in the fat detection sensing system in the tongue and the decrease in serotonin that causes a defect in hedonic sensation.
Overall, this study was the first to identify that changes in growth performance and FI of RT fed a vegetable diet could be related to an initial change in food detection and a decrease in long-term hedonic sensation (i.e. motivation to eat). We revealed that RT had the same fat-detection mechanisms as mammals (i.e. presence of nutrient receptors in the tongue, early activation of Ca-signalling pathways and serotonin release followed by integrated feeding responses). The vegetable diet induces specific regulations at the lingual level, affecting fat receptors, Ca signalling and early serotonin turnover, while neuropeptides remain unaffected. This modulation of fat sensing may play a role in detecting and integrating brain responses after meals over the long term. These findings have implications for the aquaculture sector, as they can assist in developing specialised diets that stimulate a positive appetite response (such as craving, hedonic sensation or pleasure) and maximise the growth performance of farmed fish from their very first meal, using alternative plant-based ingredients.
Acknowledgments
Authors are very grateful to F. Sandres, who took care of and fed the fish during the trial. The authors also thank K. Dias and V. Véron for their help in training in western blotting and enzyme activity analysis, respectively.
This research was funded by the French National Research Agency (grant no. ANR-21-CE20-0009-01 ‘FEEDOMEGA’).
E. B.: methodology, software, data curation, writing-original draft preparation; C. H.: data curation, software, analysis of indolamine brain concentration; L. L.: data curation, analysed lipid content; A. S.: data curation, analysis of diet composition; A. L. and F. T.: data curation, methodology; S. S. C.: conceptualisation, methodology, writing-review and editing. J. R.: conceptualisation, methodology, software, data curation, writing-original draft preparation, funding acquisition. All authors have read and agreed to the published version of the manuscript.
The authors declare no competing or financial interests.
The trial was conducted in accordance with the Guidelines of the National Legislation on Animal Care of the French Ministry of Research (decree no. 2013–118, 1 February 2013) and following European Union legal frameworks related to the protection of animals used for scientific purposes (i.e. Directive 2010/63/EU). The scientists in charge of the trial received training and personal authorisation. The trial was conducted at INRAE’s NuMeA facilities (·https://doi.org/10·15454/GPYD-AM38) and approved by the ethical committee (C2EA-73) of INRAE ‘Comité d’éthique Aquitaine poissons oiseaux’ (INRAE agreement no. 21 699, 19 December 2019). All efforts were made to minimise the number of fish used and their suffering.
Supplementary material
For supplementary material/s referred to in this article, please visit https://doi.org/10.1017/S0007114523001599


 Open access