


WHO Member States have agreed six Global Targets for Nutrition( 1 ). One target is to increase the rate of exclusive breast-feeding (EBF) in the first 6 months to at least 50 % by 2025 and another target is to halt the increase in childhood overweight. Globally, breast-feeding rates have not improved substantially over recent years and rates of EBF at 6 months are well below the 2025 target in most countries. In low- and middle-income countries reliable monitoring systems report breast-feeding rates less than 40 % EBF in the first 6 months( Reference Victora, Bahl and Barros 2 ), but the average rates in low- and middle-income countries are high compared with those in high-income countries. Interestingly, it appears in low- and middle-income countries that women with low socio-economic status (SES) breast-feed longer than those with high SES, in contrast to high-income countries where the trend appears to be in the opposite direction( Reference Cattaneo 3 ). Mothers of low SES in Europe appear less likely to initiate breast-feeding and cessation occurs early compared with those of high SES( Reference Brown, Raynor and Benton 4 – Reference Kronborg and Væth 7 ). Moreover, infants who are predominantly formula-fed compared with those being exclusively breast-fed for the first 6 months are two-and-a-half times more likely to be obese at 24 months( Reference Gibbs and Forste 8 ) and cessation of EBF before 4 months increases the risk of childhood obesity( Reference Daniels, Mallan and Fildes 9 , Reference Erkkola, Salmenhaara and Nwaru 10 ). Indeed, the prevalence of obesity is also greater among low- compared with high-SES families( Reference Gibbs and Forste 8 , Reference Mäkelä, Vaarno and Kaljonen 11 – Reference Verret-Chalifour, Giguère and Forest 13 ) and obese mothers especially have to overcome more barriers when trying to breast-feed( Reference Rasmussen and Kjolhede 14 , Reference Turcksin, Bel and Galjaard 15 ). It has been suggested that an improvement in EBF rates among low-SES mothers could help reduce health inequalities( Reference Robertson 16 , Reference Hoffmann, Eikemo and Kulhánová 17 ) related to obesity( Reference Robertson 16 ) and resulting morbidity( Reference Cattaneo 3 , Reference Hoffmann, Eikemo and Kulhánová 17 , Reference Leahy-Warren, Mulcahy and Phelan 18 ).
Because of the lack of published studies comparing the rates of breast-feeding across socio-economic groups in Europe( Reference Cattaneo, Yngve and Koletzko 19 , Reference Robertson and Schumann 20 ), the second recommendation in the report Diet, Nutrition and Obesity: Infant Feeding by Socioeconomic Status stated that:
‘Data on breastfeeding prevalence and complementary feeding practices by socio-economic status do exist in many EU Member States. … However, apart from one comparative survey published in 2012 by Ibanez et al., no systematic comparison has been made across EU Member States. It is therefore recommended to collect and compare existing data from each EU Member State on breastfeeding prevalence and complementary feeding practices by socio-economic status (i.e. education, profession, maternity protection, etc.).’
Therefore, the present study aimed to compare breast-feeding rates using the level of maternal education as a proxy for SES( Reference Heck, Braveman and Cubbin 21 ). Given the health benefits for both mothers and their infants( Reference Victora, Bahl and Barros 2 ), low breast-feeding rates in low-SES families are likely to result in high rates of health inequalities which could be prevented through appropriate policy actions.
Methods
A combination of search methods was used between May 2016 and November 2017. This included an Internet-based search of official websites belonging to national authorities along with websites of national and international organizations dealing with breast-feeding. Where national surveys were not found, databases including MEDLINE, CINAHL, EMBASE, Cochrane, PSYCInfo, PubMed and Google Scholar were searched using the keywords: ‘breastfeeding’ AND/OR ‘infant and young child feeding practices’, ‘breastfeeding prevalence’ and ‘breastfeeding statistics’. Data from the most recent breast-feeding survey carried out in each country were sought. The earliest survey was published in 2006 and the most recent in 2016.
To help find surveys published in national languages, Google Translate was used followed by thorough validation of data translations by native speakers knowledgeable about breast-feeding. For example, the national coordinators of the national Baby Friendly Hospital Initiative (Table 1)( 22 ) were asked to confirm national breast-feeding prevalence (personal communications, May–October 2016). Failing contact with a national coordinator, native speakers at the department of Global Nutrition and Health at University College Copenhagen were asked to confirm translations in their national languages.
Levels of maternal education defined according to ISCED classification (low = ISCED 0–2; middle = ISCED 3–4; high = ISCED 5–6)
ISCED, International Standard Classification of Education.
* Bulgaria: only up to secondary level reported in Bulgarian study making it incomparable with other surveys.
† Luxembourg: secondary and higher education were reported together making it incomparable with other surveys.
Twenty-five nationally representative breast-feeding surveys authorized by national authorities were obtained by year of most recent survey: Austria 2007, Belgium 2013, Croatia 2014, Cyprus 2006, Czech Republic 2009, Denmark 2016, Estonia 2016, Finland 2012 and 2009, France 2016, Germany 2015, Greece 2009, Hungary 2014, Iceland 2012, Ireland 2010, Italy 2014, Latvia 2010, Luxembourg 2010, Malta 2015, Netherlands 2015, Poland 2016, Romania 2011, Slovak Republic 2011, Spain 2016, Sweden 2015 and UK 2012. No national studies were found for five countries and for these only sub-national peer-reviewed studies (Bulgaria 2010, Lithuania 2016, Portugal 2007, Slovenia 2010 and Norway 2010) were found. One peer-reviewed study was found for each of EBF at 4 months in France (2016) and breast-feeding at 1 week in Sweden (2016).
Maternal education level
Socio-economic position was represented by maternal education level. Education levels were harmonized according to the International Standard Classification of Education (ISCED)( Reference Gadeyne, Menvielle and Kulhanova 23 ) and defined in three categories: low = levels 0–2 (compulsory, i.e. primary or lower secondary education); middle = levels 3–4 (upper secondary and post-secondary non-tertiary education); and high = levels 5–6 (tertiary education; Table 1).
Breast-feeding variables
For the purpose of comparison, the following breast-feeding variables used in national surveys were grouped together into one variable called ‘any breast-feeding (ABF)’: breast-feeding within the first hour (recommended by WHO( 24 )); ever breast-fed; breast-feeding at all; breast-feeding at birth; and breast-feeding at discharge. In addition, rates on ‘breast-feeding at 1 week’ from Sweden and ‘breast-feeding at <1 month’ from Finland were included in the ABF variable. Three additional ABF variables were created (Table 2) to group the different time frames used in national studies to allow their comparison: ‘ABF at ≤2 months’, which included ABF rates from between 1 and 8 weeks; ‘ABF at ≤4 months’, which included ABF rates from between 8 and 16 weeks; and ‘ABF at 6 months’, which included ABF rates reported at 6 months. Similarly, the wide range of variables used in national surveys to report rates of EBF were grouped together into four variables (Table 3). These were based on the different definitions for time frame used in national studies. The variable ‘EBF at ≤1 month’ included all EBF rates from 1 to 4 weeks. The variable ‘EBF at ≤3 months’ included all EBF rates from 5 to 12 weeks. The variable ‘EBF at 4 months’ included all EBF rates relating to 4 months (e.g. EBF up to 4 months and EBF at least until 4 months). The fourth variable was ‘EBF at 6 months’.
Any breast-feeding (ABF) rate by level of maternal education in twenty-seven EU countries plus Norway and Iceland, 2006–2016
L, low level of education (ISCED 0–2); M, medium level of education (ISCED 3–4); H, high level of education (ISCED 5–6); ISCED, International Standard Classification of Education.
* Bulgaria: maternal education levels incomparable with other surveys.
† Luxembourg: maternal education levels incomparable with other surveys.
‡ Mean duration of ABF: L = 7 months, M = 9 months, H = 11 months.
Exclusive breast-feeding (EBF) rate by level of maternal education in twenty-three EU countries plus Norway and Iceland, 2006–2016
L, low level of education (ISCED 0–2); M, medium level of education (ISCED 3–4); H, high level of education (ISCED 5–6); ISCED, International Standard Classification of Education.
* Median duration of EBF: L = 1 month, M = 1·4 months, H = 2 months.
† Luxembourg: maternal education levels incomparable with other surveys.
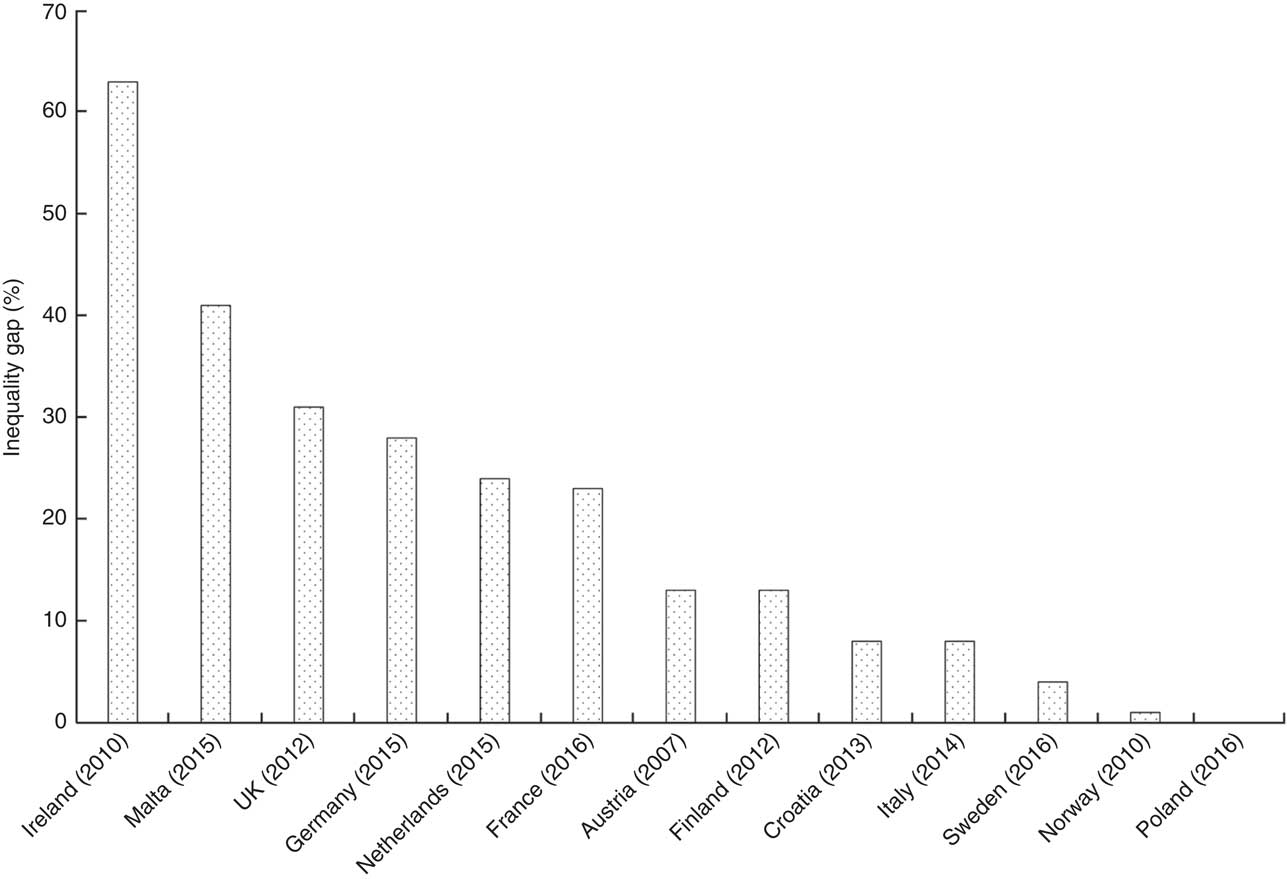
Inequality gap
The inequality gap analysis was carried out by calculating the difference between the breast-feeding rates of mothers with the highest minus the lowest level of education, and expressed as a percentage of the rate in the highest education level( 25 ). The breast-feeding rates of mothers with the highest level of education were used as the highest possible achievable rate for that specific country when calculating the inequality gaps.
Statistical analysis
All data were inserted and cleaned in MS Excel (Microsoft Office 2016). Relative breast-feeding rates with reference to high level of maternal education were computed for middle and low levels of maternal education. For statistical testing, breast-feeding percentage values in the groups by level of maternal education were converted to arcsine values to apply parametrical testing. For comparisons between multiple groups, ANOVA with the post hoc Tukey honest significant difference test was applied and P <0·05 was considered to indicate statistical significance. Breast-feeding cessation rates were evaluated with the matched-pair t test. The statistical software package IBM SPSS Statistics version 24 was used for statistical testing.
Results
The levels of maternal education reported are listed in Table 1 ( Reference Esberger 26 – Reference Häggkvist, Brantsæter and Grjibovski 57 ). No breast-feeding rates by level of education were found for one-third (n 10) of the countries (Belgium, Cyprus, Czech Republic, Estonia, Hungary, Lithuania, Portugal, Slovak Republic, Spain and Iceland). The levels of mothers’ education were grouped into high, medium or low categories using the ISCED classification for those twenty countries that did report breast-feeding rates by level of education. Only eighteen countries could be compared based on the ISCED classification since education levels in Bulgaria and Luxembourg could not be matched to the ISCED classification. Bulgaria’s and Luxembourg’s highest level of education included ‘secondary’ or ‘secondary or higher’, respectively, whereas the ISCED levels 5–6 (i.e. high) include only tertiary education plus bachelor or equivalent and higher but not secondary.
Any breast-feeding
Data on average rates of ABF were found for all except one country (Slovak Republic; Table 2 ( Reference Esberger 26 , Reference Petrova, Rangelova and Popivanova 29 , Reference Dojčinović and Horvat 30 , Reference Johansen, Krogh and Pant 32 , Reference Uusitalo, Nyberg and Pelkonen 36 , Reference Vilain 38 – Reference Gaki, Papadopoulos and Jasmine 40 , Reference Williams, Greene and McNally 43 , 45 , Reference Desroches, Brochmann and Wagener 47 , Reference Borg, Busuttil and Gauci 49 , Reference Peeters, Lanting and van Wouwe 52 , Reference Nanu, Moldovanu and Novak 53 , Reference Magnusson, Lagerberg and Wallby 55 – 71 )). The dates when ABF rates were published ranged from 2006 to 2016: the oldest in Cyprus in 2006; Austria and Portugal in 2007; Greece in 2009; six countries (Bulgaria, Latvia, Ireland, Luxembourg, Slovenia and Norway) in 2010; three countries (Czech Republic, Romania and Slovak Republic) in 2011; three countries (Finland, UK and Iceland) in 2012; Belgium in 2013; three countries (Croatia, Hungary and Italy) in 2014; three countries (Germany, Malta and Netherlands) in 2015; and seven countries (Denmark, Estonia, France, Lithuania, Poland, Spain and Sweden) in 2016. In addition to the wide time span between the dates of publication, each country also used different time frames and variables for reporting their ABF rates. The time frames ranged from infant ever breast-fed, initiation at birth, within the first hour, at discharge and from breast-feeding at a range of weeks and/or months, up to 6 months. This resulted in about seventy different variables for ABF. In an attempt to compare the wide range of time frames they were grouped into four: any breast-feeding (ABF); ABF at ≤2 months (1–8 weeks); ABF at ≤4 months (8–16 weeks); and ABF at 6 months (Table 2).
Average ABF rates above 90 % were found in thirteen countries: Finland (99 %), Norway (99 %), Iceland (98 %) Poland (98 %), Slovenia (97 %), Czech Republic (96 %), Hungary (96 %), Sweden (96 %), Bulgaria (95 %), Austria (93 %), Croatia (93 %), Romania (93 %) and Portugal (91 %; Table 2). Average ABF rates between 80 and 90 % were found in seven countries: Luxembourg (90 %), Greece and Latvia (88 %), Italy (86 %), Germany (82 %), UK (81 %) and Netherlands (80 %). Average ABF rates between 70 and 80 % were found in three countries: Cyprus (79 %), Belgium (75 %) and Malta (71 %). The lowest rates of ABF were found in France and Ireland, 66 and 57 %, respectively. Average ABF rates at ≤2 months were highest (>80 %) in Nordic countries, Estonia and Bulgaria: Norway (94 %), Bulgaria (93 %), Iceland (92 %), Finland (92 %), Denmark (90 %), Estonia (88 %) and Sweden (86 %). Average ABF rates above 50 % at 4 months were found in six countries: Austria (72 %), Romania (71 %), Lithuania (64 %), Netherlands (59 %), Portugal (55 %) and Spain (54 %); and average ABF rates below 50 % at 4 months in Poland (46 %), Greece (39 %), Luxembourg (45 %) and Italy (42 %). Average ABF rates at 6 months were reported by fourteen countries, where only Nordic countries, Austria and the Netherlands reported rates above 50 %: Norway (80 %), Iceland (74 %), Sweden (63 %), Finland (58 %), Austria (55 %) and Netherlands (52 %). The lowest ABF rates at 6 months were reported in the UK and Mediterranean countries: Malta (38 %), UK (34 %), Portugal (34 %), Spain (29 %) and Greece (22 %).
Any breast-feeding disparities
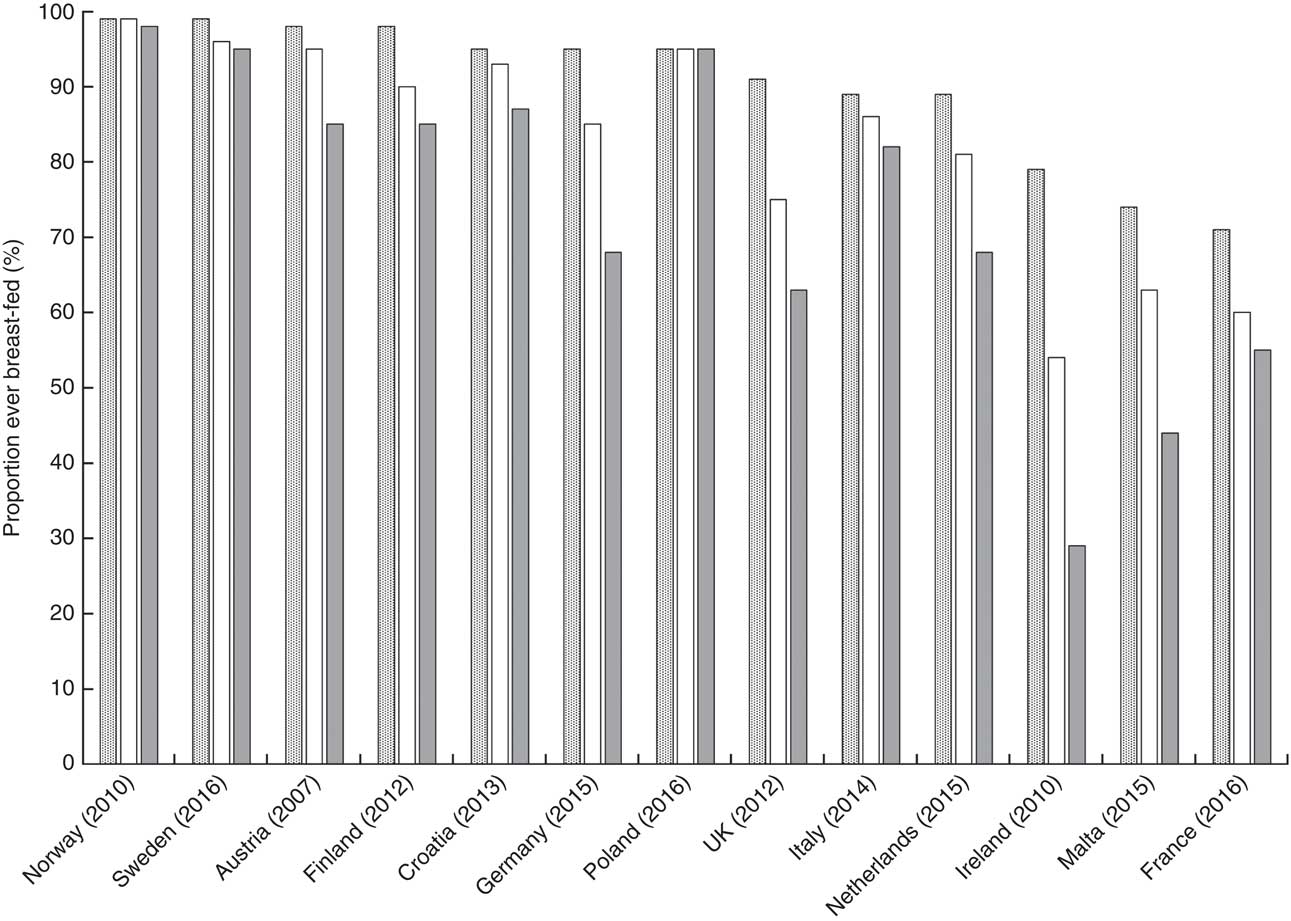
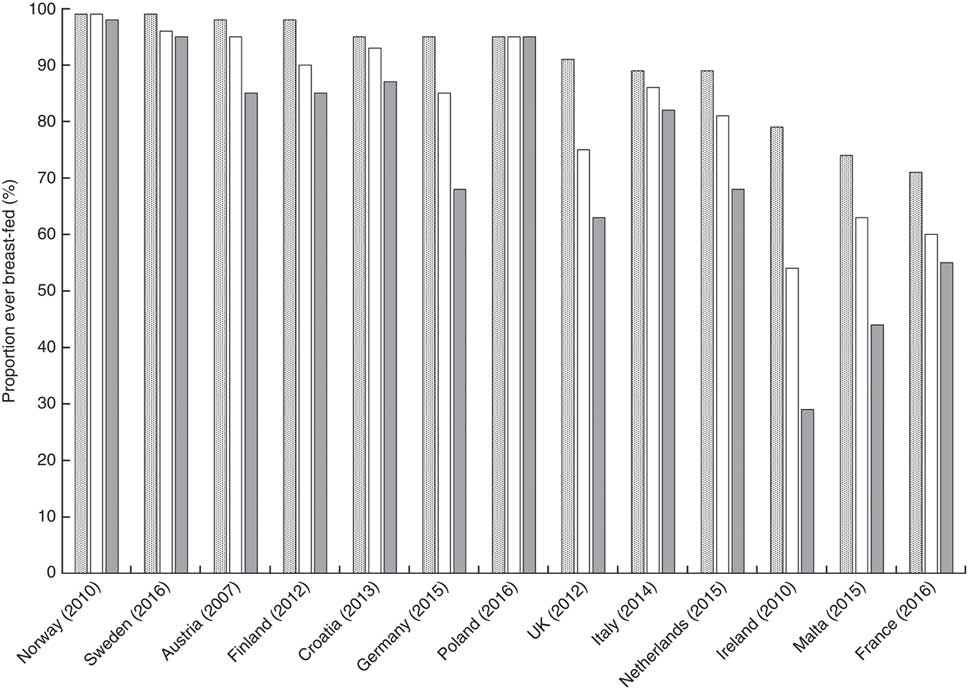
Fifteen countries reported rates of ABF disaggregated by education level but the data from Bulgaria and Luxembourg could not be compared with the others. Among the thirteen countries that were compared, there is a significant difference in ABF rates between mothers with high, medium and low education levels. The proportion of mothers with high education levels, practising ABF, is on average 20 % higher (P = 0·035) than those with low levels. Figure 1 illustrates a clear tendency towards a social gradient in breast-feeding rates between the mothers according to high, middle and low level of education. However, some countries have less steep social gradients as shown by the very small percentage inequality gaps in the Polish, Norwegian and Swedish mothers with high and low education levels (Fig. 2). In Poland, Norway and Sweden, more than 90 % of mothers are breast-feeding regardless of their level of education and so the inequality gaps are minor. Small disparities are observed in Italy and Croatia (<10 %), with relatively larger inequality gaps in Finland and Austria (<20 %) and in France, the Netherlands and Germany (<30 %). The largest inequality gaps are observed in the UK (31 %), Malta (41 %) and Ireland (63 %; Fig. 2). In five countries (Greece, Poland, Sweden, Luxembourg and Netherlands), where rates are reported at more than one time point during the first 6 months, there is a marked rapid cessation after initiation. The cessation gradient tends to be steeper in mothers with low level of education as they stop breast-feeding earlier (mean 71 (sd 17) %), compared with those having high education level (mean 62 (sd 17) %; P = 0·036). Similarly, at 6 months, the inequality gap in ABF of Swedish mothers increases to 38 % as more mothers with low education level stop breast-feeding earlier compared with those with higher education. Low levels of maternal education are not only associated with low rates of initiation but also with a higher probability of early cessation.
Any breast-feeding rate according to high (![]() ), middle (
), middle (![]() ) and low (
) and low (![]() ) maternal education levels in twelve EU countries plus Norway, 2006–2016
) maternal education levels in twelve EU countries plus Norway, 2006–2016
Inequality gap in any breast-feeding rate between maternal high compared with low education level in twelve EU countries plus Norway, 2006–2016. Inequality gap (%) = [(proportion of breast-feeding mothers with high level of education – proportion of breast-feeding mothers with low level of education)/proportion of breast-feeding mothers with high level of education] × 100
Exclusive breast-feeding at 6 and 4 months
Only six countries (Bulgaria, Germany, Ireland, Malta, Slovenia and Spain) did not report the average EBF rates at 6 months (Table 3 ( Reference Esberger 26 , Reference Dojčinović and Horvat 30 , Reference Johansen, Krogh and Pant 32 , Reference Uusitalo, Nyberg and Pelkonen 36 , Reference Vilain 38 – Reference Gaki, Papadopoulos and Jasmine 40 , 45 , Reference Desroches, Brochmann and Wagener 47 , Reference Peeters, Lanting and van Wouwe 52 , Reference Nanu, Moldovanu and Novak 53 , Reference McAndrew, Thompson and Fellows 56 – 64 , 66 – Reference Sandes, Nascimento and Figueira 68 , Reference Gottvall and Lundqvist 70 – 74 )). At 6 months, the highest average EBF rates were reported in Slovakia (49 %) and Hungary (44 %) and the lowest in the UK (1 %) and Greece (0·5 %; Table 3). The WHO recommendation to Member States used to be to collect national data on EBF rates at 4 months, but in the year 2000 this recommendation was increased to 6 months. However, many countries continue to collect data on EBF rates at 4 months (Table 3). The highest average rates of EBF at 4 months (≥50 %) were observed in six countries: Slovak Republic, Hungary and Denmark (64, 62 and 61 %, respectively) followed by Sweden, Latvia and Iceland (53, 53 and 50 %, respectively). The lowest average EBF rates at 4 months (<20 %) were in Cyprus, the UK and Greece (15, 12 and 8 %, respectively).
Exclusive breast-feeding disparities at 6 and 4 months
Only four countries, Latvia, Luxembourg, Poland and Romania, reported rates of EBF at 6 months by level of maternal education (Table 3). In Poland and Latvia, two to three times more mothers with high compared with low education level practised EBF at 6 months. In both Romania and Luxembourg there was little difference in EBF rates at 6 months between mothers with high compared with low education level (Table 3). Six countries reported EBF rates at 4 months by level of maternal education (Table 3): more Danish and German mothers with high compared with low education level practised EBF and the inequality gaps were 45 and 60 %, respectively. Similarly, a greater proportion of Dutch, French, Croatian and Luxembourg mothers with high compared with low education level practised EBF at 4 months and the respective inequality gaps were 23, 27, 34 and 44 % at 4 months.
Finally, Table 4 lists the wide range of different time frames used to define breast-feeding rates, for example: initiation of breast-feeding at birth; initiation of breast-feeding within the first hour; any breast-feeding; ever breast-feeding; breast-feeding at discharge from hospital; breast-feeding at 1 week; and breast-feeding at or less than 1, 2, 3 and 4 months. This wide range of non-standardized time frames makes comparison between countries impractical.
Different breast-feeding time frames used within the thirty European countries

ABF, any breast-feeding; EBF, exclusive breast-feeding.
* WHO recommendations changed from 4 months of EBF to 6 months of EBF in 2000.
Discussion
The current paper presents information comparing the rates of breast-feeding in Europe in mothers of different SES, defined by level of maternal education. The results confirm what other authors have stressed concerning the need for standardized methods to monitor breast-feeding rates in Europe to allow comparison between countries and recommendations to reduce inequalities( Reference Cattaneo, Burmaz and Arendt 75 , Reference Dyson, McCormick and Renfrew 76 ).
Any breast-feeding and disparities
The results confirm previous studies and provide new comparative evidence that disparities exist, not only within but also between countries( Reference Ibanez, Martin and Denantes 6 , Reference Bosi, Eriksen and Sobko 77 ). As indicated, based on surveys from thirteen countries, one-fifth more mothers with high compared with low education level breast-fed. Whereas the initial disparities in the Nordic, Baltic and Central European countries are relatively small, the inequality gaps found in Ireland, Malta, the UK, Germany, the Netherlands and France are high and should give cause for concern to the respective governments (Fig. 2). When breast-feeding rates are reported only as national averages, these average figures can conceal a steep gradient between mothers with high compared with low education level. For example McAndrew et al.( Reference McAndrew, Thompson and Fellows 56 ) found that the incidence of ABF was 91 % among UK mothers with high education level compared with 63 % among those with low education level. Similarly, five countries (Greece, Poland, Sweden, Luxembourg and Netherlands) reported rates over two or three time periods during which the trend is that the inequality gaps get wider. Even Nordic countries, for example Sweden, report that by 6 months the inequality gap increases considerably as more Swedish mothers with low education stop breast-feeding earlier than those with higher education. This is confirmed by Wallby and Hjern( Reference Wallby and Hjern 78 ), who found that low income levels are a strong predictor for early cessation of breast-feeding and recommended extra protection for low-income Swedish mothers. Similarly Finnish( Reference Erkkola, Salmenhaara and Nwaru 10 , Reference Hasunen and Ryynänen 79 , Reference Laanterä, Pölkki and Ekström 80 ) and Danish studies( Reference Busck-Rasmussen, Villadsen and Norsker 81 ) reported that mothers with low compared with high education were more likely to introduce foods too early. Indeed, even Norwegian authors recently reported that very few (7 %) Norwegian mothers with low education level still exclusively breast-fed by 5 months compared with three times more mothers (22 %) with high level( Reference Baerug, Laake and Loland 82 ).
Exclusive breast-feeding and disparities
The results confirm that on average the EBF rates in most countries, except the Slovak Republic (49 %) and Hungary (44 %), are well below governments’ 2025 target of at least 50 % EBF at 6 months( 1 ). Victora et al.( Reference Victora, Bahl and Barros 2 ) confirm that Nordic countries have high breast-feeding initiation rates of over 90 %. Similarly, Baltic countries and those in Central Europe report high initiation rates, with over 90 % in Bulgaria, Croatia, Czech Republic, Hungary, Poland, Slovak Republic and Slovenia. Even at 6 months about one-third of Baltic (Latvian, Lithuanian and Estonian) mothers are still practising EBF (Table 3). Results from smaller studies( Reference Levinienė, Tamulevičienė and Kudzytė 83 , Reference Vingras, Markūnienė and Vingraitė 84 ) report that, on average, about one-half of Lithuanian mothers exclusively breast-feed for 6 months, but only one-fifth with low compared with four-fifths of those with high level of education continue until 6 months. Slovakia and Hungary, along with the Baltic and Nordic countries, report the highest EBF rates (Table 3) and interestingly these countries provide the best statutory entitlement of paid parental leave, closely followed by Czech Republic and Bulgaria( 85 ). In contrast, French mothers can only expect 6 weeks off work before and 10 weeks after birth, and even those with high education level have one of the lowest breast-feeding initiation rates (71 %) in Europe (although dramatically increased since 1995)( Reference Bonet, Blondel and Khoshnood 86 , Reference Girard, Côté and de Lauzon-Guillain 87 ). Parental leave payment rates are also low in Ireland and the UK, where fully paid maternity leave lasts only 9 and 12 weeks, respectively( 85 ). Furthermore it appears that French, Irish and British mothers are subjected to aggressive marketing and many violations are reported against the International Code of Marketing of Breast Milk Substitutes (‘the Code’ hereafter) in France( 88 ), Ireland( 89 ) and the UK( 90 ). Robust policies, better maternity leave and protection against marketing are needed not only to achieve the global target of at least 50 % EBF in the first 6 months by 2025( 1 ) but also to achieve the EU Council’s aim( 91 ) to halt the rise in childhood obesity, which is closely associated to poor infant feeding practices. For example, parents have the right to receive information on infant feeding practices, from health professionals, that is independent of commercial interests and free from conflicts of interest. Low levels of breast-feeding have been attributed to lack of knowledge about breast-feeding and incorrect advice on infant feeding from health professionals in Lithuania( Reference Levinienė, Petrauskienė and Tamulevičienė 92 ), Malta( Reference Montalto, Borg and Buttigieg-Said 93 ) and Romania( Reference Nanu, Moldovanu and Stativă 94 ).
Implications for public health policy
A recent German study( Reference Logan, Zittel and Striebel 95 ) is among the first to demonstrate a widening socio-economic disparity in breast-feeding practices using a time-trend analysis. This disparity was largely explained by the proportion of German mothers with low SES who were likely to be obese and/or to smoke. Both these risk factors are well known to be associated with low breast-feeding rates( Reference Babendure, Reifsnider and Mendias 96 , Reference Goldade, Nichter and Nichter 97 ). Breast-feeding cessation among Dutch mothers with low education level also increases rapidly( Reference van Rossem, Vogel and Steegers 98 ) and so in the Netherlands there is increased focus on how to reduce health inequalities in pregnant women and their offspring( Reference Kooijman, Kruithof and van Duijn 99 ). Similar calls are being made in Italy, where authors stress the need for policies that specifically support mothers with low level of education( Reference Bertini, Perugi and Dani 100 , Reference Lauria, Spinelli and Grandolfo 101 ). In the future it is crucial to carry out regular monitoring of trends of breast-feeding rates along with the relative prevalence of obesity. The latest data (2015–2017) from the WHO Childhood Obesity Surveillance Initiative( 102 ) show that Southern European countries have the highest rate of child obesity. In Cyprus, Greece, Italy, Malta and Spain, approximately one in five boys is obese, whereas Nordic and Baltic countries are among the countries with the lowest rates. Obesity in young children is associated with low initiation rates of breast-feeding along with early cessation( Reference Yan, Liu and Zhu 103 , Reference Horta, Loret de Mola and Victora 104 ). This both negatively affects long-term health and increases the risk of obesity over the next generations( Reference Dolton and Xiao 105 ). However, data on both national breast-feeding rates and obesity prevalence, disaggregated by level of maternal education, are needed to better investigate the complex relationship between obesity, breast-feeding and SES. A recent review( Reference Baidal, Locks and Cheng 106 ) tried to separate independent outcomes but a clearer understanding of the several different mechanisms involved, and their interrelationships, is of utmost importance. The European Blueprint for Action on Breast-feeding( Reference Cattaneo, Burmaz and Arendt 75 ) especially recommends: full implementation of the Code and subsequent relevant World Health Assembly resolutions; maternity protection legislation that enables all working mothers to exclusively breast-feed their infants for 6 months; establishing standards for best practice within public places as well as in all maternity and childcare services; and harmonized collection, at least every 3–5 years, of disaggregated breast-feeding data that correspond to the recommended standardized indicators and definitions.
Limitations
As these comparisons are derived from data gathered using different methods over different time periods, reported rates and their comparison should be treated with caution( Reference Balogun, O’Sullivan and McFadden 107 ). Breast-feeding rates were collected on different dates over a long time period and a wide range of methods was used in different countries to collect breast-feeding rates (Table 4). It was attempted to harmonize education levels into three categories according to the ISCED( 108 ); however, our categorizations could be flawed. Furthermore, reported breast-feeding rates were not always nationally representative and so comparisons should be interpreted with caution. The inequality gap analyses are useful but limited in that they only reflect the difference between low level of maternal education compared with high. The analysis can be potentially affected by extreme values for each of these groups and does not necessarily reflect the experience of the entire population due to the different distribution of mothers’ education levels( 109 ).
Conclusion
Overall, there is less initiation of breast-feeding and shorter duration of EBF by mothers with low compared with high education level. These findings can help governments to investigate why these disparities exist and why some countries such as the Nordic, Baltic and Central European countries have higher breast-feeding rates and lower disparities compared with other European countries. National policies common to Nordic, Baltic and Central European countries are that they have paid maternity leave regulations which go beyond the minimum stipulated by EU law. In addition, Nordic countries have been efficient in minimizing violations of the Code and until recently Baltic and Central European countries have not been as exposed to high levels of marketing by companies selling breast milk substitutes. The results highlight disparities in breast-feeding which can only be reduced if governments develop harmonized monitoring systems that are carried out regularly and where the data are disaggregated by SES to develop appropriate health promotion policies.
Acknowledgements
Acknowledgements: The authors acknowledge the support of the Baby Friendly Hospital Initiative (BFHI) coordinators listed as follows by country. Austria: Dr Christina Wieczorek (Austrian Public Health Institute). Croatia: Anita Pavicic Bosnjak, MD, PhD (University Hospital Sveti Duh Zagreb). Czech Republic: Zuzana Derflerová Brázdová, DrSc (Department of Public Health, Faculty of Medicine, Masaryk University). Denmark: Annette Poulsen and Christine Brot. Estonia: Ada Vahtrik (BFHI Country Coordinator). France: Dr Claire Laurent (Coordinatrice médicale IHAB France), Dr Marie-Claude Marchand, Kristina Löfgren and Caroline Francois. Germany: Heike Bruland-Saal (Assistant Executive Director, Association for Support of the WHO/UNICEF BFHI). Ireland: Dr Genevieve Becker, PhD, IBCLC, MINDI (National Coordinator of the BFHI in Ireland). Latvia: Iveta Pudule (Senior Public Health Analyst, Department of Research and Health Statistics, Centre for Disease Prevention and Control). Lithuania: Daiva Šniukaitė-Adner, MSN, RN, IBCLC (BFHI National Coordinator, NBC Vice Chair). Luxembourg: Maryse Arendt (National Coordinator, Initiativ Liewensufank/UNICEF Lux). Netherlands: Mary Steen, IBCLC (Policy Maker, BFHI the Netherlands) and Caroline Kruger. Poland: Marzena Kostuch, MD, PhD. Slovenia: Mojca Gabrijelcic. UK: Anne Woods (Deputy Programme Director, Baby Friendly Initiative). Financial support: This work was carried out under a ‘Pilot project related to reducing health inequalities: building expertise and evaluation of actions’ (tender number SANTE/2014/C4/032; service contract number 2015-C4-03 (SI2.724119)), funded by the European Commission, DG Health and Food Safety, Unit C-4 Health Determinants and Inequalities. The European Commission, DG Health and Food Safety, Unit C-4 Health Determinants and Inequalities had no role in the design, analysis or writing of this article. The information and views set out in this publication are those of the authors and do not necessarily reflect the official opinion of the Commission. The Commission does not guarantee the accuracy of the data included in this publication. Neither the Commission nor any person acting on the Commission’s behalf may be held responsible for use which may be made of the information contained herein. Conflict of interest: None. Authorship: M.S. collected and analysed data, wrote the initial version of the manuscript and contributed to the final version. A.P. supported statistical analysis, contributed to the preparation of the manuscript and provided critical comments. A.R. supervised the data collection, its analysis and the writing of the manuscript, and was responsible for contacting experts on breast-feeding policy in the countries investigated. All authors reviewed and approved the manuscript. Ethics of human subject participation: Not applicable.


 Open access