

I. INTRODUCTION
There has been much hype about big data analytics – a collection of technologies, including the Hadoop distributed file system, NoSQL databases, and machine learning tools. One study estimated that it can generate hundreds of billions of dollars of value across industries [1]. Another study reported that 75% of telecom operators surveyed would implement big data initiatives by 2017 [2]. Every operator is seeking new ways to increase operational efficiency and marketing effectiveness by leveraging big data technologies. But the question is how does big data analytics differ from prior arts such as data warehousing and statistical methods, in terms of the capabilities of uncovering insights from large volume of datasets? What are the compelling use cases in telecom, and what are the challenges?
This paper provides a retrospect on how telecom operators have been striving, before the era of big data, to analyze large volumes of data in order to support their business and operation. We then examine the driving forces of big data analytics in the telecom domain and the benefits it offers. Finally we provide example use cases of big data analytics and the associated challenges, with the hope to inspire new research ideas that can eventually benefit the practice of the telecommunication industry.
II. TELECOM ANALYTICS
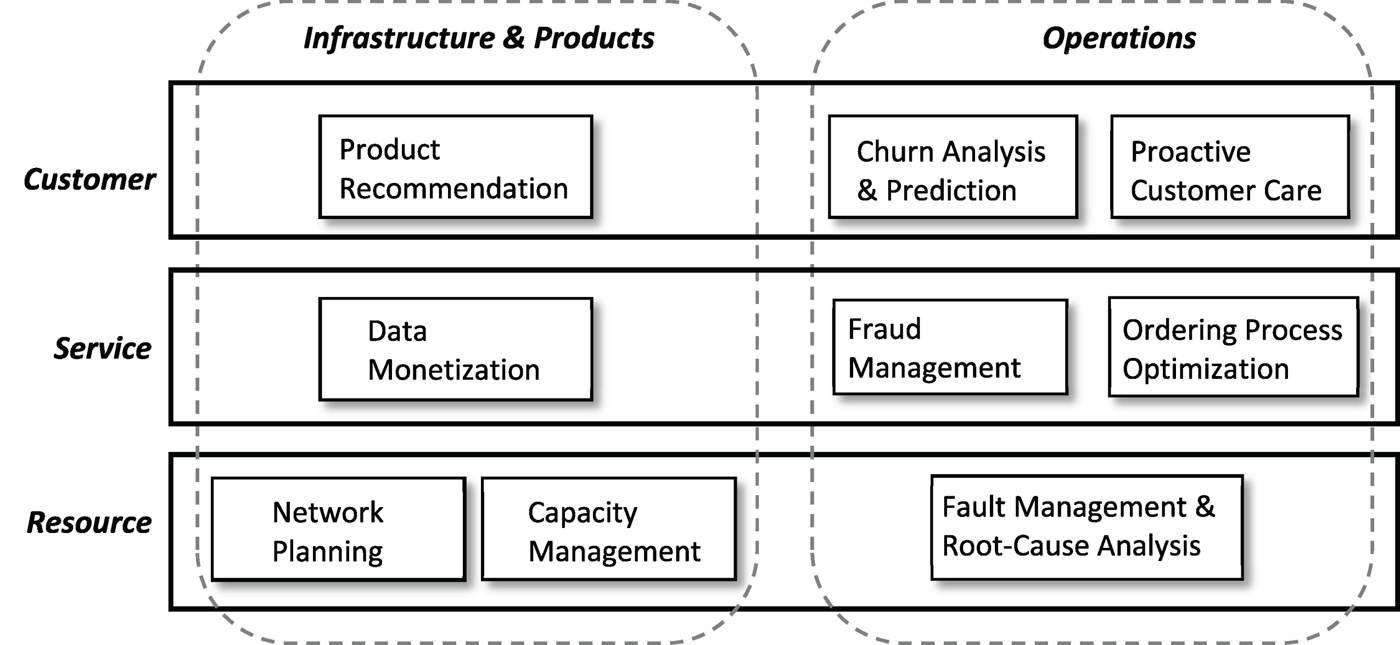
Nothing happens in a vacuum. Prior to big data analytics, technologies such as data warehousing, on-line analytical processing (OLAP), and data mining are adopted by telecom carriers to improve operation efficiency and user experience. To appreciate that, it helps to understand how a telecom network is managed. Figure 1 shows a simplified telecom management framework adopted from the TM Forum [3]. The framework contains three horizontal layers – resource, service, and customer, spanning across two vertical perspectives – infrastructure & product and operations. Examples of big data analytics use cases are shown in places according to their nature.

Fig. 1. Telecom big data analytics framework.
The resource layer includes activities related to network build-out, planning, and monitoring. Operators constantly monitor performance of the networks (including user devices and network devices such as routers, switches, base stations, etc.) in order to assure smooth operation. Data collected at this layer includes alarms generated by the network devices and key performance indicators (KPIs) such as packet loss ratio, latency, traffic load, etc. The datasets support use cases for network planning, capacity management, and fault management.
The service layer includes activities related to provisioning of user services (voice, data, and video). It also supports proactive monitoring and reactive diagnostics required by service-level agreements – a contractual agreement between the operator and the users on the performance and availability of the subscribed services. History logs from service provisioning can be used to improve the ordering process, shortening the time from ordering to revenue. Usage pattern data can be mined to detect frauds or monetized by selling to companies that are interested in reaching out to potential customers.
At the customer layer the main task is Customer Relationship Management (CRM), which handles user inquires, orders, trouble tickets, and assure user satisfaction. The operators may recommend products or services to the users based on, e.g., location, device, usage, or browsing history. Churn analysis predicts the probability that a user may terminate the service and provides insights on why the users are leaving. Proactive customer care resolves issues the users may experience before they even know it by constantly monitoring the users’ quality of experience (QoE).
III. A RETROSPECT – HOW TELECOM ANALYTICS WAS DONE BEFORE
Since the mid-1990s, research in data warehousing, OLAP and data mining are abundant in the telecom application domain. Commercial tools based on these technologies are also available for operators to better manage their networks and customers.
For example, in one study [Reference Grossglauser, Koudas, Park and Variot4] AT&T Research describes a data visualization and mining framework that automates the task of identifying root-causes from large numbers of network alarms (namely, warning or error messages about malfunctioning equipment). The challenge is that many of the alarms, though looked differently on the surface, may contain duplicate information referring to the same root-cause. Often, a malfunctioning equipment may cause an influx of alarms (sometimes in hundreds of thousands) to the network management system due to propagation effect on the network. Traditional rule-based approaches to identifying duplicate alarms are limited and a data mining approach is proposed in the paper. Specifically, it is suggested that by correlating equipment states in the alarms in a streaming manner will result in more accurate identification of duplication alarms.
Data mining techniques were also developed in [Reference Wu, Peng and Chen5] to discover sequential alarm patterns based on alarm data generated from a real-world GSM (Global System for Mobile Communications) cellular network. A sequential alarm pattern is a sequence of alarms with associated time intervals. In the paper, the authors proposed an efficient algorithm to count the occurrences of all sequential alarm patterns that appear frequently (based on a pre-defined minimum threshold) in the alarm stream. Similar to [Reference Grossglauser, Koudas, Park and Variot4], this work aims to extract actionable insights from the massive volume of alarm data that may otherwise overwhelm any operator.
In a sequence of work [Reference Chen, Cochinwala, Mcintosh and Pucci6,Reference Sullivan7] Bellcore (now Telcordia Technologies) has built SQL tools that support real-time aggregation and analysis of high-speed streaming data from network and sensor devices. This line of work enables agile monitoring and analysis of network traffic in order to support quick trouble ticket resolution, traffic re-engineering, as well as long-term network planning.
A series of two workshops [8] focusing on database applications in telecom included research work on applying data warehousing and mining techniques to network resource and customer management. The research addressed issues on how to cope with the extremely high volume and speed of telecom data, including Call Detail Records (CDR) and alarm data. The CDR contains per-call information such as calling number, called number, time of call, call duration, etc.; the alarm data includes warnings and errors generated by the network equipment. Example applications on CDR analyses include fraud detection, user identity verification, social network analysis, and “triplet” (device, user, phone number) tracking for regulatory compliance purposes.
At the customer management layer, commercial solutions are available for various types of analyses. Teradata [9] and SAS [Reference Lu10] are two major vendors that provide churn analysis solutions. Since acquiring new customers is multiple times more expensive than retaining a customer, operators are willing to pay for software that can help them identify customers with high revenue contributions but are likely to terminate the service. Traditionally, statistical methods such as decision tree are used to classify customers into buckets with varying levels of churning tendency (e.g., low, middle, and high) or probability.
IV. BIG DATA CHALLENGES IN TELECOM
So what makes big data analytics different from the data warehousing and data mining technologies that were well developed in the past two decades? Do not the problems faced by the operators today remain the same as before? While it is true that the use cases mentioned in Fig. 1 are still on the operators’ top list, the nature of the data they are dealing with today has changed in many aspects due to advances in the computing and communication technologies. We illustrate this viewpoint in the following in accordance with the three characteristics of big data: variety, volume, and velocity.
A) Variety
In the past most data mining applications in telecom are instrumented for a certain kind of data, e.g. fraud detection based on CDR or root-cause analysis based on alarm data. Even data warehouse projects that incorporate multiple information sources are mainly dealing with well-structured data from relational databases. Today, the proliferation of applications enabled by the Web, mobile networks, GPS, and social media has forever changed the horizon. The numerous data points created and made available by these applications have resulted in virtually a “data rainforest” with highly diverse sources of structured (tabular), semi-structured (objects, log records), unstructured (free text), and streaming data.
Telecom operators now have every means at their disposal, barring economic feasibility and regulatory restrictions, to mash up data from multiple sources to better understand their networks and customer behaviors. The information may include, e.g. what websites you visited, how much time you spent talking on the phone, watching video, and on OTT (over-the-top) apps such as Skye, WhatsApp, and Facebook. By pairing these usage data with the network KPIs the operators are able to gain more insights into users’ QoE on different services. This can be further combined with CRM data such as user complaint logs, or user posts on Web blogs or social media, to sketch how well a particular service is received by the users in different geographical or service areas.
The mash-up idea also applies to the network resource layer. A recent pilot study [Reference Qiu, Feng, Ge, Wang, Xu and Yates11] shows that service outages or degradation incidents can be detected by analyzing Tweets (with network topologies) before they are detected by the operator's call center (based on volume of complaint calls) or Operation Support Systems (OSS) that manage and monitor the operation of the network. This kind of mash-up analysis would not have been possible twenty years ago; today they offer operators a new angle to measure their operations and understand their customers.
B) Volume and velocity
Two decades ago a terabyte-scale data warehouse would have been considered humongous (Walmart's data warehouse reached 1 terabyte in 1992). Nowadays terabyte-scale datasets are omnipresent. Telecom data has grown exponentially since the age of broadband and 3G. This trend will continue as the networks evolve (optical, 4G/LTE, 5G), allowing users to access, contribute, and share ever increasing contents on the Internet [12]. The telecom industry is facing an unprecedented amount of data, fluxing in at a speed never seen before. Analysis of petabyte-scale and streaming data was challenging before, if not impossible, because the costs of the hardware and software needed to handle the data were prohibitive. Further, since the return of data analytics investment is sometimes hard to measure (e.g., customer royalty) or take a long time to materialize, large spending was usually discouraged.
Today, the trend of using open source and commodity hardware in big data platform has lessen the above concern to a certain degree. Many open sources have either a free community version or an enterprise version with moderate service/license fee. The Apache projects [13] are one of the most prominent examples. The shift from expensive shared-disk, SMP (symmetric multiprocessor) to share-nothing, commodity hardware-based architecture also lowers the ticket price to the big data game. Operators now finally have affordable tools in their hands to explore novel and hard analytics with big data.
From the perspectives of variety, volume, and velocity, telecom operators, like enterprises in all other verticals, face the following two major challenges:
-
• Needle in a haystack – how to uncover correlation and actionable insights from highly dimensional data space? The most challenging, and usually the most exciting, task in any data analytics project is to identify the correlations among the variables (or features) and uncover the relationship between the variables and the metric to be predicted (labels). Only when this is uncovered can one make meaningful business decisions. This task becomes even more challenging today because of the diverse sources of information that are available that may lead to hundreds or even thousands of variables.
-
• Data integration and quality – your results are only as good as your data quality. Contrary to what most people think, data integration and cleansing usually take up the biggest chunk of time in any data analytics project. The tasks may involve traditional extract, transform, and load (ETL) and data reconciliation. The latter refers to the task of resolving conflicts from multiple data sources, at schematic, modeling, and semantic levels. While tools that can help automate the ETL process are abundant, data reconciliation remains a highly laborious effort. It is generally believed that more than 70% of data scientists’ time is spent on “data munging” than on actually analyzing the data.
A good example is churn analysis. The churn rate is the percentage of subscribers that terminate the service with an operator. Average monthly churn rate can range from 1% to as high as 5% [14]. For large operators that can mean hundreds of millions of revenue loss. Since the introduction of number portability in the 2000s, subscribers are more likely than before to churn because the inconvenience of having to change to a new phone number no longer exists; and since the cost of acquiring a new subscriber is multiple times higher than retaining an existing subscriber, operators rely on churn analysis to identity and retain valuable customers that are most likely to leave.
Before the era of big data analytics, statistical methods such as decision trees have long been used to predict subscriber churn likelihood. Usually these methods look at subscriber demographic data such as age, occupation, gender, income and call activities from CDRs to build the predictive model. Statistical models are excellent at quantifying and correlating these attributes. They however fall short in causation analysis, i.e. they do not tell you what the causes of the churns are. Are people leaving because the quality of the network is bad (and is this because the connection is slow or coverage is spotty), the call center representatives are not helpful, or because a competitor is launching an aggressive campaign?
With the advancement and availability of big data technologies, operators are now able to collect more nearly complete data about a user's experience and behavior. They can then build a behavior-based churn prediction model to alert them when a subscriber is about to leave. For example, operators my find that a subscriber whose contract is about to expire and has searched on competitors’ Web sites, will have a high probability to call in to cancel the service [9]. As another example, finding a large quantity of “family plan” customers churning out during a certain short time period may lead to the discovery that a competitor is reaching out to a specific class of customers with aggressive plans. Text analytics can also be applied to CRM logs and/or social media to gauge customer sentiment and identify those that may leave.
V. USE CASES
We describe in more details two uses cases of big data analytics in telecom – QoE and SIM box detection. QoE is crucial because it is the basis for proactive customer care and can be used in causation analysis of churns. A SIM box is a machine that hosts multiple Subscriber Identification Module (SIM) cards each of which can be used to initiate a mobile call over the GSM network. SIM box detection helps operators to identify potential fraudulent, non-authorized commercial use of SIM cards that may cost operators large revenue losses. Both use cases are active research topics in telecom big data analytics that deserve more investigation. We elaborate the challenges in the following.
A) QoE
In telecom, QoE is a measure of customer satisfaction on the service(s) she experienced. QoE can be service specific (e.g., video QoE) or an overall measure across all services (e.g., video, voice and data altogether). QoE is usually measured on a scale of 1–10, though other objective metrics have also been proposed for service-specific QoE (e.g., call duration for VoIP [Reference Chen, Huang, Huang and Lei16], play ratio for videos [Reference Dobrian17]). Note that QoE is different from the traditional quality of service (QoS) metric which measures the quality of the network layer services (e.g., packet loss, routing latency, etc.). In QoE, it is customer experience that matters.
A recent survey on operators shows that proactive customer experience management is the single biggest opportunity for data analytics applications (voted by 38% of participants) [Reference Banerjee15]. Accurate measurement of customer QoE can help operators to predict customer churns and identify customers for service upgrade or target marketing. At the network resource layer, it helps to locate problematic areas in the networks and plan for reconfiguration or upgrade to improve the performance.
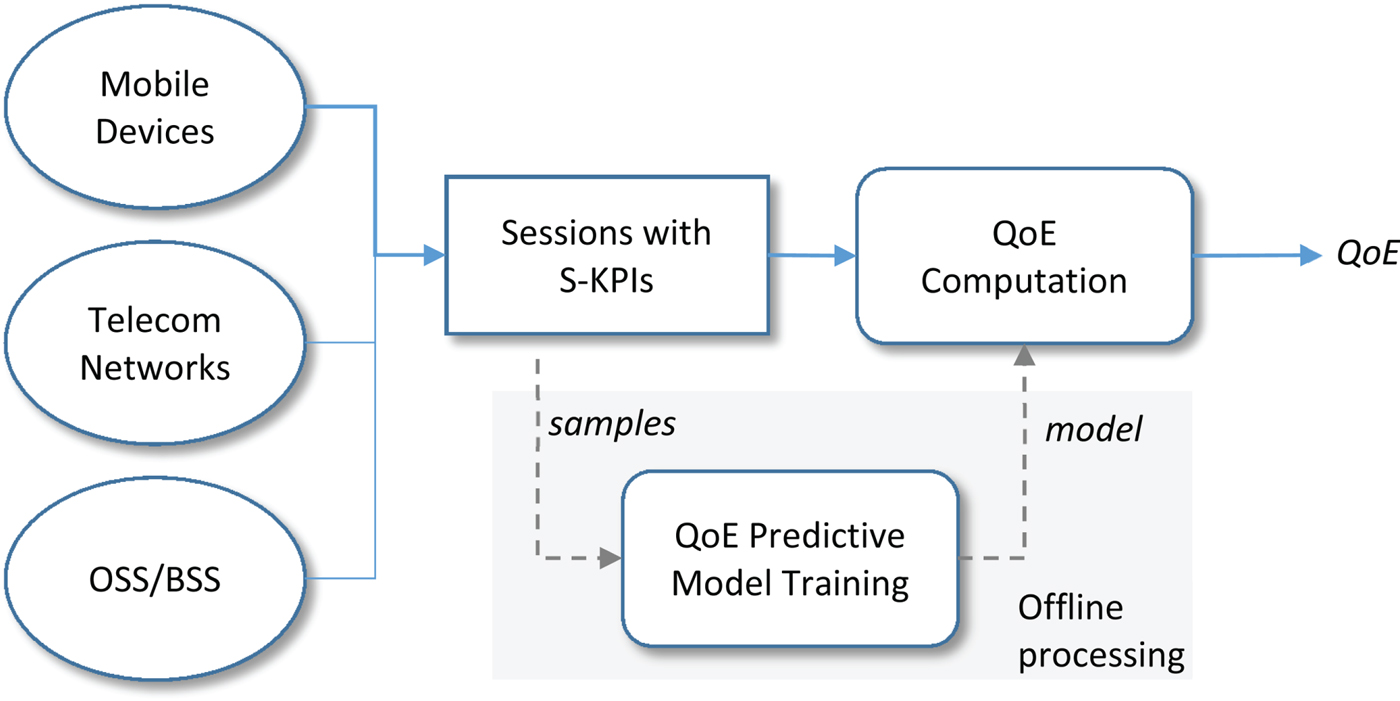
A common approach to building a QoE model [Reference Chen, Huang, Huang and Lei16–Reference Aggarwal, Halepovic, Pang, Venkataraman and Yan18] is to establish a quantitative relationship between a set of service KPIs and an objective metric (such as voice call duration or video play ratio) that can be intuitively interpreted as the QoE. The process is illustrated in Fig. 2. First, raw data are collected from difference sources including user devices, networks, and the OSS/BSS. The data may include, for example, user locations, click stream logs, app usage, network performance, subscriber plans, and demography, and call center logs. Each user session (e.g., video, voice, or Web sessions) is associated with a set of service KPIs (S-KPIs) calculated based on the raw network data. A sample set of sessions (with calculated S-KPIs and the objective OoE) are then used to train the predictive model. Once established, the model can be used to “predict” QoE based on S-KPIs in real time.

Fig. 2. QoE predictive model.
For example, Chen et al. [Reference Chen, Huang, Huang and Lei16] proposed a model based on Cox Regression to predict Skype user satisfaction based on factors including bitrate, packet rate, packet size, jitter, and round-trip time. They use call duration as an objective metric for user satisfaction and establish the relationship between the factors and the objective. Dobrian et al. [Reference Dobrian17] analyzed video on demand (VoD) logs and user engagement data (obtained from content delivery network providers) and built a regression tree model for video QoE. They use the play ratio (the fraction of the total length of the video that the user watched) as the objective QoE metric. They show that the regression tree gives the best prediction based on factors, including join time, bitrate, and re-buffering time and ratio. Aggarwal et al. [Reference Aggarwal, Halepovic, Pang, Venkataraman and Yan18] showed that QoE for VoIP and VoD (e.g., re-buffering ratio) can be estimated quite accurately solely based on generic network KPIs such as flow duration, TCP performance, HTTP performance, 2G/3G/4G network type and many others.
While these research provide a good understanding of QoE, challenges remain towards building accurate predictive models for QoE.
1. Challenge #1: How to use machine learning techniques to predict subjective QoE
The recent research on QoE [Reference Chen, Huang, Huang and Lei16–Reference Aggarwal, Halepovic, Pang, Venkataraman and Yan18] has one major shortcoming: the use of objective QoE may not align well with users’ subjective perception of the service quality they experienced. That is, seemingly good network performance metrics do not always translate into high user satisfaction. To remedy the problem, user feedback should be considered as part of the equation. There are studies [19–Reference Balachandran23] on using user surveys (collected either in real time after a session ends or by sending out a more comprehensive questionnaire) to identity factors that impact user satisfaction. Most of these work, however, adopted basic statistical methods and do not capitalize on the recent advances in data analytics. We envision that supervised machine learning algorithms are well suited to conquer this problem by including user feedback in the learning process. How the algorithms can be adapted to obtain more accurate QoE and better insights into customer satisfaction remains an interesting challenge.
2. Challenge #2: The relationship between the S-KPIs and the QoE is highly non-linear
It is very unlikely that any single mathematical function can describe this relationship with a satisfactory accuracy. So far, it seems that the non-linear, non-parametric regression trees, or random forests are the best models in terms of prediction accuracy [Reference Dobrian17,Reference Aggarwal, Halepovic, Pang, Venkataraman and Yan18]. However, these methods usually achieve such results by partitioning the factor/feature space into many small buckets, virtually approaching a brute-force approach at its extreme. This may result in over-fitting and may produce poor prediction for new data that find no similar patterns in the training set.
3. Challenge #3: How to stratify users into cohorts in the hope that a more accurate QoE model can be built per cohort than a one-size-fit-all model
It is well known that different customer segments will exhibit different behavior and perception on the services they received. For example, 4G users may expect better VoD experiences than a 3G user, corporate users may require better voice QoE than consumer users, or users in a big city may have higher expectation on overall QoE than users in suburban areas. Training and building a single QoE predictive model across the board may prove to be an effort in vain due to the diverse user groups. However, more accurate models can usually be achieved if we stratify the data and build a model for each user group. The challenge then is how to perform the stratification: at what boundaries (e.g., should we stratify on age and income or should address also be considered?) and at what granularities (e.g., how the age or income groups should be divided, should state or city be used?).
B) SIM box detection
SIM box is a scheme where the fraudsters abuse the fair use policy of the SIM cards issued by the telecom operators. As Fig. 3 shows, in this scheme the fraudster purchases multiple SIM cards from an operator in one country, say A, and installs them into a SIM box. A SIM box is a machine that can host multiple SIM cards. In addition, it has an interface to the Internet on one side and an interface to the wireless mobile network on the other side. The fraudster then sell international calling cards to end users in another country, say B. When the users in country B make a call to a mobile number in Country A, the call is converted to VoIP and routed through the Internet (IP network) to the SIM box. The SIM box, serving as a media gateway, then makes a GSM call to the called number through one of SIM cards and translates between the VoIP stream and the GSM call.
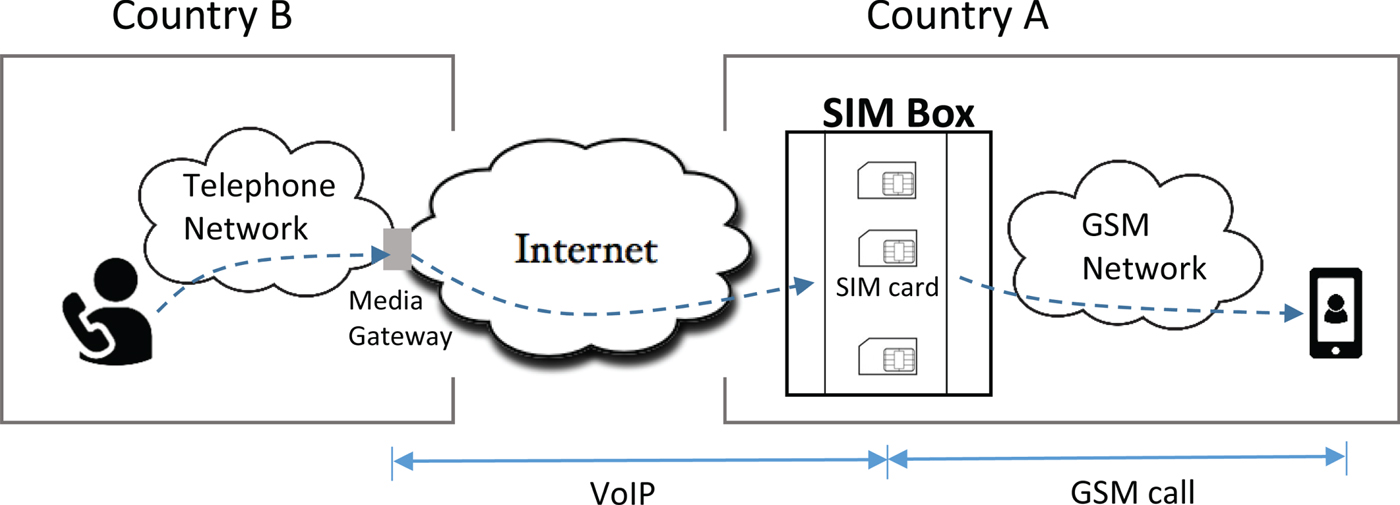
Fig. 3. SIM box fraud scenario.
In the above scenario, the terminating GSM carrier in country A that delivers the GSM call will not be able to recognize and charge this call as an international call, because to them the call looks just like any other local mobile calls that originate from a SIM card (unaware in this case it is from a SIM box instead of a mobile phone). With this scheme, the fraudster makes money by selling the calling cards while abusing the unlimited or high allowance of voice minutes that come with the subscription plans of the SIM cards.
SIM box is a great concern for operators because it results in revenue loss, network overload, and poor QoS [24]. Revenue loss represents the biggest incentive for operators to bust SIM box fraudsters. It is estimated that revenue loss due to SIM boxes is 3–6% of total revenue or US$58B globally [24,Reference Windsor25]. There are two approaches to detecting SIM boxes: proactive test calls and passive CDR analysis. Test calls involve the operator making a call to its own network from a foreign country using a suspicious calling card. The operator then checks the logs to see if the last leg of the call path is from a SIM card. If so then they can know for sure that this calling card is operated by a SIM card fraudster. However, in order to detect all possible fraudsters the operator needs to have a global coverage for the test calls, which usually is very expensive (though there are third-party companies that provide such a service). The passive CDR analysis; on the other hands, tries to detect fraudsters by examining the CDRs. Since the CDRs contain a full coverage of all calls that end at the operator's network, it provides a cheap alternative to the test call approach.
Detecting SIM boxes by analyzing CDRs is a good application for data analytics. While there are commercial tools that claim to use data analytics for SIM box detection [24], none of them reveal details on how this is done. One possible reason is business secret; the other and more probable reason is the software vendors do not want to let the fraudsters know the tactics. The situation is analogous to that of the anti-virus or anti-terrorism industries where the details of the artifacts are seldom revealed. Nonetheless, there are some common, intuitive rules that suggest a SIM box. For example, if a SIM card constantly makes large volumes of calls, makes calls to a large number of different destinations, or never moves out of a cell, then it is likely to be on a SIM box. Murynets et al. [Reference Murynets, Zabarankin, Jover and Panagia26] built a predictive model based on decision trees using more than 40 different features. They however do not report the final classification rules perhaps due to the same reasons mentioned above. Another work attacked the problem with neural networks [Reference Elmi, Ibrahim, Sallehuddin, Kim and Chung27].
Despite the existing work, there are still challenges in CDR analysis. The predictive model can only detect SIM cards that are highly susceptible for being a SIM box, but can never be 100% sure. The final verdict can only be reached through other means (such as test calls or field investigation) by the operators. Since the costs for these means are extremely high comparing to CDR analysis, it is crucial that CDR analysis produces results with low false positive (to save the investigation cost). Another challenge is that the fraudsters, once learning the tactics of the detection algorithm, will adapt in order to avoid showing up on the operator's radar screen. This will make low false positive even harder because the fraudsters will make every attempt to make their calling patterns indistinguishable from those of the legitimate callers. This means the detection algorithm needs to evolve too in order to catch up with the fraudsters, eventually making their cost of hiding defy the economic gain. How this can be done remains a challenge.
VI. CONCLUSIONS
Big data analytics offers telecom operators a real opportunity to capture a more comprehensive view of their operations and customers, and to further their innovation efforts [28]. One major driving force is the exponential growth of data generated from mobile and connected devices and social media contents. Important applications that can benefit from big data include quality of experience analysis, churn prediction, target marketing, and fraud detection. We have briefly discussed two use cases along with the challenges: prediction of quality of experience and detection of SIM box. We hope the discussions in this paper have shed some light and may inspire new research on how big data analytics can be applied to and benefit the telecom industry.
ACKNOWLEDGEMENTS
The author is grateful to the valuable comments from the reviewers and editors that have helped to improve the paper. The author is also indebted to iconectiv colleagues in engineering, product management, and legal departments for reviewing and discussions on the subjects related to the paper.
Chung-Min Chen is a Chief Data Scientist at Telcordia Technologies, d.b.a. iconectiv. He received his B.E. degree in Computer Science and Information Engineering from the National Taiwan University and a Ph.D. degree in Computer Science from the University of Maryland, College Park. During 1995–1998 he was an Assistant Professor at Florida International University. He joined Applied Research of Bellcore (now Telcordia) in 1998. He was an Adjunct Professor at National Taiwan University during 2007–2011 and has served as Chair of US ANSI Working Advisory Group to ISO TC-204 WG17 on ITS standards for nomadic devices. His research interests include sensor networks, mobile ad hoc networks, mobile data management, database systems, machine learning, and their applications in telecommunications. He has published more than 60 articles in various conferences and journals. His research has been funded by awards from the US government agencies, including NSF, ARO, NASA, and SEC.


 Open access