

Introduction
Unsorted or bimodal muddy sediments with a variable content of pebbles make up the main part of the Quaternary continental-shelf sediments in high-latitude areas (Reference EmeryEmery 1968). Similar sediments have also been recovered in ancient rock sequences. The primary glacial origin of these sediments is well documented; however, a detailed interpretation may fail, due to lack of adequate models of depositional processes (Reference Edwards and ReadingEdwards 1978). Recent progress in studies of models of glacial facies has been made on terrestrial deposits (e.g. Reference Boulton, Wright and MoseleyBoulton 1975). For the glaciomarine environment, the model of Reference Carey, Ahmad and RaaschCarey and Ahmad (1961), based on data from the Antarctic, is still mistakenly applied. The terms “wet-based” and “dry-based” ice shelves, with corresponding sedimentary facies, have been based on incorrect field data, and should not be used.
In the present paper, glaciological and oceanographic observations and sediment samples from the Weddell Sea are used to characterize sedimentation outside an ice shelf and show how it is influenced by sea-level rise and fall.
The physical environment
Ice-shelf flow
The Weddell Sea is surrounded by mostly 100 km-wide ice shelves on the eastern side, while the combined 500 km-wide Filchner and Ronne ice shelves confine the sea in the south (Fig.1). Figure 2 shows ice-shelf flow and mass balance for ice shelves such as those on the eastern side. The ice shelves exhibit internal temperatures well below freezing, increasing with depth to pressure-melting point (p.m.p.) at the ice/sea-water interface. No basis exists for making major thermal distinctions between ice shelves, such as use of terms "warm" and "cold". Erosion products from an ice sheet are primarily concentrated in a relatively thin basal zone some metres in thickness (Reference Gow, Epstein and SheehyGow and others 1979). A 10 m-thick basal sediment layer at the grounding line of the ice shelf in Figure 2 will melt out in a zone 60 to 70 km from the ice front. Thus these ice shelves are too wide to give rise to icebergs containing continental sediments. Basal melting may also take part nearer the grounding line. Currents flowing down-slope will have temperatures higher than at p.m.p. (Reference RobinRobin 1979); thus basal ice can be stripped of sediments especially where deeper ice, such as ice streams, enters the ice shelf.

Fig.1. Eastern Weddell Sea with the main current system and study areas referred to in the text.

Fig.2. Section of an ice shelf showing flow lines and mass balance. The ice flows radially from the ice rise, the crossing velocity vectors indicate the ice shelf flowing past the ice rise. Flow rates and ice thicknesses are generalized from observations at Riiser-Larsenisen during NARE 1976/77 and 1978/79. Based on data from other ice shelves, the basal melting rate is taken as 1 m a−1 at the ice front, decreasing linearly to 0 at 100 km from the barrier. A freezing rate increasing linearly to 0.1 m at the grounding line is assumed for the remaining section.
Currents in the weddell sea
The Weddell Sea opens to the north into the South Atlantic (Fig. 1). The current pattern is characterized by the westward-flowing Antarctic coastal current and a series of gyres in the central Weddell Sea. The water masses have a low vertical stability which suggests that the surface currents mirror the intermediate and bottom currents (Reference Foster and McWhinnieFoster 1978). On the western side of the Crary trough, a cold bottom current flows out beneath the Filchner Ice Shelf and continues across the shelf to the shelf break from where the current flows west¬ward along the slope (Foldvik 1980). Long-term current measurements made during 1968 and 1977–79 at eight moorings on the shelf break (Fig. 1) (Reference Foldvik and KvingeFoldvik and Kvinge 1974, Reference FoldvikFoldvik 1979, Foldvik, personal communication) showed that maximum velocities 25 m above the bottom were 0.4 m s−l. Usually the maximum ranged about 0.2 m s−l, with a mean velocity at about 0.09 m s−l. The flow pattern beneath the Filchner-Ronne ice shelves is not known, but the outflowing cold bottom water is believed to be related to the tidal influx from the Weddell Sea (Foldvik, personal communication). Iceberg drift tracks in the eastern Weddell Sea suggest that the velocities of the coastal current are not significantly greater than those measured on the shelf break. Measurements by Kvinge (personal communication) near Halley at 140 m water depth over 2 d showed maximum velocity of 0.3 m s−l and a mean at 0.15 m s−l. Wave-induced bottom currents are not important, because of the presence of sea ice which hinders wave generation for most of the year and because of the depth of the continental shelf (250 to 550 m).
Sedimentary environment
Data acquisition and laboratory procedures
The sedimentological data discussed in this paper were obtained during the Norwegian Antarctic Research Expedition (NARE) 1978/79 (Fig. 1). The programme consisted of taking gravity cores and grab samples at 30 sites, and water samples from 1, 10, and 100 m above the sea bottom at 12 sites, as well as underwater photographs, shallow seismic-reflection profiles, and side-scan sonar records. Supporting data from NARE 1976/77 are also included.
Complete particle size analyses of grades < 2 mm in size were carried out on the samples by standard procedures. X-ray analyses were made of all cores. Water samples were filtered on 142 mm 0.2 μm Nuclepore filters at 3 × 10⁵ Pa pressure on pre-weighed filters. The texture and chemical composition of the suspended matter were studied by means of an electron microscope with an energy dispersive unit.
Sediment distribution and sea-floor erosion
Usually a thin veneer (up to 1 m thick) of soft pebbly mud is underlain by similarly composed sediment; however, the latter unit is characterized by a high degree of compaction (Fig. 3). The overconsolidated sediments are confined to the shelf, and on the upper slope they continue into soft mud with a variable content of pebbles. A similar lithology for the Weddell Sea area was also found by Reference Anderson, Kurtz, Domack and Balshaw Anderson and others (1980).
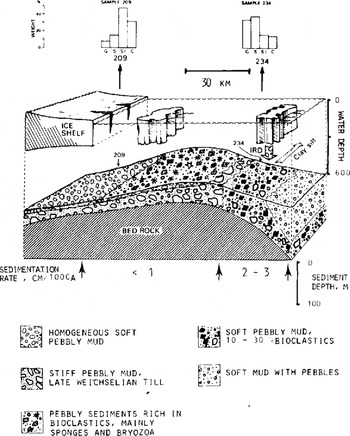
Fig.3. Sediment distribution and processes on the continental shelf outside Kapp Norvegia. Sediment thicknesses are based on shallow seismic records. The overconso1idated ti11 (shear strength 50–120 kN m−2) was formed during a period of low sea-level and grounded ice shelf. At this time sediments were frozen into the ice shelf and subsequently melted out to give the homogeneous soft mud. The two outermost units are both IRD facies with successively decreasing content of coarser materials seaward. The histogram shows grain-size distribution of two samples south-west of Kapp Norvegia. C: clay, SI: silt, S: sand, G: gravel (2–16 mm). Sample 209 is from a location that was underneath the ice shelf until <2 a previously.
The sea floor, especially on the outer shelf and upper slope, was apparently enriched with pebbles and gravels (Fig. 3 sample 234). The observed bottom currents cannot, however, erode the underlying clayey sediments extensively, but they can maintain suspended clay and siltmelted out from the icebergs, thus causing selective deposition of the coarser fractions.
A concentration of 0.1–1.0 mg ℓ–1of clay and fine-grained silt is common in bottom water as well as in intermediate parts of the water column, both in the coastal current and in the cold current on the shelf break. Similar values are also observed farther east along the Antarctic coast (Reference LisitzinLisitzin 1972). The suspended matter consists of quartz, feldspar, and illitic clay minerals with additional iron-rich aggregates, and is also rich in bioclastic silica, mainly diatom fragments, settled from the surface water. Magnesium-rich bioc1astic'carbonate detritus and sponge needles were not observed in the bottom-water samples. These components are frequent in the sea-floor sediments, and they should have been present in the suspended matter if there had been extensive erosion.
Reference Anderson, Kurtz, Domack and BalshawAnderson and others (1980) ascribe the presence of coarse-grained sea-floor sediments on the shelf to winnowing by bottom currents. However, it follows from the above that the sediment texture is instead mainly inherited from the primary englacial sediments.
Sedimentation rates and transport
Bryozoa fragments from three levels in a core on the upper slope (650 m water depth) south-east of Kapp Norvegia have been 14C-dated giving an average sedimentation rate of 0.027 m ka–1 (Fig. 4). The core site is outside the estimated position of the late Pleistocene grounding line and, because of the decreasing age upward in the core, the sedimentary sequence is believed to be intact. Bryozoa are found in the surface sediments at the core site, indicating in situ origin. In the core, the bioclas-tics account for 10 to 30%, implying a clastic sedimentation rate of 0.02 m ka–1. Similar rates have also been calculated for the glacio-marine deposits in the Ross Sea area (Reference FillonFi1lon 1977).

Fig.4. Characteristic lithological section of a core from the shelf break/upper slope outside Dronning Maud Land. X-ray analyses did not show any sign of lamination. Position: 72°19' S, 16°11' W, water depth 650 m.
The sedimentation rates from the upper continental slope may be higher than average for the continental shelf in the Weddell Sea. In the shallower regions (250 to 350 m), the sea floor is covered by sponges and bryozoa debris. This flourishing organic life suggests a low sedimentation rate. Low sedimentation rate on the shelf area is also supported by exposure of the overconsolidated pebbly mud of late Pleistocene age (discussed later) at 350 to 550 m water depth. A deposition rate of <0.01 m ka–1 is suggested for this area (Fig. 3).
Recognizable plough marks with varying sharpness in topography were observed by side-scan sonar on the shelf and at the shelf break at 400 to 600 m water depth (Fossum and Klepsvik, personal communication). This is below ice ploughing caused by present-day icebergs. The good preservation of the plough marks also confirms low sedimentation rates in this glacio-marine environment.
The lack of clastic sedimentation on the shelf areas is probably due to lack of sediment in the icebergs calving from the adjacent ice shelf (Fig. 2). Furthermore, the shallow water depths on the central shelf hinder entry of thick icebergs from other areas. Suspended sediment transport from the bordering ice shelf may occur in addition to the deposition of ice-rafted debris (IRD). Direct observations are not available, but information can be obtained indirectly from suspended matter in the current flowing out from beneath the Filchner Ice Shelf. Our sediment data for the cold bottom current are based only on samples on the shelf break, which is a considerable distance from the ice shelf. The observed sediment concentrations indicate weak currents with low sediment discharge beneath the ice shelf. This is confirmed by the observations of only a very thin cover of soft sediment above seismic high-velocity bedrock at 1 200 m depth in the centre of the Crary trough, immediately in front of the Fi1chner Ice Shelf, and without any evidence of erosion (Maisey, personal communication).
Sea-level changes and ice extent
Sea-level lowering, ice advance, and sedimentation
Overconsolidated pebbly mud (Fig. 3) was recovered on the shelf break outside Kapp Norvegia (3 samples) and on the shelf break in the central Weddell Sea (6 samples). We conclude that these are till deposits on the basis of geographic distribution, sediment texture and especially the degree of compaction (Fig. 3), these latter factors being similar to those of basal till deposits on the Norwegian continental shelf (Reference Rokoengen, Bugge, Dekko, Gunleiksrud, Lien and LiifaldliRokoengen and others 1978). Reference Anderson, Kurtz, Domack and Balshaw Anderson and others (1980) also suggest that these are till deposits. Presence of crushed shell fragments and sponge needles further show that the sediment has a primary marine origin.
One date is available from the overconsolidated sediment in the central Weddell Sea, located 400 km from the present ice front. Shell fragments from the lower part of a shallow core were 14C-dated to
![]() (not corrected for 14C-age of sea-water (Reference HarknessHarkness 1979) The overloading must be younger thanthe original marine sediments, thus indicating a major expansion of the combined Filchner-Ronne ice shelves less than 31 ka BP. We believe that the sea-level lowering of 100 to 130 m at the end of the late Pleistocene led the Filchner-Ronne ice shelves and western Dronning Maud ice to ground and expand to the shelf break.
(not corrected for 14C-age of sea-water (Reference HarknessHarkness 1979) The overloading must be younger thanthe original marine sediments, thus indicating a major expansion of the combined Filchner-Ronne ice shelves less than 31 ka BP. We believe that the sea-level lowering of 100 to 130 m at the end of the late Pleistocene led the Filchner-Ronne ice shelves and western Dronning Maud ice to ground and expand to the shelf break.
However, prior to this event the bioclas-tic content in the till shows marine conditions. Additional evidence for conditions similar to the present, e.g. a retracted ice shelf, is also found in the 14C-dated core (Fig. 4). During the period 30 to 40 ka BP, the. lithology is similar to the present surface sediments, i.e. depleted in the finer grades.
The sedimentary environment on the upper slope during the period of a lower sea-level and an expanded ice shelf is also shown by this core (Fig. 4). At 21 ka BP, corresponding to the probable time of an expanded and grounded ice shelf, an increase in muddy sediments and decrease in pebble content is noted. The increased content of the finer grades reflects sedimentation in a sub-ice-shelf environment, being different from the present open continental shelf and slope where the clay and silt are removed during settling (Fig. 3).
Sediment incorporation by a grounded ice shelf
Soft pebbly mud overlies overconsolidated late Pleistocene deposits on the shallower parts of the shelf outside Kapp Norvegia. X-ray analyses of cores show that the sediment is not laminated. This thin unit was limited on its seaward side to water depths < 300 m. A similar unit was found in the central Weddell Sea down to 400 to 500 m water depth(Reference MaiseyMaisey, unpublished, Reference Anderson, Kurtz, Domack and Balshaw Anderson and others 1980). This sediment cannot have been deposited by currents, because it is not found at greater depths, nor is it likely to be IRD which has been selectively deposited. Instead, we propose that these elevated parts of the sea bed were shoals on which ice shelves have been grounded in connection with a lower sea-level and/or thicker ice. The ice shelf/ice rise will freeze to the bed after grounding, and permafrost will form. This is discussed by OrheimFootnote * where it is shown that grounding for the order of 103 a will develop some tens of metres of permafrost. The frozen sediment will become part of the ice shelf when the sea-level rises, and the ice shelf may become partially afloat depending upon the amount of sediment, and its dimensions and flow. Melting of the frozen-in sediments would lead to the observed sequence of soft deposits overlying overconsolidated sediments.
Sedimentation near the grounding line
The position of the grounding line will be affected by (1) changes in sea-level, whether from iso- or eustatic effects, (2) thickening or thinning of the ice sheet, including long- and short-term deviations from steady state, and (3) changes in flow pattern. Advance or retreat of the grounding linewill cause a complex interbedding of sediments because most sediments are deposited near it. Our concept of the resulting sequence is shown in Figure 5. Recognition of such sequences should be important in the reconstruction of former ice margins.

Fig.5. A concept of the sediment distribution at the grounding line with outflowing melt water. Advance of the grounding line leads to glacial reworking of the melt-water deposits with mixing-in of basal till sediments.
Ird distribution: concluding remarks
IRD is a diagnostic element of glacio-marine sediments. As noted, the erosion products from the continental ice sheets are concentrated in a basal ice zone of a few metres thickness, and, because of basal melting under ice shelves, coasts free of ice shelves will represent the major source of IRD around Antarctica.
Data on iceberg drifts and melt rates (Reference TcherniaTchernia 1974, Reference Morgan, Budd and HusseinyMorgan and Budd 1978, Reference OrheimOrheim. 1980, Reference VinjeVinje 1980) and on ocean temperatures ln the Southern Ocean (Reference Gordon and GoldbergGordon and Goldberg 1970) have been used to construct Figure 6, showing probable iceberg paths and melt rates. From this, it appears that IRD deposits are confined to coastal areas, although deposits have been found beyond these limits (Reference TolstikovTolstikov 1976). Keeping the geography of Antarctica unchanged, it is difficult to envisage former water properties and circulation that would allow IRD from the basal layer to be deposited far north of the Antarctic Convergence. At some longitudes a 10 m basal layer would melt before the icebergs reached the Antarctic Convergence even if the temperature was lowered by 5° C. Nor is preservation of the basal sediment because of overturning likely, because an overturned iceberg will normally continue to roll. We therefore conclude that IRD at low latitudes and outside the main IRD zone (Fig.6) must originate from thicker basal layers, or from sediment in higher levels of the ice sheet eroded from nunataks. It follows that the IRD patterns will be more accidental, and outside the main IRD zone the deposition rate will become very low. Thus, models that relate an increase in IRD in cores to glacial expansion can be expected to fail. This has been recognized by several authors in recent years (Reference Keany, Ledbetter, Watkins and HuangKeany and others 1976). Following from the previous section, sea-level changes can clearly assist entrainment of sediments onto the base of an ice shelf. Subsequent calving may producedebris-rich icebergs which could contribute to IRD found at lower latitudes.

Fig.6. IRD distribution. Arrows show "probable" iceberg paths, based mostly on tracks of instrumented icebergs. Drift tracks in the sector from the Antarctic Peninsula to the western Ross Sea are constructed from mean surface currents (e.g. Reference TreshnikovTreshnikov 1964). Thin and thick numbered lines give approximate locations for melting of 5 and 10 m of basal ice of icebergs from corresponding locations. Solid line: Antarctic Convergence, hatched line: outer limitof IRD from sediments in the basal ice, dashed line: outer limit of IRD (Reference TolstikovTolstikov 1976).
Obviously the above cannot be applied directly to the northern hemisphere. Here the circulation is more meridional, and icebergs can drift farther towards the Equator before losing their basal load. However, high iceberg melt rates must have prevailed in warmer seas, and caution should be used in equating variations in glaciation with IRD sedimentation rates far from iceberg sources.
Acknowledgements
We thank colleagues on the Norwegian Antarctic Research Expeditions 1976/77 and 1978/78, and especially George H. Maisey, for their help in the field, Elen Roaldset and Svein Bäckström for help with sample analysis, and colleagues at Norsk Polarinstitutt for review of the manuscript.


