Diet is closely associated with growth in children( Reference Emmett and Jones 1 ) and an unfavourable dietary intake in childhood causes several non-communicable diseases( Reference Kaikkonen, Mikkila and Raitakari 2 ) in adulthood. Improving the quality of children’s diet is therefore a critical public health issue with lifelong benefits.
Many countries have implemented school lunch programmes, based on the idea that these can be an effective intervention for better dietary intake among children( Reference Stallings and West Suitor 3 , Reference Adamson, Spence and Reed 4 ). School lunches in Japan have a history of more than 100 years, with the first provided in 1889 at a private elementary school in Yamagata Prefecture( 5 ). This programme was recorded as relief work for children in poverty by Buddhists. The Ministry of Education began the financial subsidization of school lunches in 1932 and efforts to provide foods for as many children as possible were continued even in World War II. The nutritional status of schoolchildren just after the war was severely downgraded, and the nationwide school lunch programme was restarted in 1947 with relief supplies from the Licensed Agencies for Relief in Asia, UNICEF and others. Today, school lunches are provided in 99·2 % of elementary schools and 87·9 % of junior high schools in Japan (data from Gakkou Kyushoku Jissi Jyoukyou tou Chousa (Survey for the School Lunch Program) by the Ministry of Education, Culture, Sports, Science and Technology, 2014) based on the School Lunch Act. The mean monthly cost of school lunches in 2014 was approximately 4300 Japanese yen ($US 39·1; $US 1=110 JP¥) for children in public elementary schools and 4882 Japanese yen ($US 44·4) for those in public junior high schools. Low-income families can receive financial support for school lunches from the local or national government.
Under the Japanese programme, the same lunch menu is provided to all children of a school, including a staple food, main dish, side dish, drink and dessert (see online supplementary material, Supplemental Fig. 1), except for special cases such as children with food allergy. This fixed menu is a unique characteristic of Japanese school lunches, because the same menu, including ‘healthy’ foods such as vegetables or fruits, are mandatorily provided to all the children in the school and no choices (e.g. to choose only pizza and French fries at a cafeteria) are permitted. Children are taught not to leave any food on their plate and the percentage of waste food is 6·9 % on average (survey on food loss in school lunches, performed by the Ministry of the Environment, 2014). Since the nutrient content of school lunches is regulated by the Gakkou Kyushoku Jissi Kijyun (Standards for the School Lunch Program), the provision of school lunches has likely improved the overall nutrient intakes of Japanese children. However, this beneficial aspect of school lunches has not been evaluated in detail.
Here, to demonstrate the contribution of school lunches to healthier nutrient intake in Japanese children, we first evaluated the difference in nutrient intake on school days and non-school days in elementary-school and junior high-school children. To clarify the problem of overall nutrient intake in this generation, we then estimated the habitual nutrient intake. Finally, we also estimated the total adequacy of nutrient intake and its relationship with food intake.
Materials and methods
Study participants
Recruitment of study participants was supported by the Ministry of Education, Culture, Sports, Science and Technology, Japan, and the local boards of education at both the prefectural and municipal level. Twelve prefectures (Aomori, Yamagata, Ibaraki, Tochigi, Toyama, Shiga, Shimane, Ehime, Kochi, Fukuoka, Saga and Kagoshima) were chosen as study areas in consideration of geographical condition (e.g. north or south, rural or urban) and study feasibility. Schools with experienced nutrition teachers (dietitians) were selected for the study and these dietitians supported the dietary assessment. The unit of recruitment was the class, with a minimum of thirty students. From each area, ninety children (thirty children in each of third and fifth grade in elementary school and thirty children in second grade in junior high school) on average were recruited by teachers in the schools. When a class contained fewer than thirty students, an additional class (or school) was recruited. All children in classes selected for the survey received a written document to explain the survey and recording sheets for the diet record. Finally, a total of 1190 children (389 third graders and 392 fifth graders from fourteen elementary schools, and 409 second graders from thirteen junior high schools) were recruited.
Semi-weighed diet record
Study items in the present study were dietary assessment by diet record (DR) and measurement of height and weight at school. Each school set the period for the non-consecutive, three-day DR and conducted the measurement of height and weight within one month of that period. All records were collected by the study centre at the researcher’s university and checked by the researchers, who confirmed any unclear points with the participating children and/or their guardians through the schools. The dietitians or teachers who managed the survey at each school had a correspondence table which linked the children’s names and identification numbers for the survey, but the researchers did not have access to this information.
Guardians of the participating children were asked to complete a three-day, non-consecutive DR of their children’s dietary intake, of whom 915 complied (participation rate: 76·9 %). The three recording days for the DR consisted of two school days with a school lunch and one weekend day without a school lunch all within the same week (e.g. Tuesday, Thursday and Saturday within one week). Initially, each school set two survey days for the recording of school lunches in November or December 2014. Days without special events were chosen for the survey. These two days and one weekend day were also set as the survey days for dietary intake at home. The participants were able to choose either a Saturday or Sunday, again without special plans, as survey day according to their private schedule.
Dietary intake from the school lunch was recorded as follows. Before cooking, the dietitians at the school weighed all ingredients in all dishes for the participating children. They then measured the total weight of the cooked foods within each bulk cooking pot before serving. Using weights before and after cooking, the dietitians prepared conversion charts to estimate the weight of each ingredient consumed by a participating child from the weight of the cooked dish actually consumed by that child, with the weight of cooked foods consumed by each child measured in the classroom by a dietitian or the child under the dietitian’s support with a cooking scale. Beverages and processed foods provided without cooking were weighed in the same manner. Leftover food for each child was weighed after the lunch to estimate the net weight of consumed foods.
Dietary intake at home was recorded by the guardian who was the main preparer of meals for the participating child. All foods and beverages consumed out of school were recorded on the same two days set for the school lunch survey and also on the one weekend (non-school) day. The guardians were provided a manual for the DR and recording sheets. The school dietitians explained the recording methods to the guardians and supported them throughout the survey. The guardians weighed the ingredients in dishes, in the prepared dishes after cooking and in all drinks, whenever possible. If participants ate out and weighing was difficult, they recorded the restaurant’s name, name of dishes and whether any food was left uneaten. The main items recorded on the DR sheets were: (i) names of dishes; (ii) names of foods and any ingredients in dishes; (iii) approximate amount of foods consumed (amount measured by measuring spoon or measuring cup, or number of consumed foods (e.g. two strawberries)); (iv) measured weight of each ingredient, food and/or dish; and (v) whether the meal was consumed under usual conditions or at a special event. In addition, the guardians were asked to submit the packaging of processed foods or snacks with the recording sheet for estimation of ingredients.
The recording sheets for each survey day were handed directly to the school dietitian immediately after recording and then checked by the school dietitian as soon as possible. If missing or unclear information was recorded by a guardian, the research dietitian questioned the guardian directly. After this confirmation process, food item numbers( 6 ) were assigned to all recorded foods and beverages, and if necessary, consumed weight was estimated as precisely as possible utilizing the information recorded for the approximate amount of food, website of the restaurant or manufacturer, or nutrition facts on the food package. Recorded food items and weights were then reconfirmed by two research dietitians at the central office of the study. The weight of each food and ingredient included in the school lunch was estimated at the office based on the weight of consumed dishes and the conversion charts prepared by the school dietitians. The data for the lunch and the other meals were combined and the nutritional values were calculated. All calculations were performed with the statistical software package SAS version 9.4.
Other measurements
Body height and weight were measured to the nearest 0·1 cm and 0·1 kg, respectively, with the child wearing light clothing and no shoes. Measurement was done for the present study or as part of a routine health check-up by school nurses at each school. The prevalence of obesity in the children was evaluated by percentage of excess weight, which is defined using the formula: [(actual weight – standard weight)/standard weight]×100 (%). If percentage of excess weight was ≥20 %, the child was categorized as overweight, and if ≤−20 %, he/she was categorized as underweight. The standard weight was calculated using age- and sex-specific formulas which included actual height and coefficients( Reference Ikiuo (Sawamura), Hashimoto and Murata 7 ).
Statistical analysis
First, we determined energy and nutrient intakes on the first school survey day and the non-school day separately and then compared them using the Wilcoxon signed-rank test. We used values on the first school day for this comparison because intake on the non-school day was measured for a single day only; if we had instead averaged intakes for the two school days, the distribution of intakes would have been narrower than those of the single non-school day due to the reduction in day-to-day variation by the averaging (i.e. outliers of intake were smoothed by averaging and the percentage of inadequacy became lower), which would have in turn hampered comparison of the inadequacy of nutrient intakes, as described below.
To compare the dietary intakes reported in the DR with the corresponding Dietary Reference Intake (DRI) values( 8 ), we adjusted the reported nutrient intakes to the energy-adjusted intakes on the assumption that each participant consumed his/her estimated energy requirement (EER) rather than his/her reported energy. Self-administered dietary assessment, including DR, cannot avoid reporting errors, particularly under- or over-reporting( Reference Willett, Howe and Kushi 9 , Reference Murakami, Sasaki and Takahashi 10 ). This may induce bias when the reported nutrient intake levels are compared with corresponding DRI values, because the latter do not consider this problem: the DRI values are set for an individual of the reference height and weight shown in the DRI( 8 ). The calculation method is as follows: Energy-adjusted nutrient intake (amount/d)=[reported nutrient intake (amount/d)×EER (kcal/d)]/[observed energy intake (kcal/d)]. The EER for each child was calculated based on sex and age in days. Physical activity level was fixed to level II (moderate)( 8 ) in all participating children due to the absence of quantitative information about physical activity. For protein, fat and carbohydrate, %energy, i.e. the percentage of energy intake from protein, fat or carbohydrate to total energy intake, was used for comparison with DRI values. Inadequacy of nutrient intake was calculated by comparing the adjusted nutrient intake with each dietary reference value according to the Japanese DRI( 8 ). Of the total thirty-four nutrients presented in the DRI, five nutrients (biotin, Cr, Mo, Se, iodine) were excluded from analysis because of insufficient information about their contents in the food composition tables in Japan( 6 ). For nutrients with an Estimated Average Requirement (EAR), namely protein (g/d), vitamin A expressed as retinol activity equivalents, thiamin, riboflavin, niacin, vitamin B6, vitamin B12, folate, vitamin C, Ca, Mg, Fe (except for girls aged 13–14 years), Zn and Cu, energy-adjusted intake levels below the EAR were considered inadequate( 8 ). For Fe intake in girls aged 13–14 years, because the EAR cut-point method cannot be used due to the seriously skewed distribution of the requirement in menstruating girls, the probability approach was used instead( 11 – 13 ). Fe absorption rate was assumed to be 15 %( 8 ). In the Japanese DRI, a tentative dietary goal for preventing lifestyle-related diseases (DG) was given for protein (%energy), total fat, carbohydrate, dietary fibre, Na expressed as salt equivalent and K in children( 8 ). For these nutrients, energy-adjusted intake levels outside the range of the corresponding DG were considered inadequate. For nutrients with an Adequate Intake, the inadequacy of intake was not assessed.
Second, we estimated the distribution of habitual intake of energy and nutrients in this population by the best-power method using HabitDist, a software application developed to perform this method( Reference Dodd, Guenther and Freedman 14 – Reference Yokoyama 16 ). All three of the DR were used for this estimation. The inadequacy of nutrient intake was then calculated in the same manner as described above based on the estimated distribution of intakes.
Finally, the total adequacy of nutrient intake was categorized into four groups, which were used to describe food intake. Averages of the three-day intakes were used as the habitual nutrient intake of each child. The groups for nutrient intake adequacy were determined by combining the number of nutrients which met the EAR (maximum, 14) and the number which met the DG (maximum, 6), and named ‘Adequate’ (number of nutrients meeting the EAR is ≥12, number meeting the DG is ≥4), ‘Excess’ (≥12, ≤3; possibly a high-risk group for non-communicable diseases such as hypertension or CVD), ‘Deficient’ (≤11, ≥4; possibly a high-risk group for insufficiency/deficiency of vitamins and minerals) and ‘Inadequate’ (≤11, ≤3; possibly a high-risk group for both non-communicable diseases and insufficiency/deficiency). Definition of food groups is described elsewhere( Reference Asakura, Uechi and Masayasu 17 ). The vegetables group used in the present study included all types of vegetables. The ready-made foods group included retort-pouched beef curry, powdered corn cream soup, white fish for frying (frozen), Hamburg steak (frozen), hamburgers and fried chicken served at fast-food restaurants, etc. Food intake was represented by intake weight (grams) per energy intake of 4184 kJ (1000 kcal), and compared between the groups by the Kruskal–Wallis test and subsequent post hoc analysis (Dwass, Steel and Critchlow-Fligner method).
All analyses were performed with statistical software package SAS version 9.4. Statistical tests were two-sided and P values of <0·05 were considered statistically significant.
Results
Among the 915 children who completed the three-day DR, 910 were included in the analysis. None brought a lunch from home. Two children were eliminated because their average daily energy intake in the survey period was less than 0·5 times the EER for a child of their corresponding age with the lowest physical activity level (EER I( 8 )). Similarly, three children were eliminated because their daily energy intake on any day in the three survey days was less than 3138 kJ (750 kcal; 0·5 times the EER I for girls aged 8–9 years).
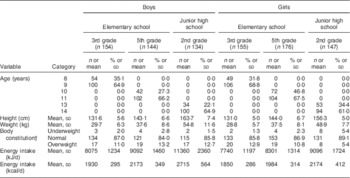
Participant characteristics are shown in Table 1. Each grade and sex stratum included approximately 150 children. About 10 % of children were overweight, but the percentage was low (5·4 %) in the girls in junior high schools.
Characteristics of schoolchildren (n 910) from fourteen elementary and thirteen junior high schools in twelve prefectures of Japan, 2014

Data are presented as n and % unless indicated otherwise.
† Body constitution was evaluated by percentage of excess weight, defined using the formula: [(actual weight – standard weight)/standard weight]×100 (%). If percentage of excess weight was ≥20 %, the child was categorized as overweight; if ≤−20 %, he/she was categorized as underweight.
The difference in nutrient intake and prevalence of inadequacy between the first school day and non-school day are described in Table 2. In all grade and sex strata, intake between the school and non-school days was significantly different for ≥60 % of nutrients. Since the intake data collected on one day were used for comparison, the estimated prevalence of inadequacy in Table 2 was relatively high for all nutrients. However, the difference between school and non-school days was still obvious, and all inadequacies were more prevalent on the non-school day, except for protein in grams and Cu among girls, for which prevalence was zero on both the school and non-school days.
Difference in nutrient intake and inadequacy between school and non-school days by grade and sex among schoolchildren (n 910) from fourteen elementary and thirteen junior high schools in twelve prefectures of Japan, 2014
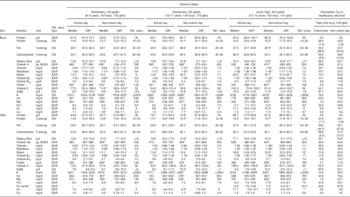
Ref. value, reference value; IQR, interquartile range; w/m, with menstruation; %energy, percentage of energy; RAE, retinol activity equivalents; EAR, Estimated Average Requirement; DG, tentative dietary goal for preventing lifestyle-related diseases; EER, estimated energy requirement.
Nutrient intake of each day was energy-adjusted based on the assumption that every participant consumed the same amount of energy as his/her EER. Nutrient intake on school days was the value observed on the first day of the three-day diet record.
*P < 0·05 (the comparison between intakes on school and non-school days was performed by the Wilcoxon signed-rank test).
† Prevalence of inadequacy shows the percentage of participants whose nutrient intake on the survey day did not meet the reference value. If a reference value is shown as a range, the percentage of participants whose intake was above the reference range is shown in parentheses. This estimation was performed by the EAR cut-point method.
‡ Retinol activity equivalent.
§ Sodium chloride equivalent.
|| Prevalence of inadequacy for Fe was estimated by the EAR cut-point method. In addition, the probability method was applied for estimation in girls aged 13–14 years using the EAR of Fe for girls with menstruation.
Table 3 shows habitual energy and nutrient intake and the prevalence of inadequacy for the nutrients with an EAR or DG. A high prevalence (more than 30 %) of inadequacy was observed for fat, total dietary fibre and salt in most grade and sex strata. Inadequacy of Ca and Fe intake was high in girls in the third grade of elementary school and in all children in junior high school. The relationship between the total adequacy of nutrient intake and food intake is summarized in Table 4. Of the seventeen food groups assessed, thirteen food intakes in boys and twelve in girls differed significantly among the four nutrient adequacy groups. In the ‘Adequate’ group, intakes of pulses, vegetables, fruits, mushrooms and seaweeds were higher than in the other groups. The ‘Excess’ group was characterized by high intakes of fish, meat, eggs and dairy products. The ‘Deficient’ group had the fewest children, and their intake of well-milled rice was highest among the four groups. Characteristics of the ‘Inadequate’ group were opposite to those of the ‘Adequate’ group; this group had the lowest intakes of pulses, vegetables and fruits and the highest intake of ready-made foods, and boys in this group had the highest intake of soft drinks.
Habitual energy intake and habitual nutrient intake with energy adjustment by grade and sex among schoolchildren (n 910) from fourteen elementary and thirteen junior high schools in twelve prefectures of Japan, 2014
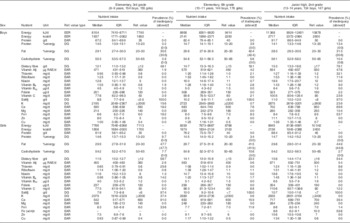
Ref. value, reference value; IQR, interquartile range; w/m, with menstruation; %energy, percentage of energy; RAE, retinol activity equivalents; EER, estimated energy requirement; EAR, Estimated Average Requirement; DG, tentative dietary goal for preventing lifestyle-related diseases.
Habitual intake was calculated by the best-power method using a three-day diet record. Nutrient intake of each day was energy-adjusted based on the assumption that every participant consumed the same amount of energy as his/her EER.
† Prevalence of inadequacy shows the percentage of participants whose habitual intake did not meet the reference value. If a reference value is shown as a range, the percentage of participants whose habitual intake was above the range is shown in parentheses. This estimation was performed by the EAR cut-point method.
‡ Retinol activity equivalent.
§ Sodium chloride equivalent.
|| Prevalence of inadequacy for Fe was estimated by the EAR cut-point method. In addition, the probability method was applied for the estimation in girls aged 13–14 years using the EAR of Fe for girls with menstruation.
Relationship between adequacy of nutrient intake and food intake among schoolchildren (n 910) from fourteen elementary and thirteen junior high schools in twelve prefectures of Japan, 2014
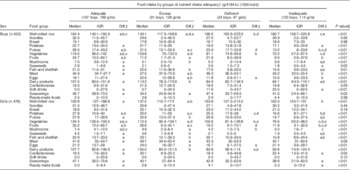
IQR, interquartile range; diff, significance of between-group difference; DRI, Dietary Reference Intake.
† Groups of nutrient intake adequacy were defined by the number of nutrients that met the reference value in the Japanese DRI( 8 ).
Estimated Average Requirement (EAR) is set for fourteen nutrients, and tentative dietary goal for preventing lifestyle-related diseases (DG) is set for six nutrients in the DRI values.
Adequate: number of nutrients which met EAR in the DRI is ≥12, and those which met DG is ≥4.
Excessive: number of nutrients which met EAR in the DRI is ≥12, and those which met DG is ≤3.
Deficient: number of nutrients which met EAR in the DRI is ≤11, and those which met DG is ≥4.
Inadequate: number of nutrients which met EAR in the DRI is ≤11, and those which met DG is ≤3.
‡ The corresponding letters show that there were statistically significant differences in food intake between two groups of nutrient intake adequacy. This comparison for each group was performed as a post hoc analysis (Dwass, Steel and Critchlow-Fligner method) of the Kruskal–Wallis tests.
§ The P value shows the result of Kruskal–Wallis tests to compare food intakes between groups of nutrient intake adequacy.
Discussion
In this comparison of nutrient intake on school and non-school days in Japanese schoolchildren, we found that the prevalence of inadequate nutrient intake was clearly higher on the non-school day for almost all nutrients. These findings suggest that the school lunch programme in Japan is an effective and powerful intervention in improving nutrient intake in Japanese children. The present study is the first to compare nutrient intakes between school and non-school days in Japan.
The contribution of school lunch programmes has been assessed in other countries. For example, the school lunch standard has gradually been improved in the UK( Reference Adamson, Spence and Reed 4 ). Stevens et al. showed that while school lunches generally had a healthier nutrient profile than packed lunches( Reference Stevens, Nicholas and Wood 18 ), they nevertheless did not provide the balance of nutrients required to meet nutrient-based standards. Since they collected data for lunch only, it was not possible to compare diet quality between school and non-school days within individuals. Evans et al. reported that children taking a packed lunch to school consumed a lower-quality diet over the whole day than children having a school meal( Reference Evans, Mandl and Christian 19 ). Spence et al. also reported that the implementation of school food policy standards in the UK was associated with a significant improvement in the diet of children aged 4–7 years( Reference Spence, Delve and Stamp 20 ), but not in children aged 11–12 years( Reference Spence, Delve and Stamp 21 ). These authors suggested that school lunches might also be useful in preventing inequity in children’s dietary intake due to the socio-economic status of their family( Reference Spence, Matthews and White 22 ). This effect is also expected in the USA( Reference Huang and Barnidge 23 , Reference Longacre, Drake and Titus 24 ).
In the USA, the National School Lunch Program (NSLP) was authorized as a permanent programme in 1946( Reference Hirschman and Chriqui 25 ). School food policy in the USA has improved over the past several decades( Reference Hirschman and Chriqui 25 ) and its effectiveness has been examined. Based on data collected in 2010, Smith and Cunningham-Sabo showed that relatively few students met the NSLP lunch standards, due to the relatively low intake of vegetables at lunch( Reference Smith and Cunningham-Sabo 26 ). The Healthy Hunger-Free Kids Act, the most recent nutrition standards for the NSLP and the School Breakfast Program, took effect at the beginning of the 2012/13 school year. Johnson et al. reported that the nutritional quality of foods chosen by students improved significantly following enforcement of the Act( Reference Johnson, Podrabsky and Rocha 27 ), but did not weigh the foods consumed by each child and did not evaluate the quality of total dietary intake, including breakfast and dinner. Cullen et al. showed that intake of fruit, 100 % fruit juice, vegetables and whole grains among elementary-school pupils increased after the new act, but at the same time expressed concern over the low absolute consumption of fruit and vegetables even under the new act( Reference Cullen, Chen and Dave 28 ). Given the recent change in school lunch standards and relatively low proportion of children taking school lunches in the UK and USA( Reference Adamson, Spence and Reed 4 , Reference Hirschman and Chriqui 25 ), the effect of current school lunches in these countries requires further evaluation. If the proportion of children who take school lunches is low, a beneficial effect of school lunches on total nutrient intake cannot impact schoolchildren even if the standards for school lunches are appropriately established. Increasing the uptake rate of school lunches requires improvements in school meal quality and financial support (if necessary).
A few studies have examined the effectiveness of school lunch programmes in other countries. For example, Dubuisson et al. reported both beneficial and deleterious effects of the school lunch in France( Reference Dubuisson, Lioret and Dufour 29 ). Free school lunches are provided to every child in the compulsory school system in Sweden and improvement of the school meal quality was reported after the introduction of new legislation( Reference Patterson and Elinder 30 ). Other groups reported that the association between family environment and dietary intake was stronger in countries without free school lunches (Germany and the Netherlands) than in those with them (Sweden and Finland)( Reference Ray, Roos and Brug 31 ). These results suggest that school lunches may affect overall diet quality in children.
A unique characteristic of the Japanese school lunch is its fixed menu. Children do not have any choice; the same menu is provided to all students in a school and is usually eaten in the home classroom. The Gakkou Kyushoku-hou (Law for School Lunches) stipulates that school lunches are an integral component of the education programme, and not simply an interval between classes or relaxation or break time. While allowing for cultural differences between countries, improving children’s diet quality using school lunches may require a certain degree of restriction. In England, Day et al. summarized staff and pupil perceptions of school meal provision( Reference Day, Sahota and Christian 32 ) and found that while some children stated that healthier options in the school lunch were preferable, too much freedom over the selection of foods was potentially detrimental. If school lunch menus do offer choices, these should aim to eliminate less healthful choices and be offered with appropriate instructions about how to select healthy foods. Another distinctive feature of the Japanese school lunch is the low percentage of waste food (e.g. 6·9 % in 2014). This ensures the sufficiency of nutrient intake from school lunches. School dietitians provide a monthly menu for a school and children enjoy various dishes over the one-month period. Also, since all children in a classroom take the same menu, the children may feel pressure to eat everything on their plate like their friends.
Regarding habitual nutrient intake, the inadequacy of most vitamins and minerals was quite low, except for Na. The contribution of school lunches to improving the intake of these items was considered to be sufficient. However, higher fat and salt intakes and lower dietary fibre intake than those provided in the DRI were apparent in both boys and girls in all age groups. Although nutrient levels in school lunches are already regulated by the Standards for the School Lunch Program, achieving the recommended values requires more diligent compliance. Indeed, compliance policies may require revision. Intakes of Ca and Fe were not sufficient in girls in the youngest (8–9 years) group or in children in junior high school. Intakes of these minerals in junior high-school students might not have increased to meet the increased requirements of the growth spurt at this age. On the other hand, it is possible that the reference values are not appropriate for children in certain age groups. For example, the EAR for Ca in girls aged 8–9 years is higher than that for boys of the same age. Because intake data for children are generally lacking, reference values in children are usually established by extrapolating the values for adults. The suitability of reference values for each sex and each age group warrants reassessment using more appropriate dietary assessment data. Further studies to describe dietary intake in children are necessary to improve the DRI in Japan.
Food intake differed significantly by the total adequacy of nutrient intake. Children in the ‘Adequate’ group consumed more plant foods than others, except for cereals. Abundant intake of these foods led to adequate intakes of vitamins and minerals. The ‘Excess’ group was characterized by higher intake of animal foods and lower intake of well-milled rice. This group contained three times more children than the ‘Deficient’ group, implying that inadequate intake of nutrients such as fat or salt, which are associated with CVD( Reference Kaikkonen, Mikkila and Raitakari 2 ), is more problematic than nutrient deficiency in Japanese schoolchildren. Characteristics of the ‘Deficient’ group were less clear. The word ‘deficient’ here means that a number of intakes of nutrients with an EAR (i.e. nutrients which can cause deficiency) were inappropriate, whereas intakes of nutrients with a DG (i.e. nutrients which can cause non-communicable diseases such as CVD) were relatively appropriate. The ‘Deficient’ group had higher intakes of well-milled rice and seasonings and lower intakes of eggs and dairy products. Children in this group might have had higher consumption of staple foods (mostly well-milled rice) and lower consumption of main and side dishes than others. The balance between the amount of staple foods and main dishes may be important to maintaining appropriate macronutrient balance. Children in the ‘Inadequate’ group consumed less plant foods except for cereals and relatively less animal foods, but more ready-made foods, soft drinks and confectioneries. Their intake of well-milled rice was second highest among the four groups. These results conclusively demonstrate that increased intakes of fruits and vegetables will improve the nutrient intakes of schoolchildren, and that school lunches should be diligently planned to include them. In contrast, main dishes, which chiefly include meats, fish or eggs, should be selected with care even in school lunches. In addition, the intakes of these animal foods among children in the ‘Inadequate’ group were low, but only a small number of nutrients met the DG. Cooking methods that do not use much oil/fat and a reduced use of seasonings are recommended. The intakes of fat and salt should also be decreased by avoiding the intake of confectioneries. Regarding dietary fibre intake, higher intakes of not only vegetables and fruits but also unrefined cereals can be recommended. The mean daily intake of brown or half-milled rice in this study population was less than 10 g (data not shown). Some schools participating in the study provided rice cooked with barley for lunch; this is also an effective means of increasing dietary fibre intake in children.
The present study was a school-based, nationwide study and the participation rate was relatively high (76·9 %). We therefore consider that the generalizability of the results is sufficient. Additional strengths of the study were its quantitative assessment of dietary intake on both school and non-school days, and use of a three-day DR, which allowed us to estimate the habitual intake of each nutrient in the analysed population. Further, all children in the present study routinely had school lunches irrespective of their nutrient intake or socio-economic status. Since reverse causality (e.g. children in low socio-economic status tend to have school lunches) was very unlikely, it was possible to directly observe the contribution of school lunches to overall nutrient intake in the children.
At the same time, several limitations of the study warrant mention. First, since most analyses were performed with stratification by sex and age, the number of children in each stratum was approximately 150. Although this might appear small for the estimation of average intakes and exact distributions, results across strata regarding the adequacy of nutrient intake were similar and could be interpreted. Second, as schools with experienced nutrition teachers (dietitians) were selected for the survey, the beneficial aspect of school lunches may have been emphasized due to better menus and less leftovers. However, as described before, the nutrient content of school lunches is regulated by the national standards and the percentage of waste food is 6·9 % on average, even in the national survey. Third, a three-day DR might be too short to allow habitual intake to be estimated with precision. In addition, to ensure that our comparison of the prevalence of nutrient intake inadequacy between school and non-school days was valid, prevalence had to be calculated using only one of the two school-day DR, to prevent the confounding that would have been introduced by averaging over the two days, as noted above. However, the difference in prevalence between the school and non-school days was obvious, and the results were clear. Since dietary assessment by DR places a heavy burden on participants, a period longer than 3d was not considered feasible. Finally, the DR at home was performed by the guardians of the participating children. Since this was the first experience with a DR for most, the accuracy of the record might be less than would be obtained by a trained dietitian. To ensure the quality of the DR, the guardians were provided with a detailed survey manual and were supported by their school dietitian.
Conclusion
In conclusion, the present study found that school lunches in Japan appear to improve nutrient intakes in Japanese schoolchildren. The improvement in intake for most vitamins and minerals provided by the school lunch may be sufficient for schoolchildren to overcome deficiencies in the diet received at home, when this is inadequate. On the other hand, the excess intakes of fat and salt and insufficient intake of dietary fibre were major problems in this population. The contribution of the school lunch to improving the intakes of these three nutrients was considered insufficient.
Acknowledgements
Acknowledgements: The authors thank the dietitians, school nurses and teachers who supported this research in each school, and the staff of the municipal government in each study area for their valuable contribution. Financial support: This work was financially supported by a Health and Labour Sciences Research Grant (number H26-Jyunkankitou (seisaku)-shitei-001) from the Ministry of Health, Labour and Welfare, Japan. The Ministry of Health, Labour and Welfare had no role in the design, analysis or writing of this article. Conflict of interest: None. Authorship: Author contributions are follows: S.S designed and directed the study. K.A. supported field establishment and recruitment for the study. S.S. and K.A. supported the collection of dietary data. K.A. arranged the data collected from each school. K.A. performed the statistical analyses and drafted the paper. Both authors contributed to the development of the submitted manuscript. Ethics of human subject participation: This study was conducted in accordance with the guidelines laid down in the Declaration of Helsinki and all procedures involving human subjects were approved by the Ethics Committee of the University of Tokyo, Faculty of Medicine (approval number 10653, approval date 3 October 2014). Participants (children) and their guardians were informed about the study verbally and by a written document before answering the questionnaire, and responding to the questionnaire was regarded as consent for study participation. Since no personally identifiable information such as name or mailing address was collected, all collected data were anonymous.
Supplementary material
To view supplementary material for this article, please visit http://dx.doi.org/10.1017/S1368980017000374