

Introduction
The electrical properties of glacier ice have been investigated over many orders of magnitude in frequency to help interpret its physical chemistry (e.g. Reference Wolff, Miners, Moore and ParenWolff and others, 1997; Reference Stillman, MacGregor and GrimmStillman and others, 2013a), density and fabric (e.g. Reference Fujita, Matsuoka, Ishida, Matsuoka, Mae and HondohFujita and others, 2000), the nature of polar ice sheets (e.g. Reference Dowdeswell and EvansDowdeswell and Evans, 2004; Reference Eisen, Wilhelms, Steinhage and SchwanderEisen and others, 2006; Reference MacGregorMacGregor and others, 2015) and paleoclimate (e.g. Reference TaylorTaylor and others, 1993; Reference Wolff and HondohWolff, 2000; WAIS Divide Project Members, 2013). Ice cores are analyzed electrically using several logging methods, most commonly the near-d.c. electrical conductivity measurement (ECM; Reference HammerHammer, 1980) and high-frequency (up to 300 kHz) dielectric profiling (DEP; Reference Moore and ParenMoore and Paren, 1987; Reference Wilhelms, Kipfstuhl, Miller, Heinloth and FirestoneWilhelms and others, 1998). These tools are optimized for rapid, continuous logging of ice cores. However, a broadband spectrum is required to characterize dielectric dispersion in a material (e.g. Reference Barsukov and MacdonaldBarsukov and Macdonald, 2005). Specifically, measurements distributed from 1 Hz to 100 kHz are necessary to resolve the dielectric relaxations present in ice, and to separate them from d.c. conductivity. Although some progress has been made in multi-frequency core profiling (e.g. Reference Sugiyama and HondohSugiyama and others, 2000), only laboratory measurements of individual ice samples have provided the dense frequency sampling necessary for robust characterization of the dielectric properties of glacier ice (e.g. Reference Fitzgerald and ParenFitzgerald and Paren, 1975; Reference MaenoMaeno, 1978; Reference Stillman, MacGregor and GrimmStillman and others, 2013a). In contrast, measurements ≫100 kHz respond only to the sum of d.c. and dielectric conductivity.
This study is motivated by new broadband measurements of polar and temperate glaciers, reported herein, that show both similarities to and differences with ice-sheet spectra. These relationships suggest general features of dielectric spectra that track the formation and evolution of all glacier ice. We first review the fundamentals of dielectric spectroscopy and the salient properties of earlier observations as they relate to diagnostic dielectric signatures of different types of glacier ice, setting aside detailed implications for physical chemistry that we have considered previously (Reference Grimm, Stillman, Dec and BullockGrimm and others, 2008; Reference Stillman, Grimm and DecStillman and others, 2010, Reference Stillman, MacGregor and Grimm2013a,Reference Stillman, MacGregor and Grimmb). We distinguish here between meteoric and accreted ice in polar ice sheets and polar and temperate glaciers, and we differentiate firn from ice for all sources. We evaluate these properties in terms of the formation and evolution of ice masses. We conclude by discussing the value of these dielectric signatures for interpreting several types of measurements, including dielectric spectroscopy of individual ice-core samples, electrical logs of full cores, and geoelectrical measurements in boreholes and soundings from the surface.
Background
Materials respond to time-varying electric fields by a combination of storage and dissipation of energy, which can be represented by a single, frequency-dependent complex number. Here we focus on complex permittivity
![]() . Other formulations are possible (e.g. complex resistivity or conductivity). The real permittivity ε′ determines energy storage (capacitance), and the imaginary permittivity ε″ determines energy dissipation (resistance). In principle, one can be predicted from the other using the Kramers–Kronig relations and assuming infinite bandwidth, but, in practice, measuring both gives greater robustness to fitting of bandwidth-limited spectra with multiple constituents.
. Other formulations are possible (e.g. complex resistivity or conductivity). The real permittivity ε′ determines energy storage (capacitance), and the imaginary permittivity ε″ determines energy dissipation (resistance). In principle, one can be predicted from the other using the Kramers–Kronig relations and assuming infinite bandwidth, but, in practice, measuring both gives greater robustness to fitting of bandwidth-limited spectra with multiple constituents.
Polarizability arises from specific charges, mobilities and length scales. It often follows a dispersion called a dielectric relaxation that is due to the frequency-dependent ability of charges to move within an applied electric field. The relaxation frequency f r is the frequency at which charges move over nearly their maximum possible extent during a single applied cycle. A useful description of a dielectric relaxation is the Cole–Cole model (Reference Cole and ColeCole and Cole, 1941). In general, we fit dielectric spectra to a sum of Cole–Cole relaxations plus a static (d.c.) conductivity:
where Δεi , τi and αi are the dielectric susceptibility, relaxation time (1/2πf r) and Cole–Cole distribution parameter, respectively, for the ith dielectric relaxation, ω is the angular frequency, ε ∞ is the high-frequency-limit permittivity, σ DC is the d.c. conductivity and ε 0 is the permittivity of the vacuum. The parameter α increases with the broadening of the distribution of length scales of charge motion. For a Debye relaxation (Reference DebyeDebye, 1929), with a single such length scale, α = 0. Dielectric relaxations are distinguished by an inflection in ε′ and a peak in ε″. The distinct appearance of the latter feature simplifies identification and Cole–Cole fitting.
The real part of the conductivity will also approach a high-frequency asymptote σ ∞ for a Debye relaxation (at any frequency, σ = εω), but in the general case of α > 0 there is a continued positive slope. For this reason, we report high-frequency conductivity σ HF at 300 kHz when discussing this quantity.
Between −40°C and −20°C, ice relaxation frequencies are typically >100 Hz and <1 kHz, so this range in f r can lead to significant dispersion between ∼1 Hz and ∼100 kHz. At radio frequencies (>1 MHz), the asymptotic conductivity due to ice relaxation can be inferred, but the ice dispersion itself is not resolved. Furthermore, the close agreement of the −20°C dielectric constant at 1 MHz (3.20 ± 0.02: Reference Fujita, Matsuoka, Ishida, Matsuoka, Mae and HondohFujita and others, 2000) and the dielectric constant at 10 MHz–1.5 GHz (3.18 ± 0.01: Reference Bohleber, Wagner and EisenBohleber and others, 2012) implies that dispersion is minimal and therefore there are no significant undiscovered dielectric relaxations of any kind across this band.
Both polarizability and conductivity in ice are due to protonic charge defects: lattice sites where hydrogen atoms are configured improperly with respect to adjacent H2O molecules (Reference Petrenko and WhitworthPetrenko and Whitworth, 1999). Ice contains a fixed density of intrinsic protonic defects, and extrinsic defects are generated by certain ions (impurities) that are soluble in the ice lattice (e.g. Reference Camplin, Glen and ParenCamplin and others, 1978). In practice, even the purest laboratory-grown ice contains a small proportion of extrinsic defects that are electrically detectable (Reference KawadaKawada, 1978). Dielectric relaxations are generally close to but distinct from the ideal Debye form. Reference MacGregorMacGregor and others (2015) demonstrated that the effect of non-Debye behavior on conductivity was critical to understanding the relationship between radar attenuation and temperature within the Greenland ice sheet.
For meteoric ice, the dominant soluble impurities are H+ from volcanic acids, Cl− from sea salt and NH4 + from biomass burning (Reference Wolff, Miners, Moore and ParenWolff and others, 1997). Reference JaccardJaccard (1959) described the relationships between defect and electrical properties in single-crystal ice, which we refer to hereafter as Jaccard theory (see Appendix). Reference Stillman, MacGregor and GrimmStillman and others (2013a) showed that the complex permittivity from d.c. to 1 MHz of meteoric polar ice can be fully explained by lattice-soluble impurities using Jaccard theory. Grain boundaries act as resistors that impede d.c. conduction, instead of providing interconnected conductive pathways as previously hypothesized (Reference Wolff and ParenWolff and Paren, 1984; Reference KulessaKulessa, 2007). Reference Stillman, MacGregor and GrimmStillman and others (2013a) also found that in situ ‘d.c.’ geoelectrical soundings of ice sheets actually better match laboratory-measured trends in σ ∞, therefore those earlier field measurements are unreliable. The true bulk d.c. conductivity is much lower than those field data, which invalidates earlier models explaining differences between temperate and polar ice that were based on perceived fundamental differences in their d.c. conductivities (Reference Gross, Wong and HumesGlen and others, 1977; Reference Reynolds and ParenReynolds and Paren, 1980).
The lattice impurity concentration in polycrystalline ice depends not only on the available sources, but also on the mode of formation. The partition coefficient k from liquid to the ice lattice is small for slowly frozen laboratory ice (∼10−3; Reference Gross, Wong and HumesGross and others, 1977; Reference Grimm, Stillman, Dec and BullockGrimm and others, 2008), because ice formed in this way very efficiently ejects impurities to the grain boundaries. In contrast, k = 0.3–0.8 for meteoric ice-sheet samples (Reference Stillman, MacGregor and GrimmStillman and others, 2013a). These high partition coefficients were derived by comparing Jaccard theory to an empirical relationship between σ HF and bulk impurity concentrations (Reference Wolff, Miners, Moore and ParenWolff and others, 1997; Appendix). Therefore impurity numbers in ice sheets are comparable between the lattice (where low volumetric concentrations are difficult to observe directly) and the much smaller grain boundaries (where higher concentrations can be detected using microscopic imaging (e.g. Reference Mulvaney, Wolff and OatesMulvaney and others, 1988)). We hypothesize that this behavior results from faster nucleation compared to laboratory freezing and consequent incomplete impurity ejection (Reference Stillman, MacGregor and GrimmStillman and others, 2013a). This difference in k explains why Reference Fitzgerald and ParenFitzgerald and Paren (1975) could not reproduce the electrical properties of a glacier ice sample that they melted and refroze. Weak partitioning from liquid also explains why ice in permafrost is nearly electrically pure (Reference Grimm and StillmanGrimm and Stillman, 2015), i.e. it has few extrinsic defects.
Samples and methods
Ice-core samples
We include all 26 Antarctic and Greenland samples measured by Reference Stillman, MacGregor and GrimmStillman and others (2013a), who focused on conduction mechanisms in meteoric polar ice. We include new measurements from the Vostok (Antarctica) 5G ice core that include both types of accreted ice found within that core (Reference JouzelJouzel and others, 1999; Reference De Angelis, Petit, Savarino, Souchez and ThiemensDe Angelis and others, 2004). We supplement these ice-sheet samples with two laboratory dielectric spectra from the earlier literature: the first is a deep sample from the 1968 Byrd Station (Antarctica) ice core (Reference Paren and GlenParen and Glen, 1978) and the second is a firn sample taken from the Palmer Land plateau, Antarctic Peninsula (Reference ReynoldsReynolds, 1985). We complete our survey of glacier ice with samples from two alpine glaciers: Upper Fremont Glacier, Wyoming, USA, and Mullins Glacier, Beacon Valley, Antarctica. Upper Fremont Glacier is a typical temperate mountain glacier whose high elevation and accumulation rate have proven useful for paleoclimate studies of the past several centuries (Reference Schuster, White, Naftz and CecilSchuster and others, 2000). Mullins Glacier is a cold-based, debris-covered glacier ∼8 km long; isotopic measurements of the overlying till suggest a maximum age ∼8 Ma (Reference MarchantMarchant and others, 2007). The terminus of this glacier, and a buried relict of Taylor Glacier that abuts it (Reference SugdenSugden and others, 1995), may be the oldest ice on Earth. Table 1 summarizes the origins, depths, ages and visual characteristics of the ice samples included in this analysis. All samples were obtained from the US National Ice Core Laboratory and were cut there to thicknesses of 7–14 mm. Samples were stored in our laboratory in a humidified freezer at −40°C for a period up to several months before measurement.
Key characteristics of ice samples evaluated in this study

Dielectric measurements
Samples were measured between two circular electrodes, an upper 55 mm diameter unguarded electrode and a lower guarded electrode whose diameter (10–30 mm) depended on the sample diameter (Solartron 12963A sample holder). The grounded guard (third) electrode was sized to match the diameter of the composite lower electrode to the upper electrode. Complex impedance was measured as a function of frequency and temperature using a Solartron 1260A Impedance Analyzer with a 1296A Dielectric Interface. This system is capable of measuring conductivities as low as 10−12 S m−1 and phases of 0.1 mrad. The impedance was converted to complex permittivity using the electrode geometry. Uncertainties estimated from repeat measurements are typically 5% and 10% for ε′ and ε″, respectively. For Mullins Glacier samples, some of which could not be microtomed due to englacial debris, there was no difference in dielectric signature between clear samples that were microtomed, and discolored or dirty samples that were not and that were frozen onto warmed electrodes instead.
Measurements were swept from high to low frequency, from 106 to 10−1 Hz (we rarely exploit the system’s lower limit of 10−3 Hz due to measurement time). Because measurements are more reproducible during warming and eliminate the possible confounding effects of meta-stable water, we typically cool samples slowly to −90°C and then collect data during slow warming (0.1°C min−1), with more than 30 min stabilization at each 2.5°C measurement interval. We observed no discontinuities indicating phase transitions. The large temperature range allows frequency-overlapping polarization mechanisms to be identified by the temperature dependence (activation energy) of their individual relaxation frequencies.
Modeling of dielectric spectra
At each temperature, the complex permittivity spectra were modeled as a sum of Cole–Cole relaxations and d.c. conductivity (Eqn (1)). We note that even if a spectral slope remains at low frequency, the d.c. conductivity can still be recovered accurately by this modeling procedure. We fit both ε′ and ε″ simultaneously; the model root-mean-square (RMS) misfit for both quantities was typically ∼1%. 95% confidence bounds on the Cole–Cole parameters for each relaxation were estimated using changes in goodness of fit (Δχ 2 distributions). The characteristic frequency for each relaxation reflects the total number of defects according to Jaccard theory (see Appendix). Reference Grimm, Stillman, Dec and BullockGrimm and others (2008) and Stillman and others (Reference Stillman, Grimm and Dec2010, Reference Stillman, MacGregor and Grimm2013a) provide additional details of measurement and fitting procedures.
Results
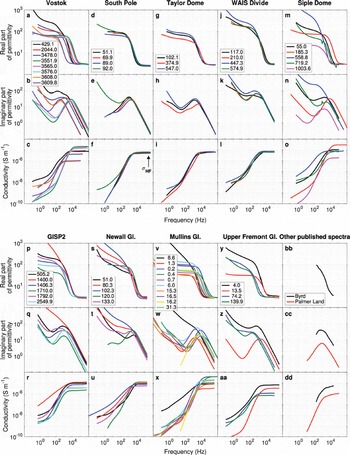
Figure 1 shows the dielectric spectra of all samples at approximately −40°C, illustrating the range of dielectric behaviors observed in glacier ice. This temperature was the highest measured across all samples (some were measured at higher temperatures, but not uniformly so) and was selected to avoid any potential pre-melting effects. However, we note that this temperature is somewhat lower than those (typically −20°C) at which full-core profiling methods are collected (e.g. ECM, DEP). Cole–Cole fitting (Table 2) separates the individual dielectric relaxations that combine to produce the observed dielectric spectra, and Figure 2 shows representative examples of these fits. These multiple relaxations include both the polarization of protonic defects in the ice lattice and extraneous electrode polarizations (labeled as ‘other’ in Fig. 2). F-tests indicate that fitting of multiple relaxations is highly significant (p < 0.01) because the normalized reduction in χ 2 typically exceeds 95% and the number of parameters added for each relaxation (3) is small compared to the number of spectral data points (∼50 complex values).
Dielectric spectra of all samples at −40°C. Each column represents a different ice core, and the individual curves represent each sample (legend gives depth (m)). The top two rows for each sample are the free-space normalized real ε′ and imaginary ε″ parts of the complex relative permittivity (i.e. the real and imaginary dielectric constants). The bottom row shows real conductivity . Dielectric relaxations can be identified as peaks in ε″ and inflections in ε′ . Note high-frequency (HF) conductivity at 300 kHz (σ HF) is highlighted for South Pole samples. Byrd and Palmer Land samples shown in lower right column were digitized from measurements by Reference Paren and GlenParen and Glen (1978) and Reference ReynoldsReynolds (1985), respectively.
Cole–Cole fits at −40°C for selected samples. Dielectric relaxations associated with the ice lattice are shown in red and blue. The d.c. conductivity and electrode polarizations are shown in grey (labeled as ‘other’). RMS misfits are ∼1% and F-tests indicate that multiple relaxations significantly improve the fits.

Cole–Cole parameters
Figure 3 is an Arrhenius plot of relaxation frequency as a function of temperature, showing that individual relaxations associated with the ice lattice are consistently distinguishable in terms of both their magnitude and temperature dependence. Finally, Figure 4 shows modeled σ HF at −40°C for all samples and for each relaxation. We also use Jaccard theory to infer the concentration of soluble impurities in the lattice from f r (Appendix). Because we do not have complete bulk chemistry information for all samples, we express the impurity concentration as the apparent concentration of a single species, alternatively [H+] or [Cl−] (Fig. 4b).
Arrhenius plot of reciprocal temperature vs relaxation frequency for the samples shown in Figure 2. The relaxation frequencies of ice crystal populations are higher than those of laboratory-frozen pure ice (Reference KawadaKawada, 1978), whose change in slope is due to laboratory purity limit. These relaxations are also generally below Cl−-saturation limit (Reference Grimm, Stillman, Dec and BullockGrimm and others, 2008), except where NH4 +-enhanced Cl− partitioning is present (Reference Stillman, MacGregor and GrimmStillman and others, 2013b).

(a) HF conductivity of all samples at −40°C. (b) Apparent lattice impurity concentrations, derived assuming either [H+] (left axis) or [Cl−] (right axis) was the only soluble impurity (Appendix). HF conductivities for two relaxations sometimes merge at -40°C, but fitting time constants at multiple temperatures (Fig. 3) assures that dual relaxations are resolved. Firn (open symbols) is distinguished from glacier ice (filled symbols). Two relaxations are common, even in firn, indicating that impurities are bimodally partitioned into crystal lattices during formation. Single relaxations in Vostok accreted ice are the result of direct freezing from liquid. Single relaxations of temperate ice trend toward increasing purity with depth, indicating that near-complete impurity ejection from the lattice is the end result of annealing.

A large majority (23/26) of the meteoric ice-sheet samples possess two dielectric relaxations. A third relaxation was resolved in GISP2 (Greenland) 1406 m that has been discarded for clarity in the analysis here (Reference Stillman, MacGregor and GrimmStillman and others, 2013a). Two relaxations require two distinct impurity populations. Often, one of these relaxations has the characteristics of nearly pure ice. The remainder (3/26) of the meteoric ice-sheet samples have a single relaxation. All of these samples are associated with high bulk impurity concentrations, although other samples with high impurity concentrations may still retain two relaxations. Vostok samples possess three distinct behaviors: two relaxations associated with meteoric ice (the three shallowest samples); a single relaxation indicating high impurities from the impurity-rich type 1 accreted ice; and a single relaxation indicating relatively high purity in the deeper lake-accreted ice (type 2; the two deepest samples).
Due to the presence of insoluble inclusions, the first type (1) of Vostok accretion ice is believed to have frozen onto either the grounded base of the East Antarctic ice sheet upstream of Vostok Subglacial Lake itself or within a shallow bay upstream of the main lake body (Reference Bell, Studinger, Tikku, Clarke, Gutner and MeertensBell and others, 2002; Reference De Angelis, Petit, Savarino, Souchez and ThiemensDe Angelis and others, 2004; Reference MacGregor, Matsuoka and StudingerMacGregor and others, 2009). Its relatively high σ HF values are equivalent to apparent [Cl−] ∼10−4 M, or a source-water concentration ∼0.1 M assuming k = 10−3. This result is consistent with Cl− as the major impurity in this ice (Reference De Angelis, Petit, Savarino, Souchez and ThiemensDe Angelis and others, 2004) and a brackish source. At the other extreme, the lake-accreted ice (type 2; 3608 and 3610 m) is nearly pure, as to be expected from a very low partition coefficient and a large freshwater body (Reference Kapitsa, Ridley, Robin, Siegert and ZotikovKapitsa and others, 1996).
The sample from Mullins Glacier nearest the accumulation zone has two relaxations, and, as with the ice sheets, one indicates a population of nearly pure ice. The other Mullins Glacier samples have a single relaxation, with the notable exception of a sample near the end of the active portion of the glacier whose two relaxations indicate two distinct high-impurity populations. Many of the Mullins Glacier samples have among the highest HF conductivities and apparent soluble lattice impurities in our study. Upper Fremont Glacier samples mostly have single relaxations, and its deepest sample (>90% of the local ice thickness) indicates a near-pure ice lattice. Firn samples (6 total) have either one (2/6) or two (4/6) relaxations and thus are similar to densified ice in terms of Cole–Cole behavior.
Discussion
Primary features of dielectric signatures
Both the characteristic relaxation frequencies and their associated activation energies observed in many of our samples fall within ranges expected for protonic point defects in ice (Fig. 3). Therefore, we ascribe dual relaxations to the ice lattice, rather than attributing one to another mechanism such as a Maxwell–Wagner interfacial polarization. Low-frequency (<1 Hz at −40°C; Fig. 2) relaxations in our measurements, outside the ice-lattice range, can be attributed to electrode polarization. Additional polarizations have been reported in shaved glacier ice (Reference Paren and GlenParen and Glen, 1978) and artificially dispersed ice (Reference Boned, Lagourette and ClausseBoned and others, 1979). These polarizations also lie outside the protonic-defect domain, and we suggest they are interfacial effects. For ice grown from liquid in the laboratory, we have never observed two or more relaxations that can be attributed to the lattice (cf. Reference Von Hippel, Knoll and Westphalvon Hippel and others, 1971, et seq.). At very high salt concentrations in the parent liquid (>1 M), the dielectric relaxation of salt hydrate can appear (Reference Grimm, Stillman, Dec and BullockGrimm and others, 2008), but this complication is not relevant to low-impurity glacier ice.
The presence of two relaxations, therefore, appears to be unique to meteoric ice and indicates two separate ices with different impurity concentrations. If these impurities were well mixed, they would yield a single relaxation whose frequency was related to the mean impurity concentration, but perhaps with a broader distribution of length scales of charge motion (larger α). These two impurity populations could represent two distinct crystal populations, bimodal zonation within crystals, or a large number of separate, smaller bimodal electrical domains within a crystal. The last possibility is especially speculative, but could involve enhanced concentrations of defects near dislocation cores necessary to overcome the proton-disorder barrier, or screening charge clouds that surround dislocation dangling bonds (Reference Petrenko and WhitworthPetrenko and Whitworth, 1999).
Impurity partitioning into the ice lattice could be affected by the nature of impurity deposition on the subaerial surface (Reference Stillman, MacGregor and GrimmStillman and others, 2013a), i.e. whether it occurs through aerosol deposition (‘dry’) or whether impurities are incorporated within snowflakes (‘wet’). It is not clear how wet vs dry impurity deposition could generate distinct grain populations. On the other hand, scanning-electron and X-ray imaging of ice (Reference Mulvaney, Wolff and OatesMulvaney and others, 1988; Reference Barnes, Wolff, Mallard and MaderBarnes and others, 2003) revealed that NaCl and other salts are present as inclusions within ice grains. The threshold concentration for impurity detection with these methods (∼10−3 M) greatly exceeds bulk concentrations (∼10−6 M). Therefore, the lattice around the inclusions may be significantly enhanced in soluble ions as sensed dielectrically, forming multiple ‘cores’ of impurities surrounded by a ‘mantle’ of relatively pure ice.
Alternatively, lattice impurities may be pushed toward grain boundaries immediately upon recrystallization from snow to firn. This arrangement is supported by microscopic imaging (Reference Barnes, Wolff, Mallard and MaderBarnes and others, 2003) that identified coating of grain boundaries with salts and acids. Again, the high detection threshold for those imaging methods suggests that a zone of dielectrically impure ice may be adjacent to such grain-boundary coatings. In this configuration, a single purer core of each grain is surrounded by an impure mantle.
The lower bound for the dimension of electrical domains is the characteristic polarization displacement of protonic-point defects, which we estimate to be ∼1 μm (see Appendix). If zonation existed on a smaller scale, charges would be unable to move through a sinusoidal cycle at the relaxation frequency and the relaxation spectrum would be distorted. Because this dimension is a very small fraction of the typical grain diameter, the core/mantle zonation hypothesis posed above is tractable. However, dislocation widths may be as small as one unit cell, so associated point-defect zones might be tens of unit cells wide, i.e. ∼0.01 μm. Hence, we conclude that individual dislocations are too small to be the sources of the bimodal dielectric relaxations observed in glacier ice. However, dislocations are known to interact over longer distances (Reference Duval, Montagnat, Grennerat, Weiss, Meyssonnier and PhilipDuval and others, 2010), so an effect of dislocations over larger scales cannot be ruled out.
Single-relaxation ice represents the minority of our samples, but it is not rare and occurs in all ice types we examined. Three of the meteoric ice-sheet samples (Siple Dome (Antarctica) 185 m; GISP2 2250 m; Newall Glacier (Antarctica) 133 m) possess single relaxations and were among the most impure samples for those respective cores that we sampled (Reference Stillman, MacGregor and GrimmStillman and others, 2013a). Single relaxations dominate the Vostok accreted ice (5/5) and both alpine glaciers (10/12). The Mullins Glacier samples have σ HF values that are higher than average, which presumably reflects the higher concentration of lattice-soluble impurities that accompanies the source-zone debris input. However, there is no clear relationship between dielectric signature and macroscopic englacial debris concentration or even ice discoloration in Mullins Glacier samples (Table 1). Because discolored ice is found at many levels in the cores, it is likely an effect of variable dust loading and not basal entrainment (cf. Reference Holdsworth and BullHoldsworth and Bull, 1970). Further, the concentration of englacial debris even in discolored samples of Mullins Glacier must be small, because no ice–silicate interfacial polarizations are evident (Reference OlhoeftOlhoeft, 1977; Reference Stillman, Grimm and DecStillman and others, 2010; Reference Grimm and StillmanGrimm and Stillman, 2015).
Evolution of dielectric signatures
There are several key observations that shed light on the dielectric evolution of glacier ice. (1) Two relaxations are widespread in ice and firn. In GISP2, two relaxations are preserved through normal recrystallization/grain growth. In many ice sheets, two relaxations are still evident at the greatest ages sampled, up to a few hundred thousand years. (2) Conversely, the three ice-sheet samples that have only one relaxation are relatively impure, or are the deepest/ oldest in that core. Mullins Glacier samples, dominated by single relaxations (6/8), are both impure and old (at least several hundred thousand years in the analyzed core; note that the putative 8 Ma ice is at the glacier terminus). (3) In temperate Upper Fremont Glacier, 3/4 of the samples have only one relaxation, and the three single relaxations trend toward lower σ HF with increasing depth. We now consider the significance of these observations for understanding the evolution of soluble impurities within glacier ice. Table 3 summarizes the relationships between observations and our proposed evolution.
Summary of types of dielectric signatures and associated glacier ice types. Meteoric ice evolves from upper left to lower right

We hypothesize that annealing, probably grain internal recovery, can explain part or all of these observations. We adopt the metallurgical definition of annealing (Reference DohertyDoherty and others, 1997) as the sum of processes that cause high-angle grain-boundary migration (recrystallization) and those internal processes removing dislocations and point defects (recovery). Because firn can also have two relaxations, we assume that all meteoric ice initially possesses (or is at least capable of possessing) two relaxations (dielectric populations). As ice ages, annealing causes these two populations to merge into one, and this process is strongly temperature-dependent. Anomalously high concentrations of lattice-soluble impurities accelerate annealing and hence the population-merging process. Annealing further purifies ice by progressively removing lattice defects.
In terms of the specific hypotheses introduced above for the nature of the dielectric domains, the annealing hypothesis does not favor two initially distinct crystal populations, because merging during normal recrystallization would then immediately combine the two dielectric relaxations into one. However, multiple impure cores formed around aerosol nuclei could be preserved while grain boundaries are changing, or impure mantles could continuously remerge on migrating grain boundaries.
Preservation of two dielectric relaxations through the process of normal grain recrystallization implies further that the subsequent process that merges dielectric domains is grain internal recovery. Specifically, grain growth in GISP2 is complete in <5 ka (Reference GowGow and others, 1997; Reference MeeseMeese and others, 1997), yet two dielectric relaxations are evident for at least 20 ka. Indeed, several of our samples have ages exceeding 100 ka and still show two dielectric relaxations (Vostok 2044 m, Taylor Dome (Antarctica) 544 m and Mullins Glacier MCI-09-003 15.3 m; Table 1).
Figure 4 shows that there is no clear relationship between dielectric signature and mean annual surface temperature (a simple proxy for depositional conditions) and only hints at such a relationship with depth (a simple proxy for time). One of these three samples is ∼150 ka old (Vostok 2044 m), implying that over this period at low in situ temperatures (<−35°C), it has not yet experienced sufficient annealing to merge the impurity populations. Our deepest GISP2 sample (2550 m) had only a single relaxation and is only 67 ka old, but it experienced generally higher temperatures. We note that typical surface speeds of the Antarctic ice sheet are ∼10 ma−1 (Reference Rignot, Mouginot and ScheuchlRignot and others, 2011) and all of the ice-core samples we measured were drawn from average- to slower-flowing locations. Samples from fast-moving ice (>100 m a−1) would help further constrain the relative importance of cumulative strain upon dielectric evolution.
These slow rates for merging dielectric populations imply lower diffusion coefficients D or higher activation energies E a than those derived for recrystallization. For example, E a for volume self-diffusion (62 kJ mol−1; Reference Petrenko and WhitworthPetrenko and Whitworth, 1999) is larger than that for recrystallization (42 kJ mol−1; Reference Cuffey and PatersonCuffey and Paterson, 2010). However, even when accounting for these possible differences, D must be at least two orders of magnitude smaller than the volume self-diffusion coefficient (Reference Petrenko and WhitworthPetrenko and Whitworth, 1999). Assuming t > t d ∼ r 2/π 2 D, where t is the observed greatest age with two relaxations, t d is a characteristic diffusion time and r is the grain radius ( 3 mm), we find that D must be less than ∼10−18 −10−17 m2 s−1 at −20°C to account for the long recovery times implied by our observations of the Siple Dome, Byrd, GISP2, Taylor Dome and Vostok ice cores. We hypothesize that the Mullins Glacier sample from the ∼600 ka core (MCI-09-003) that still possesses two relaxations was further delayed in annealing due to insoluble-impurity pinning or an anomalously low temperature.
The common pattern of two relaxations with variable degrees of apparent purity is consistent with a stochastic climatic overprint associated with variable impurity deposition and the well-recognized dielectric stratigraphy of ice cores recorded by ECM and DEP. This overprint can occasionally produce an anomalous dielectric signature (i.e. a single relaxation), despite similar physical conditions and history (temperature and age), as appears to have occurred for at least three of our samples (Siple Dome 185 m; GISP2 2250 m; Newall Glacier 133 m). Based on the dielectric signatures of these samples, we further hypothesize that unusually high concentrations of lattice-soluble impurities accelerate annealing.
In contrast, ice with the oldest double relaxation observed in temperate Upper Fremont Glacier was formed only about a decade before coring, suggesting that D is only a few times smaller than expected for volume diffusion. Reference Reynolds and ParenReynolds and Paren (1980) invoked faster recrystallization rates in temperate glaciers, as compared to polar glaciers, to explain the lower d.c. conductivity of the former. However, their hypothesis has been invalidated by the discovery that ‘d.c.’ polar field measurements were instead generally sensitive to the HF response of ice (Reference Stillman, MacGregor and GrimmStillman and others, 2013a). Nevertheless, annealing remains central to our present hypothesis as to why temperate glaciers rapidly evolve dielectrically into a single-relaxation material.
Ultimately, soluble impurities may be completely ejected from the lattice to the intergranular surfaces, where they no longer have a dielectric relaxation because they are in intergranular liquid or have become enclathrated. In Upper Fremont Glacier, the three samples showing single relaxations are increasingly pure with depth. Meltwater flushing cannot directly affect lattice-incorporated impurities, so either this ordering is coincidence (17% three-way permutation probability) or lattice impurity concentrations are decreasing with increasing depth or time. The time to evolve toward nearly pure ice appears to be a few centuries, also consistent with volume diffusion. The lower temperatures, higher activation energies, lower diffusion coefficients or higher proportion of insoluble impurities appropriate to non-temperate ice inhibit this progression.
Single relaxations with high Cl− concentrations are also found in Vostok accreted ice type 1. Although the single relaxation is readily distinguished as a primary difference between accreted or laboratory-frozen ice compared to meteoric ice, the apparent lack of annealing toward a pure lattice is unexpected. Larger diffusion times would be associated with the larger (∼20cm) crystals of Vostok accreted ice type 1; therefore, if impurity rejection is controlled in the same way as Upper Fremont Glacier, the upper limit to the age of this accreted ice is ∼1000 years. The high purity of accreted ice type 2 likely arises directly from partitioning from Vostok Subglacial Lake.
Conclusions
We surveyed the broadband dielectric behavior (0.1 Hz–1 MHz) of 49 samples of naturally formed glacier ice (including two from previous studies), produced by multiple formation mechanisms, containing varying impurity concentrations and subjected to differing temperature histories. This large sample size enabled a first qualitative classification and analysis of the variety of broadband dielectric signatures that are observed in such ice. A synthesis of these measurements reveals the following: (1) Meteoric polar ice generally possesses two dielectric relaxations representing a bimodal zonation of impurity domains. These zones likely either surround insoluble impurities within the lattice or form coatings near grain boundaries. (2) Higher temperatures, longer time periods and higher impurity concentrations all tend to result in a single-relaxation dielectric signature, presumably reflecting greater cumulative annealing, specifically grain internal recovery. Not all samples obey these relationships, further indicating the importance of spatio-temporally variable impurity deposition in modulating the dielectric signature of meteoric ice. (3) Subglacially accreted (lake-frozen) ice possesses only one relaxation, whose degree of purity likely reflects the accretion rate and composition of the source water.
These common dielectric signatures underlie the time-variable impurity deposition that produces the variable bulk signals typically observed in ECM and DEP logs. A key source of uncertainty in our conclusions that warrants further investigation is a quantitative evaluation of the relationship between annealing rates and dielectric properties (e.g. HF conductivity). In particular, the slower diffusion implied by the dielectric evolution compared to volume diffusion requires further investigation. We suggest that focused application of other tools applied to study ice (e.g. electron microscopy, diffraction topography, measurements at radio- to infrared frequencies) may reveal the origin of distinct impurity domains.
This study further demonstrates the utility of broadband (<1 Hz to >100 kHz) laboratory measurements of complex permittivity for understanding the origin and evolution of glacier ice using cut core samples. Multi-frequency profiling of full cores would provide spatially complete core data. We recommend that the minimum frequency be reduced to <1 Hz to allow robust Cole–Cole fitting and separation of the constituent conduction and polarization mechanisms. Such a change would, however, decrease the speed of data acquisition to ∼1 mm s−1. We also recommend that such full-core profiling be performed at the lowest temperature possible, well below the typical −20°C, as lower temperatures enhance separation and modeling of multiple ice relaxations.
Acknowledgements
This work was funded by NASA’s Planetary Geology and Geophysics program (NNX14AN30G) and by Southwest Research Institute (Internal Research Grant R8422). We acknowledge Mark Twickler, Geoffrey Hargreaves and Richard Nunn for access to and preparation of ice samples at the US National Ice Core Laboratory. We are grateful to Doug Kowalewski for discussions about Mullins Glacier and for initiating our sample requests. We thank Steve Arcone and an anonymous reviewer for constructive comments.
Appendix
Jaccard theory and apparent soluble-impurity concentrations
We use Jaccard theory (Reference Petrenko and WhitworthPetrenko and Whitworth, 1999) to determine the concentration of lattice defects from the measured dielectric properties (Fig. 4). We express these defect concentrations alternatively as the apparent lattice concentration of H+ or Cl−, because these impurities are dominant in naturally formed ice. We denote these concentrations as ‘apparent’ because either, both, or their combination with NH4
+ could produce the observed dielectric signature. These concentrations were estimated using a dimensionless constant G = 3, the mean distance between oxygen ions in the ice lattice (rOO
= 2.764 ×10⁻¹⁰ m), the mobility of L-defects at
![]() , the mobility of ionic defects at
, the mobility of ionic defects at
![]() , the charge of L-defects (e
L = 0.38e, where e is the charge of a proton) and the charge of ionic defects (e
+ = 0.62e). The temperature dependence of was analyzed to estimate [Cl−] and the activation energy of the mobility. We also assume that a single Cl− ion produces two L-defects, i.e. n
L = 2[Cl−], while a single H+ ion produces a single ionic defect n
+ = [H+]. Jaccard theory defines and as
, the charge of L-defects (e
L = 0.38e, where e is the charge of a proton) and the charge of ionic defects (e
+ = 0.62e). The temperature dependence of was analyzed to estimate [Cl−] and the activation energy of the mobility. We also assume that a single Cl− ion produces two L-defects, i.e. n
L = 2[Cl−], while a single H+ ion produces a single ionic defect n
+ = [H+]. Jaccard theory defines and as
where
![]() , k
B is the Boltzmann constant and T is temperature. We then assume alternately that the relaxation is due to ionic or L-defects only:
, k
B is the Boltzmann constant and T is temperature. We then assume alternately that the relaxation is due to ionic or L-defects only:
The end-member conductivities in Eqn (A4) can then be translated to end-member (apparent) concentrations first by assuming that L-defects dominate and fitting observed τ as a function of temperature to find the activation energy of μ L.
Once the apparent [Cl−] has been calculated, apparent [H+] follows from
Length scale of charge motion
We exploit the analogy between flow of heat and charge to determine the characteristic length scale of protonic-defect displacement within the ice lattice in response to an applied electric field. The e-folding time constant is derived from the polarization response to a step change in voltage. Following a step change in temperature to a one-dimensional half-space, the corresponding length scale as a function of time is approximately
![]() , where D is the diffusion coefficient (Reference Carslaw and JaegerCarslaw and Jaeger, 1959). The angular relaxation frequency is the reciprocal of the relaxation time. We take τ = 8.4 × 10⁻¹⁴ exp(5000/T) as representative of our samples; this function is logarithmically intermediate between pure and chloride-saturated ice.
, where D is the diffusion coefficient (Reference Carslaw and JaegerCarslaw and Jaeger, 1959). The angular relaxation frequency is the reciprocal of the relaxation time. We take τ = 8.4 × 10⁻¹⁴ exp(5000/T) as representative of our samples; this function is logarithmically intermediate between pure and chloride-saturated ice.
We then calculate D = k B Tμ L/e L (Reference Petrenko and WhitworthPetrenko and Whitworth, 1999), where the mobility and charge are appropriate to the majority L-defects, which dominate a.c. conduction. Using the values given above for μ L and e L, we calculate δ = 0.5 μm at −20°C. The activation energy 0.24 eV for L-defects increases δ only to 0.9 μm at −50°C. Therefore, the characteristic length scale to which defect charges can be dielectrically displaced is large compared to the lattice spacing (0.3 nm), but small compared to typical grain sizes (>1 mm). We note that there are no theoretical limitations to charge movement under a steady (d.c.) applied current, where lattice conductivity is determined by the appropriate balance of defect types (Reference Petrenko and WhitworthPetrenko and Whitworth, 1999) modulated by grain-boundary resistance (Stillman and others, 2010).


 Open access