


Obesity is a critical public health problem in the USA( Reference Chan and Woo 1 – Reference Rao, Powell-Wiley and Ancheta 5 ). Trends have documented increases in obesity levels across all racial and ethnic groups in the last few decades( Reference Flegal, Carroll and Kit 2 , Reference Ogden, Carroll and Kit 4 ). Over a third (35·7 %) of the adult population is now considered obese( Reference Flegal, Carroll and Kit 2 ) and obesity is associated with a wide range of adverse consequences ranging from low self-esteem( Reference Clarke, O’Malley and Schulenberg 6 ) to type 2 diabetes, heart disease and some cancers( Reference Chan and Woo 1 , Reference Babey, Jones and Yu 7 ).
The aetiology of obesity is multifaceted and comprises a complex web of factors( Reference Chan and Woo 1 ). However, much of the public health efforts have focused on improving the two primary components of energy balance, dietary intake and physical activity( Reference Woodward-Lopez, Kao and Ritchie 8 ). In recent years there has been burgeoning interest in the role of sugar-sweetened beverages (SSB) as a critical factor in the obesity epidemic( Reference Hu and Malik 9 – Reference Falbe, Rojas and Grummon 11 ) considering they are the main source of added sugar in the US diet( Reference Hu and Malik 9 , Reference Malik, Pan and Willett 12 ). SSB (e.g. sodas, fruit juices and energy drinks) with energy-containing sweeteners, such as sucrose, high-fructose corn syrup or added fruit juice concentrates, are characterized as ‘liquid candy’ and are considered risk factors for obesity, having replaced more nutritious beverages including milk, 100 % fruit juice and water( Reference Woodward-Lopez, Kao and Ritchie 8 , Reference Nielsen and Popkin 13 ). Also, studies have shown that drinking soda, for example, is associated with increased consumption of energy-dense snacks, particularly sweet food items, as researchers posit that the sugary drink increases cravings for sweet food( Reference Bleich, Wolfson and Vine 14 ). Additionally, people do not report feeling as full as they would have if they consumed the same amount of energy through food and are therefore less likely to compensate their food intake to account for the energy consumed through the beverage( Reference Hu and Malik 9 , 15 ).
Racial/ethnic disparities in obesity have been widely documented( Reference Kirby, Liang and Chen 3 ) with Latinos and Blacks having higher rates than Whites( Reference Flegal, Carroll and Kit 2 , Reference Ogden, Carroll and Kit 4 ). Yet, there is a dearth of research looking at disparities in obesity risk via SSB consumption. A limited number of studies have assessed how SSB consumption varies by sociodemographic characteristics( Reference Babey, Jones and Yu 7 , Reference Han and Powell 16 ) and found that rates are higher among Blacks, Latinos( Reference Kumar, Pan and Park 17 ) and people who have lower income and lower levels of education( Reference Woodward-Lopez, Kao and Ritchie 8 , Reference Han and Powell 16 ). The present study aims to help fill the gap in the literature by focusing on SSB consumption and obesity levels among Asian Americans, an understudied group in obesity research. Studies are calling for more research on obesity risk factors among Asians( Reference Davis, Busch and Hammatt 18 – Reference Anda, Whitfield and Felitti 22 ) because, although Asian Americans have lower obesity rates than other racial/ethnic groups( Reference Maxwell, Crespi and Alano 20 , Reference Bates, Acevedo-Garcia and Alegria 23 ), rates have been increasing over time( Reference Guerrero, Ponce and Chung 19 , Reference Park, Wang and Kitahara 21 ). Moreover, Asians constitute the fastest-growing racial group in the USA and the largest proportion of recent immigrants( 24 ) and findings suggest that Asians may be susceptible to obesity-related chronic diseases at lower BMI levels than Whites( Reference Rao, Powell-Wiley and Ancheta 5 , Reference Maxwell, Crespi and Alano 20 ).
An existing limitation in public health research among Asian Americans is the tendency to aggregate data such that they are analysed and discussed as one group (collapsing a heterogeneous group including East Asian Americans and South Asian Americans or US-born and foreign-born Asians). This approach disguises disparities between and within groups that other research has noted( Reference Davis, Busch and Hammatt 18 , Reference Park, Wang and Kitahara 21 , Reference Holland and Palaniappan 25 , Reference Wang and Beydoun 26 ).
Given the large proportion of immigrants among Asian Americans, we were motivated by studies critiquing the overemphasis on negative acculturation effect, which posits that immigrants come to the USA with superior health behaviours that then worsen over time and among subsequent generations, in immigrant health research( Reference Anda, Whitfield and Felitti 22 ). Specifically, we attempted to illustrate that there are indeed mixed findings not only by Asian-American subgroups in general, but also by place of birth, to help build the growing body of literature challenging the conventional approach of acculturation theory( Reference Anda, Whitfield and Felitti 22 , Reference Viruell-Fuentes, Miranda and Abdulrahim 27 ). Thus, the purpose of the current study was to provide preliminary analyses examining the association between SSB (specifically soda) consumption and obesity risk among various Asian-American subgroups and by place of birth. The hope was to determine if the deleterious effects of soda are uniform across groups and if they vary by place of birth for individuals of the same Asian-American subgroup.
Methods
Data source
The present study used data from the 2009 Adult California Health Interview Survey (CHIS), a cross-sectional survey of California adults (aged 18 years or over) conducted between September 2009 and April 2010. The CHIS used a multistage sample design aimed to be representative of the household-dwelling California adult population as well as to provide estimates for the state’s major racial and ethnic subgroups. Using random digit dialling, households were contacted and a random adult within the household was selected to participate in the CHIS. The CHIS was administered in English, Spanish, Mandarin, Cantonese, Vietnamese and Korean using a computer-assisted telephone interviewing system. The CHIS includes replicate weights and adjustments to account for differential selection probabilities, non-response bias and stratification( 28 ). CHIS data used in the present study were de-identified and publicly available, thus not requiring approval by an institutional review board. The original study was conducted with institutional review board approval through the University of California, Los Angeles and using verbal consent.
While more recent versions of the CHIS have been conducted, CHIS 2009 was selected because it included a targeted oversample of Korean-American and Vietnamese-American individuals, which was not conducted in subsequent years( 28 ).
Overall, 47 614 adults completed the survey and missing data were imputed using hot deck imputation by the CHIS( 28 ). For the present study the sample was restricted to the 36271 respondents who identified as non-Latino White or Asian. In all, 31 167 respondents were non-Latino White and 5104 were Asian American (specifically 1065 Chinese, 428 Japanese, 958 Korean, 507 Filipino, 420 South Asian, 1423 Vietnamese, and 303 were from other Asian-American subgroups).
Variables
The independent variable of interest was soda consumption. Respondents were asked: ‘During the past month, how often did you drink soda or pop that contains sugar? Do not include diet soda.’ Respondents indicated how many times in the past month they drank soda. For the current study, a CHIS-constructed variable that converted this to times per week, by dividing the month value by 30 to convert to times for day and multiplying by 7, was used. The CHIS flagged, removed and imputed seven cases that had daily soda consumption of eight or more times( 29 ).
The main predictors of interest were Asian-American identity and place of birth. Asian-American identity was broken down into seven national- and regional-origin subgroups: Chinese, Japanese, Korean, Filipino, South Asian, Vietnamese and Other Asian. This latter category included individuals who identified as South-East Asians or with two or more Asian subgroups. For some analyses, individuals identifying as non-Latino White were used as the reference group. Place of birth was measured as US-born v. foreign-born, with US-born individuals serving as the reference group.
The main outcome of interest was obesity (i.e. BMI greater than or equal to 30 kg/m2)( 30 ). Gender, age, income and years of education were included as control variables. Males served as the reference group for gender. Age was measured continuously, but all ages above 85 years were top coded to age 85 years in the CHIS. Income was measured as annual household income in thousands of US dollars. The CHIS top coded all responses greater than $US 300 000, as $US 300 000. Years of education were originally coded into broad categories: no formal education, grade 1–8, grade 9–11, grade 12/high school, some college, vocational school, AA/AS, BA/BS, some grad school, MA/MS, PhD or equivalent. These categories were recoded to represent years of education completed by taking the year values in the middle of each category or the year equivalent.
Statistical analysis
All analyses were conducted using the statistical software package Stata version 14.1, using eighty replicate weights. First, descriptive statistics were run (i.e. means and frequencies), stratified by race (Table 1). These descriptive statistics where then compared by Asian-American subgroup using linear and logistic regression (Table 1). Next, a logistic regression model predicting odds of obesity from Asian subgroups, soda consumption and race by soda interaction terms was run (Table 2). This model controlled for gender, age, years of education and income. Finally, a model for each subgroup was run predicting obesity from nativity status, while controlling for gender, age, years of education and income (Table 3). For logistic regression analyses in Tables 2 and 3, models were rerun by altering the reference groups for ethnic groups and place of birth so as to provide a complete picture of interactions. To evaluate model fit, the Hosmer–Lemeshow Goodness of Fit (HLGOF) statistic was calculated for logistic regression models. Finally, to illustrate interactions, predicted probabilities of obesity were plotted by Asian-American subgroup, mirroring the results from Table 2.
Table 1 Sample characteristics by ethnic origin: non-institutionalized adults aged 18 years or over, California Health Interview Survey 2009 (n 36 271)
Means, frequencies and se are weighted.
* P value test for differences among Asian-origin groups.
Table 2 Logistic regression predicting obesity from soda consumption and ethnicity among non-institutionalized adults aged 18 years or over, California Health Interview Survey 2009 (n 36 271)
AOR, adjusted OR; ref., reference category.
Significant AOR and 95 % CI denoted in bold.
* Adjusted for gender, age, years of education and income.
† Represents the effect of each additional soda consumed for Whites.
‡ Represents the odds of being obese for each ethnic-origin group, relative to Whites and soda consumption of zero times per week.
§ Represents the difference in the effect of each additional soda consumed for Asian-American subgroup, relative to Whites.
Table 3 Logistic regression predicting obesity from soda consumption and place of birth by ethnicity among non-institutionalized adults aged 18 years or over, California Health Interview Survey 2009 (n 36 271)
AOR, adjusted OR; ref., reference category.
* Significant AOR and 95 % CI denoted in bold.
† Represents the effect of each additional soda consumed for US-born individuals.
‡ Represents the odds of being obese for foreign-born individuals, relative to US-born individuals and soda consumption of zero times per week.
Results
As Table 1 shows, less than a fifth of the sample was obese, with non-Latino Whites having the highest rates of obesity (21·08 %). Among the subgroups, Japanese Americans had the highest rates of obesity (13·73 %) and Chinese Americans had the lowest (3·72 %). Overall, respondents reported drinking soda, on average, 1·67 times per week. Among Asian Americans, this value was highest among Filipino Americans and lowest among Chinese Americans (1·81 v. 0·68). Among the sample overall, 22·61 % was foreign-born with South Asian Americans having the highest (84·76 %) and Japanese Americans having the lowest rate (21·32 %). Overall, the average age was 47·56 years, the average level of education was a little more than an AA/AS degree (14·41 years) and the average household income was $US 88610 in the past year. Slightly more than half of the sample was female (51·45 %). All descriptive statistics varied by subgroup (P<0·05).
Relationship between soda consumption and odds of being obese by Asian subgroup
Table 2 shows a logistic regression model predicting obesity from race, obesity from soda consumption and the race by soda consumption interaction, while controlling for demographic characteristics. With the exception of Filipino Americans, all subgroups had lower odds of obesity relative to non-Latino Whites when soda consumption was equal to zero (P<0·05). The soda consumption term in the model reveals that soda consumption was not associated with odds of obesity among non-Latino Whites (adjusted OR (AOR)=1·00; 95 % CI 0·99, 1·02). However, each additional time soda was consumed in a week was associated with increased odds of obesity among Chinese Americans (AOR=1·22; 95 % CI 1·09, 1·37), Korean Americans (AOR=1·21; 95 % CI 1·02, 1·46) and Other Asian Americans (AOR=1·19; 95 % CI 1·04, 1·39; these AOR are not shown in Table 2). Overall, there was a significant interaction between soda consumption and race/ethnicity (P=0·0118). Specifically, soda consumption had a larger obesogenic impact among Chinese-American, Korean-American and Other Asian-American groups, relative to non-Latino Whites (P<0·05). Female gender (AOR=0·73; 95 % CI 0·66, 0·80), each additional year of education (AOR=0·94; 95 % CI 0·92, 0·97) and each additional thousand US dollars in annual household income (AOR=1·00; 95 % CI 1·00, 1·00) were associated with lower odds of obesity. The HLGOF statistic showed that the model fit the data reasonably well (P=0·89).
Figure 1 visually depicts the findings from analyses shown in Table 2. Here we see that the predicted probability of obesity is fairly constant for most ethnic groups, irrespective of soda consumption. However, predicted probability of obesity increases with soda consumption for Chinese Americans, Korean Americans and Other Asian Americans.
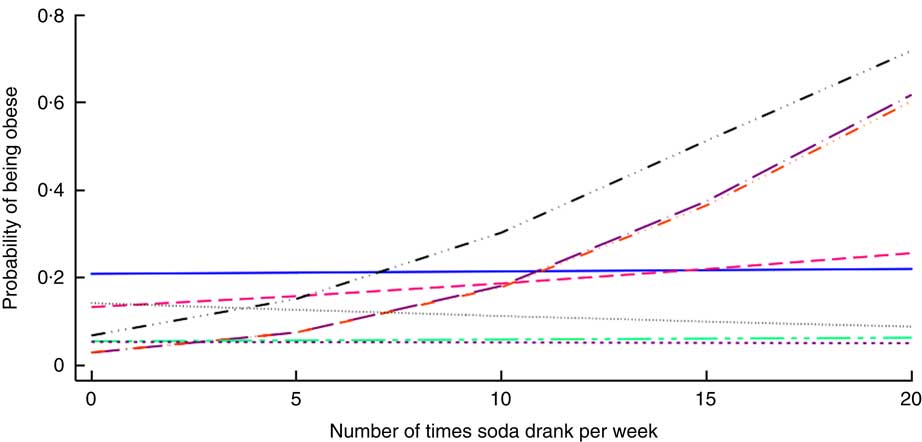
Fig. 1 (colour online) Predicted probability of obesity according to soda consumption and ethnicity (![]() , White;
, White; ![]() , Japanese American;
, Japanese American; ![]() , Filipino American;
, Filipino American; ![]() , Vietnamese American;
, Vietnamese American; ![]() , Chinese American;
, Chinese American; ![]() , Korean American;
, Korean American; ![]() , South Asian American;
, South Asian American; ![]() , Other Asian American) among non-institutionalized adults aged 18 years or over, California Health Interview Survey 2009 (n 36 271)
, Other Asian American) among non-institutionalized adults aged 18 years or over, California Health Interview Survey 2009 (n 36 271)
Relationship between soda consumption and odds of being obese by Asian subgroup and place of birth
Table 3 shows stratified logistic regression models predicting obesity from place of birth, obesity from soda consumption and the place of birth by soda consumption interaction, while controlling for demographic characteristics. Foreign-born Chinese Americans and Korean Americans had lower odds of obesity than their US-born counterparts when soda consumption was equal to zero (P<0·05). The soda consumption term in each model reveals that, among individuals born in the USA, each additional time soda was consumed in a week was associated with increased odds of obesity among Vietnamese Americans (AOR=1·22; 95 % CI 1·04, 1·44) and Other Asian Americans (AOR=1·44; 95 % CI 1·18, 1·76). Among individuals born outside the USA, each additional time soda was consumed in a week was associated with increased odds of obesity among Chinese Americans (AOR=1·27; 95 % CI 1·08, 1·48), Japanese Americans (AOR=1·15; 95 % CI 1·06, 1·25) and Korean Americans (AOR=1·81; 95 % CI 1·20, 2·74; these AOR are not shown in Table 3). There was a significant interaction between place of birth and soda consumption for Japanese Americans, Vietnamese Americans and Other Asian Americans (P<0·05). Specifically, there was a greater impact of soda consumption on the odds of being obese among foreign-born Japanese Americans in comparison to their US-born peers. Conversely, there was a smaller impact of soda consumption on obesity risk among foreign-born Vietnamese Americans and Other Asian Americans, relative to each group’s US-born counterparts. Across models, sociodemographic characteristics were not consistently associated with odds of being obese. Overall, the HLGOF statistics suggested that model fit was poor.
Discussion
In recent years, there has been growing interest in reducing consumption of SSB, or ‘empty liquid calories’( Reference Bleich, Wolfson and Vine 14 ), as a strategy for reducing obesity levels. The current study is one of the first, to the authors’ knowledge, that examines soda consumption among Asian-American subgroups and by place of birth in California, the state with the largest proportion of immigrants( 24 ). While we examined other SSB (i.e. energy/sports drinks and fruit-flavoured drinks), there were no significant interactions between Asian-American subgroups and SSB consumption when compared with Whites, suggesting that this relationship may be unique to soda.
Our findings are consistent with published literature, albeit limited, that obesity levels are lower among Asian Americans in comparison to Whites( Reference Guerrero, Ponce and Chung 19 , Reference Park, Wang and Kitahara 21 , Reference Wang and Beydoun 26 , Reference Wang, Quan and Kanaya 31 ). However, the disaggregation of the Asian-American category into national- and regional-origin subgroups helped elucidate the heterogeneity and disparities across groups. Namely, we found that Japanese-American respondents had the highest rates of obesity whereas Chinese Americans had the lowest. These findings, in conjunction with trends documenting increasing rates of obesity among Asian Americans( Reference Park, Wang and Kitahara 21 , Reference Lu, Diep and McKyer 32 ), emphasize the need for more obesity prevention efforts in these communities and the need to better understand and address the differences in health behaviours and trends within these groups( Reference Guerrero, Ponce and Chung 19 , Reference Park, Wang and Kitahara 21 , Reference Wang, Quan and Kanaya 31 ). While there are a number of potential factors driving differences between Asian Americans (i.e. fraction of foreign-born, obesity rates in home country, inhabiting enclaves in the USA and socio-economic differences), these effects cannot be teased apart in the present study because we do not know enough about the immigration experiences of respondents or the social and physical environments that they occupy in the USA.
With regard to soda intake, we found that levels are generally low and that all Asian-American subgroups, with the exception of Filipinos, reported drinking soda less often than Whites. This finding is consistent with a prior study that disaggregated Asian-American subgroups and found that Filipinos had a higher rate of engaging in obesity-related dietary risk factors than other subgroups( Reference Guerrero, Ponce and Chung 19 , Reference Park, Wang and Kitahara 21 , Reference Wang, Quan and Kanaya 31 ). That study( Reference Guerrero, Ponce and Chung 19 , Reference Park, Wang and Kitahara 21 , Reference Wang, Quan and Kanaya 31 ), however, focused on adolescents. Thus, the current study adds to the literature on obesity and disparities by focusing on variations in soda intake and across subgroups among Asian-American adults.
When we extended the analyses to look at this relationship in terms of the odds of being obese, our study highlighted the unique role soda may play in increasing disparities in obesity rates in Asian-American communities. Namely, the results demonstrated that for each additional time soda was consumed, there was an increased likelihood of being obese among some subgroups; a relationship that did not hold true among Whites. These results suggest that efforts to decrease soda consumption among Asian Americans may have more of an effect in reducing obesity rates than among Whites. Or stated differently, the lack of attention on soda consumption among Asian Americans is a missed opportunity to reduce current and prevent future increased levels of obesity. Moreover, the disaggregation of subgroups elucidated interesting differences. Namely, soda consumption among Chinese and Korean and Other Asian Americans had more of an impact on the odds of being obese, relative to Whites. These findings extend previous studies that found varying health behaviours across Asian-American subgroups( Reference Guerrero, Ponce and Chung 19 , Reference Maxwell, Crespi and Alano 20 ) by showing that behaviours can also have different impacts on health outcomes across subgroups.
Considering that Asians comprise the fastest-growing group of immigrants, another focus of our study was to delineate the effects of this relationship by respondent’s place of birth. Our findings, similar to other studies( Reference Guerrero, Ponce and Chung 19 – Reference Anda, Whitfield and Felitti 22 ), support the growing idea that immigrant health research must recognize that patterns are far from yielding a clear and consistent story( Reference Anda, Whitfield and Felitti 22 , Reference Takeuchi, Zane and Hong 33 ). For example, the odds of obesity were lower among foreign-born Chinese Americans and Korean Americans, relative to their US-born peers. This finding is supported by the negative acculturation effect positing that health behaviours and outcomes are better among foreign-born immigrants and deteriorate among subsequent generations including those born in the USA. However, the impact of soda consumption on obesity complicates this picture. Namely, soda consumption had a diminished obesogenic impact among foreign-born Vietnamese Americans and Other Asian Americans, relative to US-born respondents from those subgroups, while being foreign-born had an increased obsesogenic impact, relative to their US-born peers. In other words, the results support the call for a research agenda on immigrant health that recognizes the diverse cultural and political contexts immigrants originate from, as well as the heterogeneity of socio-economic and health profiles among immigrants from the same sending country that may help explain variation in health behaviours and health outcomes( Reference Anda, Whitfield and Felitti 22 , Reference Holland and Palaniappan 25 , Reference Takeuchi, Zane and Hong 33 , Reference Gee, Ro and Gavin 34 ).
These mixed findings are consistent with other studies and serve as preliminary analyses on a topic that merits future research efforts. Moreover, the lack of statistically significant differences within most of the subgroups by place of birth emphasizes the need for a more comprehensive approach towards studying immigrant health that takes into consideration trends in the sending contexts. For example, the nutrition transition, in which people are already adopting what is characterized as the ‘Western lifestyle’ within their own countries pre-migration( Reference Anda, Whitfield and Felitti 22 ), is one of many factors that may help explain the lack of consistent findings on dietary behaviours and obesity risk among groups in the USA.
Limitations
A limitation of the current study is the main measures of interest. Namely, soda intake and obesity are based on self-reported measures that may be biased. Also, the soda measure does not capture the servings consumed, thereby undermining our ability to ascertain the actual energy content being consumed. However, the authors used this measure as has been done in published studies( Reference Babey, Jones and Yu 7 , Reference Kumar, Pan and Park 17 ). In addition, the current study is cross-sectional and therefore cannot infer causality between the two main variables of interest. Moreover, one may also argue that the relationship is one of reverse causality, namely that obesity increases one’s likelihood of drinking more soda. Although the study advances the literature on obesity risk factors among an understudied population, CHIS does not provide subgroup information for all Asian ethnicities or subgroups in their public-use file. Also, some of these groups are too small to analyse independently. An example of this is the ‘Other Asian’ group, which includes many smaller Asian-American subgroups and those who identify with more than one Asian-American subgroup. As a result, conclusions and generalizations about this group cannot be made. Furthermore, the CHIS does not collect data in all Asian languages, rendering it less representative of some Asian-American subgroups. Also, while the HLGOF has limitations when examining rare outcomes( Reference Hosmer, Lemeshow and Klar 35 ) (outcome occurs less than 10 % of the time), the results of the HLGOF test showed that analyses in Table 3 did not fit the data particularly well. As a result, these findings should be interpreted cautiously. Lastly, CHIS is representative of the adult population in California; therefore the authors caution readers from extrapolating the findings to Asian-American subgroups in other states.
Conclusion
Albeit limited, the current study echoes the mixed findings reported elsewhere when Asian subgroups are disaggregated( Reference Guerrero, Ponce and Chung 19 – Reference Anda, Whitfield and Felitti 22 ). The limited body of knowledge on this topic undermines our ability to contextualize our findings. Therefore it is our hope that the present study will motivate future research on health behaviours and outcomes to further pursue the disaggregation of Asian-American subgroups, as others have called for( Reference Chen, Diamant and Kagawa-Singer 36 ), thereby acknowledging the different experiences, norms, behaviours and socio-economic profiles among immigrant groups( Reference Anda, Whitfield and Felitti 22 ). These are crucial steps for advancing our understanding and approaches in immigrant and disparities research.
In addition, the findings of the study identify soda consumption as a risk factor that may be contributing to the increasing rates of obesity among some Asian-American subgroups. Moreover, the results identify certain subgroups at a higher risk of obesity via soda consumption. The current study underscores the need for more focused multilevel public health efforts, including health education, social marketing and improving the built environment, to reduce the level of soda consumption in Asian-American communities.
Acknowledgements
Financial support: This research was made possible by support from the National Center for Advancing Translational Sciences (NIH NCATS; grant number UL1 TR001415). Funders played no role in study design, analyses or interpretation of data. Conflict of interest: Neither author has financial or other conflicts of interests to disclose. Authorship: Both authors contributed equally to this manuscript as follows: H.E.A. led the conceptualization of the study, execution of analyses and writing of results. M.Z.S. led the writing of background and conclusions. Both authors approved this manuscript. Ethics of human subject participation: This study involved secondary data analyses of de-identified information, thus it did not meet the definition of human subjects research.


