Skip to main content Accessibility help
×
Hostname: page-component-848d4c4894-x5gtn Total loading time: 0 Render date: 2024-05-19T04:36:47.464Z Has data issue: false hasContentIssue false

31 - Visualizing Scientific Data

from General Methods

Published online by Cambridge University Press:  27 January 2017

John T. Cacioppo
Affiliation:
University of Chicago
Louis G. Tassinary
Affiliation:
Texas A & M University
Gary G. Berntson
Affiliation:
Ohio State University
Get access

Summary

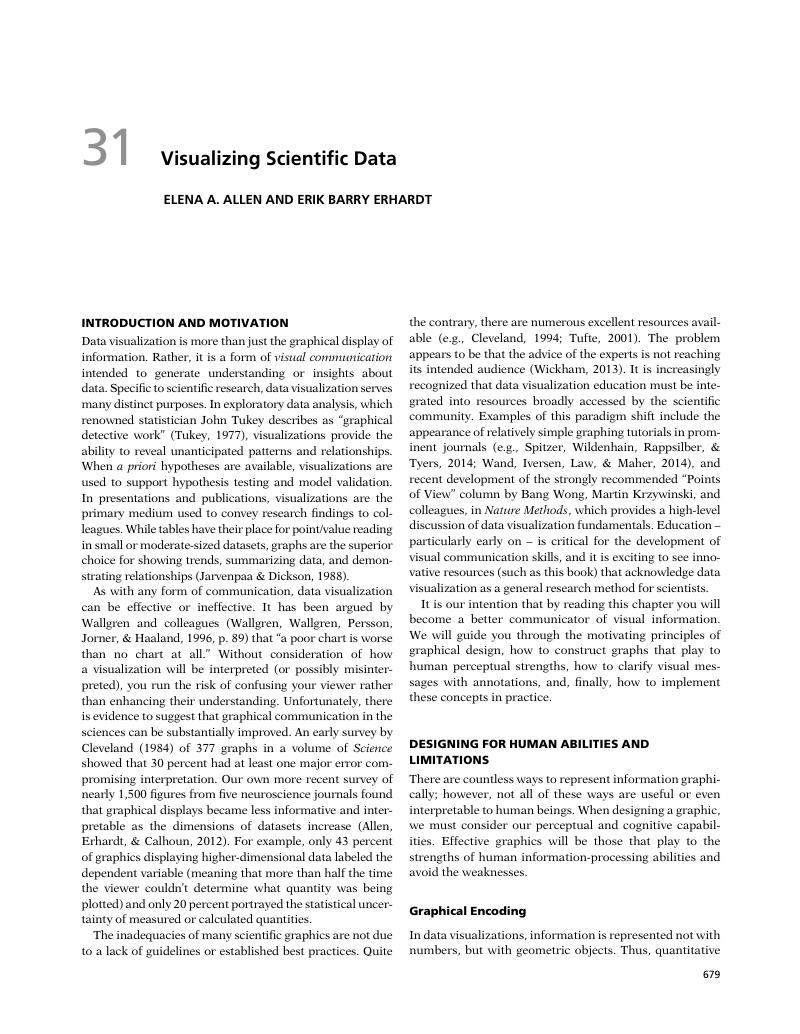
Image of the first page of this content. For PDF version, please use the ‘Save PDF’ preceeding this image.'
Type
Chapter
Information
Publisher: Cambridge University Press
Print publication year: 2016

Access options

Get access to the full version of this content by using one of the access options below. (Log in options will check for institutional or personal access. Content may require purchase if you do not have access.)

References

Albers, J. (1975). Interaction of Color. New Haven, CT: Yale University Press.Google Scholar
Allen, E. A., Erhardt, E. B., & Calhoun, V. D. (2012). Data visualization in the neurosciences: overcoming the curse of dimensionality. Neuron, 74: 603608.Google Scholar
Baird, J. C. (1970a). A cognitive theory of psychophysics I. Scandinavian Journal of Psychology, 11: 3546.Google Scholar
Baird, J. C. (1970b). A cognitive theory of psychophysics II. Scandinavian Journal of Psychology, 11: 89102.CrossRefGoogle ScholarPubMed
Belia, S., Fidler, F., Williams, J., & Cumming, G. (2005). Researchers misunderstand confidence intervals and standard error bars. Psychological Methods, 10: 389396.Google Scholar
Brewer, C. A. (1994). Guidelines for use of the perceptual dimensions of color for mapping and visualization. In Proceedings of the International Society for Optical Engineering (SPIE), vol. 2171 (pp. 5463). San Jose: International Society for Optics and Photonics.Google Scholar
Buckner, R. L., Andrews-Hanna, J. R., & Schacter, D. L. (2008). The brain’s default network. Annals of the New York Academy of Sciences of the USA, 1124: 138.Google Scholar
Bullmore, E. & Sporns, O. (2009). Complex brain networks: graph theoretical analysis of structural and functional systems. Nature Reviews Neuroscience, 10: 186198.CrossRefGoogle ScholarPubMed
Chambers, J., Cleveland, W., Kleiner, B., & Tukey, P. (1983). Graphical Methods for Data Analysis. Belmont, CA: Wadsworth.Google Scholar
Chernoff, H. (1973). The use of faces to represent points in k-dimensional space graphically. Journal of the American Statistical Association, 68: 361368.Google Scholar
Cleveland, W. S. (1984). Graphs in scientific publications. The American Statistician, 38: 261269.Google Scholar
Cleveland, W. S. (1994). The Elements of Graphing Data, rev. edn. Summit, NJ: Hobart Press.Google Scholar
Cleveland, W. S., McGill, M. E., & McGill, R. (1988). The shape parameter of a two-variable graph. Journal of the American Statistical Association, 83: 289300.Google Scholar
Cleveland, W. S. & McGill, R. (1983). A color-caused optical illusion on a statistical graph. The American Statistician, 7: 101105.Google Scholar
Cleveland, W. S. & McGill, R. (1984). Graphical perception: theory, experimentation, and application to the development of graphical methods. Journal of the American Statistical Association, 79: 531554.CrossRefGoogle Scholar
Cleveland, W. S. & McGill, R. (1985). Graphical perception and graphical methods for analyzing scientific data. Science, 229: 828833.Google Scholar
Cowan, N. (2001). Metatheory of storage capacity limits. Behavioral and Brain Sciences, 24: 154176.Google Scholar
Cumming, G., Fidler, F., and Vaux, D. L. (2007). Error bars in experimental biology. The Journal of Cell Biology, 177(1): 711.Google Scholar
Cumming, G. & Finch, S. (2005). Inference by eye: confidence intervals and how to read pictures of data. American Psychologist, 60: 170180.Google Scholar
Eichele, H., Juvodden, H. T., Ullsperger, M., & Eichele, T. (2010). Mal-adaptation of event-related EEG responses preceding performance errors. Frontiers in Human Neuroscience, 4: 65.Google ScholarPubMed
Ellis, W. D. (1999). A Source Book of Gestalt Psychology, vol. 2. New York: Psychology Press.Google Scholar
Emerson, J. W., Green, W. A., Schloerke, B., Crowley, J., Cook, D., Hofmann, H., & Wickham, H. (2011). The generalized pairs plot. Journal of Computational and Graphical Statistics, 22: 7991.Google Scholar
Fechner, G. (1860). Elemente Der Psychophysik. Leipzig: Breitkopf & Härtel.Google Scholar
Feinberg, B. M. & Franklin, C. A. (1975). Social Graphics Bibliography. Washington, DC: Bureau of Social Science Research.Google Scholar
Feinberg, R. A. & Wainer, H. (2011). Extracting sunbeams from cucumbers. Journal of Computational and Graphical Statistics, 20: 793810.Google Scholar
Few, S. (2007). Save the pies for dessert. Visual Business Intelligence Newsletter, August.Google Scholar
Friendly, M. (2002). Corrgrams: exploratory displays for correlation matrices. The American Statistician, 56: 316324.CrossRefGoogle Scholar
Gehlenborg, N. & Wong, B. (2012). Points of view: into the third dimension. Nature Methods, 9: 851851.Google Scholar
Griethe, H. & Schumann, H. (2006). The visualization of uncertain data: methods and problems. In Proceedings of SimVis ’06 (pp. 143156). San Diego, CA: SCS Publishing House.Google Scholar
Habeck, C. & Moeller, J. R. (2011). Intrinsic functional-connectivity networks for diagnosis: just beautiful pictures? Brain Connectivity, 1: 99103.Google Scholar
Haemer, K. W. (1947a). Hold that line. The American Statistician, 1: 25.Google Scholar
Haemer, K. W. (1947b). The perils of perspective. The American Statistician, 1: 19.Google Scholar
Haemer, K. W. (1951). The pseudo third dimension. The American Statistician, 5: 28.Google Scholar
Harlow, L. L., Mulaik, S. A., & Steiger, J. H. (2013). What If There Were No Significance Tests? New York: Psychology Press.CrossRefGoogle Scholar
Heer, J. & Bostock, M. (2010). Crowdsourcing graphical perception: using mechanical turk to assess visualization design. In Proceedings of the SIGCHI Conference on Human Factors in Computing Systems (pp. 203212). New York: ACM.CrossRefGoogle Scholar
Hengl, T. (2003). Visualisation of uncertainty using the HSI colour model: computations with colours. In Proceedings of the 7th International Conference on GeoComputation (pp. 817). University of Southampton.Google Scholar
Hintze, J. L. & Nelson, R. D. (1998). Violin plots: a box plot-density trace synergism. The American Statistician, 52: 181184.Google Scholar
Hoekstra, R., Morey, R. D., Rouder, J. N., & Wagenmakers, E.-J. (2014). Robust misinterpretation of confidence intervals. Psychonomic Bulletin & Review, 21: 11571164.Google Scholar
Jarvenpaa, S. L. & Dickson, G. W. (1988). Graphics and managerial decision making: research-based guidelines. Communications of the ACM, 31: 764774.CrossRefGoogle Scholar
Kampstra, P. (2008). Beanplot: a boxplot alternative for visual comparison of distributions. Journal of Statistical Software, 28(1): 19.CrossRefGoogle Scholar
Kiehl, K. A., Laurens, K. R., Duty, T. L., Forster, B. B., & Liddle, P. F. (2001). Neural sources involved in auditory target detection and novelty processing: an event-related fMRI study. Psychophysiology, 38: 133142.Google Scholar
Kosslyn, S. M. (1985). Graphics and human information processing: a review of five books. Journal of the American Statistical Association, 80: 499512.Google Scholar
Krzywinski, M. (2013a). Points of view: axes, ticks and grids. Nature Methods, 10: 183.Google Scholar
Krzywinski, M. (2013b). Points of view: elements of visual style. Nature Methods, 10: 371.CrossRefGoogle ScholarPubMed
Krzywinski, M. & Altman, N. (2013). Points of significance: error bars. Nature Methods, 10: 921922.CrossRefGoogle ScholarPubMed
Krzywinski, M. & Wong, B. (2013). Points of view: plotting symbols. Nature Methods, 10: 451.Google Scholar
Lane, D. M. & Sándor, A. (2009). Designing better graphs by including distributional information and integrating words, numbers, and images. Psychological Methods, 14: 239257.CrossRefGoogle ScholarPubMed
Lewandowsky, S. & Spence, I. (1989). Discriminating strata in scatterplots. Journal of the American Statistical Association, 84: 682688.Google Scholar
Margulies, D. S., Böttger, J., Watanabe, A., & Gorgolewski, K. J. (2013). Visualizing the human connectome. NeuroImage, 80: 445461.Google Scholar
Moret-Tatay, C. & Perea, M. (2011). Do serifs provide an advantage in the recognition of written words? Journal of Cognitive Psychology, 23: 619624.Google Scholar
Munsell, A. H. (1947). A Color Notation, 12th edn. Baltimore, MD: Munsell Color Company.Google Scholar
Potter, K., Rosen, P., & Johnson, C. R. (2012). From quantification to visualization: a taxonomy of uncertainty visualization approaches. In Dienstfrey, A. M. & Boisvert, R. F. (eds.), Uncertainty Quantification in Scientific Computing (pp. 226249). New York: Springer.Google Scholar
Sammon, J. W. (1969). A nonlinear mapping for data structure analysis. IEEE Transactions on Computers, 18: 401409.Google Scholar
Schmid, C. F. (1983). Statistical Graphics: Design Principles and Practices. New York: John Wiley.Google Scholar
Spitzer, M., Wildenhain, J., Rappsilber, J., & Tyers, M. (2014). BoxPlotR: a web tool for generation of box plots. Nature Methods, 11: 121122.Google Scholar
Stevens, S. S. (1975). Psychophysics. Piscataway, NJ: Transaction Publishers.Google Scholar
Talbot, J., Gerth, J., & Hanrahan, P. (2012). An empirical model of slope ratio comparisons. IEEE Transactions on Visualization and Computer Graphics, 18: 26132620.Google Scholar
Tomasi, D. & Volkow, N. D. (2011). Association between functional connectivity hubs and brain networks. Cerebral Cortex, 21: 20032013.CrossRefGoogle ScholarPubMed
Tufte, E. R. (2001). The Visual Display of Quantitative Information, 2nd edn. Cheshire, CT: Graphics Press.Google Scholar
Tukey, J. (1977). Exploratory Data Analysis. Boston, MA: Addison-Wesley.Google Scholar
Van der Maaten, L. & Hinton, G. (2008). Visualizing data using t-SNE. Journal of Machine Learning Research, 9: 85.Google Scholar
Vaux, D. L. (2004). Error message. Nature, 428: 799.CrossRefGoogle ScholarPubMed
Wainer, H. (1984). How to display data badly. The American Statistician, 38: 137147.Google Scholar
Wainer, H. (1996). Depicting error. The American Statistician, 50: 101111.Google Scholar
Wainer, H. (2008). Visual revelations: improving graphic displays by controlling creativity. Chance, 21: 4652.Google Scholar
Wallgren, A., Wallgren, B., Persson, R., Jorner, U., & Haaland, J.-A. (1996). Graphing Statistics & Data: Creating Better Charts. Thousand Oaks, CA: Sage.Google Scholar
Wand, H., Iversen, J., Law, M., & Maher, L. (2014). Quilt plots: a simple tool for the visualisation of large epidemiological data. PloS One, 9: e85047.Google Scholar
Ward, M. O. (2008). Multivariate data glyphs: principles and practice. In Chen, C.-H., Härdle, W., & Unwin, A. (eds.), Handbook of Data Visualization (pp. 179198). Berlin: Springer.Google Scholar
Wickham, H. (2009). ggplot2: Elegant Graphics for Data Analysis. New York: Springer.CrossRefGoogle Scholar
Wickham, H. (2013). Graphical criticism: some historical notes. Journal of Computational and Graphical Statistics, 22: 3844.Google Scholar
Wilkinson, L. (2005). The Grammar of Graphics, 2nd edn. New York: Springer.Google Scholar
Wong, B. (2010a). Points of view: color coding. Nature Methods, 7: 573.Google Scholar
Wong, B. (2010b). Points of view: design of data figures. Nature Methods, 7: 665.Google Scholar
Wong, B. (2011a). Points of view: arrows. Nature Methods, 8: 701.Google Scholar
Wong, B. (2011b). Points of view: salience to relevance. Nature Methods, 8: 889.Google Scholar
Wong, B. (2011c). Points of view: simplify to clarify. Nature Methods, 8: 611.CrossRefGoogle Scholar
Wong, B. & Kjærgaard, R. S. (2012). Points of view: pencil and paper. Nature Methods, 9: 1037.Google Scholar

Save book to Kindle

To save this book to your Kindle, first ensure coreplatform@cambridge.org is added to your Approved Personal Document E-mail List under your Personal Document Settings on the Manage Your Content and Devices page of your Amazon account. Then enter the ‘name’ part of your Kindle email address below. Find out more about saving to your Kindle.

Note you can select to save to either the @free.kindle.com or @kindle.com variations. ‘@free.kindle.com’ emails are free but can only be saved to your device when it is connected to wi-fi. ‘@kindle.com’ emails can be delivered even when you are not connected to wi-fi, but note that service fees apply.

Find out more about the Kindle Personal Document Service.

Available formats
×

Save book to Dropbox

To save content items to your account, please confirm that you agree to abide by our usage policies. If this is the first time you use this feature, you will be asked to authorise Cambridge Core to connect with your account. Find out more about saving content to Dropbox.

Available formats
×

Save book to Google Drive

To save content items to your account, please confirm that you agree to abide by our usage policies. If this is the first time you use this feature, you will be asked to authorise Cambridge Core to connect with your account. Find out more about saving content to Google Drive.

Available formats
×