

Most centrally planned socialist economies in Eastern Europe imitated the tax system of the Soviet Union. Thus, all post-socialist states at the beginning of the transformation to market economies had poorly functioning tax administrations and falling ratios of tax revenues to Gross Domestic Product (GDP), as well as tax compliance problems.Footnote 1 Yet Poland, like a few other Central European states, moved sooner than the other post-communist states to reform its tax system and was able to raise adequate revenues throughout this period.Footnote 2 Poland was more effective than Russia and Ukraine in collecting taxes during the past quarter century.
Before discerning why that was the case, it is necessary to present how it was the case. Namely, it is necessary to begin by specifying as precisely as possible how well each country collects taxes. That is the main goal of this chapter. Before that, the chapter provides an overview of the structure of the tax regimes in Poland, Russia and Ukraine. At the beginning of the 1990s, Poland, Russia and Ukraine all introduced three new main taxes (the personal income tax (PIT), the corporate income tax (CIT) and the value-added tax (VAT)), allowing a great comparative study, as the three states were required to make dramatic institutional changes in the tax arena at exactly the same time. Finally, a further goal for this chapter is to analyze the use and limitations of economic explanations and tax rates to account for the diversity of tax revenue outcomes. In short, this chapter provides better understanding, context and measurement of the object of study, tax compliance.
Tax Regimes in Poland, Russia and Ukraine
The primary focus throughout this study is on the two direct income taxes, the PIT and the CIT, and the indirect VAT. These three taxes, non-existent in the communist era, are the main source of fiscal revenues for Central and Eastern Europe (CEE) and are the basis for taxation in the EU countries. Poland introduced the PIT and CIT on 1 January 1992 and the VAT on 5 July 1993. Meanwhile, Russia inherited a profits tax for enterprises from the Soviet era and introduced the PIT and VAT on 1 January 1992. (A 13 per cent flat rate for the PIT was introduced in Russia in January 2001.) And, in 1992, Ukraine introduced an enterprise income tax – which in the early years shifted back and forth between being a tax on profits and a tax on income and was later called the corporate income tax – and the value-added tax, which functioned as a sort of turnover tax until 1997. A PIT with progressive tax rates was introduced in Ukraine in 1992, while a flat PIT rate of 13 per cent was introduced in 2004, which was increased to 15 per cent in 2007, before a second higher rate of 17 per cent was introduced in 2011. The second rate for Ukraine's PIT increased to 20 per cent in 2015, and the rate changed to a flat 18 per cent in 2016.
In his analysis of key conceptual and measurement issues raised by cross-national taxation studies in political science, Evan Lieberman finds that taxes on income and profits (and on capital gains), often grouped together under the label of ‘direct taxes’, are well suited for comparing state capacity because they ‘reflect levels of state–society and intra-society coordination and cooperation’Footnote 3:
Most analysts would probably agree that the ‘purest’ form of taxation includes those taxes levied on income, profits and capital gains. Such taxes are paid over to the state directly by individuals and firms, often with graduated rates for different levels of income. Political scientists studying taxation have tended to develop indicators based on the standard assumption that these taxes have the qualities of being among the most progressive, most difficult to administer, most transparent, and least requited of any government revenue streams. As a result…higher levels of income tax collections are generally associated with greater levels of capacity…Footnote 4
Hence, if two different states are found to extract similar amounts of income and profits from similar-sized and similarly wealthy tax groups, then the states can be said to be similar in their capacities to extract revenue, provided that the two tax groups behave and respond similarly to their respective states’ tax authorities.
CIT, often referred in Russia and Ukraine as the profits tax, and PIT require significant administrative work, as they affect many more taxpayers and hence involve greater ‘penetration of society’ than other, more ‘indirect’ consumption taxes, such as the VAT and other sales and excise taxes. In Poland, the PIT affects all individuals who are employed or earn income (except for some farmers), whereas in Russia and Ukraine, after the adoption of the flat rate for the PIT in 2001 and in 2004, respectively, most individuals let their employers pay their taxes for them. Out of a population of 39 million, the number of Poles who paid taxes was around 23 or 24 million throughout most of the 1990s, whereas 17.25 million taxpayers paid PIT in 2014.Footnote 5 In Russia, out of a population of approximately 145 million, 105 million individuals were on the tax administration's lists in 2003.Footnote 6 In Ukraine, about 20 million individuals, out of a population of roughly 47 million, were deemed to be taxpayers in 2006 and 13.87 million were deemed to be PIT taxpayers in 2014.Footnote 7
Domestic consumption taxes, which include the VAT and other sales and excise taxes, are generally paid by a limited group of retailers and manufacturers that are fewer in number than the individuals on a state's income tax rolls. However, the burden of such consumption taxes is usually carried by consumers in the form of higher prices for goods and services. With respect to analytical constructs such as state capacity, Lieberman states that such ‘indirect’ taxes are considered to be less complex for bureaucracies than the first group of taxes, but still require functioning and capable tax administrations. ‘Taxes on consumption’, he writes, ‘…tend to be easier to collect than taxes on income because they are collected indirectly, incrementally, and generally at the point of purchase.’Footnote 8
Nevertheless, within the post-communist environment, the VAT tax is a particularly tricky tax to implement and administer due to the rise in the number of fictitious firms, which try to claim a VAT refund for non-existent sales. Hence, by choosing to focus on the PIT, the CIT and the VAT consumption tax when undertaking field research on how tax laws are implemented by bureaucrats in Poland, Russia and Ukraine (as will be shown in Chapter 5), a somewhat easier tax to collect can be compared with the more difficult income taxes so that a more complete range of administrative capabilities can be analyzed in these three states.
Taxation in the Command Economy
In the early 1990s, unlike Poland, both Russia and Ukraine adapted and adjusted Soviet-era tax laws, seeking to operate within – rather than to replace – the existing legal framework.Footnote 9 Under state socialism, the economy in both Poland and the Soviet Union was based on a narrow revenue stream, emanating from a relatively small number of large, state-run enterprises.Footnote 10 Taxes in the command economy were, basically, transfers from the public enterprise sector to the state itself. ‘The planning office set wages and prices at levels that would generate surpluses in the public enterprises’, writes Vito Tanzi, who attended the first International Monetary Fund (IMF) mission to Russia in 1991. ‘Since there were no “parametric” or objective tax rates stated in tax laws, most of the transfers were the result of negotiations between the managers of the enterprises and officials from what was called the tax administration. Thus, these taxes were largely arbitrary. They often reflected administrative or bureaucratic decisions, not legislation.’Footnote 11
The nature of these taxes, then, did not require that the communists develop a large tax administration. ‘In the pre-reform system most revenues were simply transferred to the budget through the debiting of enterprise accounts at the state bank’, Barry W. Ickes and Joel Slemrod comment. ‘Hence there was little need for tax administration. Indeed, by the 1960's the Soviet tax administration system was dismantled and its functions carried out by the Ministry of Finance. A separate tax inspectorate was set up in the Ministry of Finance only in July of 1990. Hence tax administration in the Soviet Union (and by extension other reforming socialist economies) is rather undeveloped.’Footnote 12 For Poland as well as for Russia and Ukraine, then, implementing, adopting and adjusting to new forms of taxes in the early 1990s required the building of a new tax administration system, nearly from scratch.
Poland's Tax Regime
In Poland, the most important taxes are administered at the national level and include, as mentioned above, the CIT, the PIT and the VAT – listed in order of increasing importance to the Polish state budget. Social security contributions, shared by employers and employees, also compose an important revenue stream. The PIT is subject to a progressive income tax, and from 2014, two different tax rates on income apply – 18 and 32 per cent with a threshold of 85,528 Polish złoty (PLN) for the higher rate. Rates have varied over the years, with the top PIT rate as high as 45 per cent in 1995–1996.Footnote 13 Also, in 2014, the CIT was reduced from 40 per cent (its highest since the mid-1990s) to 19 per cent.Footnote 14 The VAT has had a top rate of either 22 or 23 per cent since its introduction in 1993. Other taxes include the tonnage tax, inheritance and donation tax, tax on civil law transactions, agricultural tax, forest tax, real property tax, transport vehicles tax, taxes on the extraction of certain minerals, excise duties and gambling tax.Footnote 15
Political Origins of Poland's Tax Regime
Given the narrow tax base inherited from the command economy, Poland, according to Gerald M. Easter, sought a social pact with labour in order to shift the tax burden from state-run industrial enterprises that were dependent on the state for financing to worker households through the introduction of a new PIT.Footnote 16
In many ways, the public battle over the popiwek – the Polish tax on excess wages established in order to enforce wage ceilings on public sector workers – laid the groundwork for the introduction of the PIT. ‘The implementation of the new tax was facilitated by certain compromises entailed in this social pact’, continues Easter. ‘First, with the establishment of the Tripartite Commission [composed of the government, management, and the trade unions], labour was accorded a formal means for participation in the wage policy process. Second, as part of the bargain, workers’ wages would keep pace with inflation. As the personal income tax went into effect, wages were raised to offset an immediate adverse impact on worker households. Finally, in March 1994, the popiwek was abandoned by the government.’Footnote 17 In short, due to a combination of unproductive state firms, an unpopular tax on wage ceilings and political negotiations that included both firm managers and workers, the PIT emerged in Poland as a major revenue source for the state, second only to the VAT.
Russia's Tax Regime
During the Yeltsin years, when regions sought greater autonomy, the number of taxes across Russia began to mushroom. By 1999, there were ‘about 30 separate federal taxes and over 170 local and regional taxes’.Footnote 18 Nevertheless, the most important taxes in Russia have been administered at the national level and include the PIT, the CIT, the VAT and the Natural Resource Extractment Tax (NDPI), or the Mineral Extraction Tax (MET), with the largest source of federal tax revenue varying by year between the CIT, the VAT and the NDPI. Until 2001, the PIT was a progressive income tax, with the top marginal rate from 1993–1998 being 35 per cent even as most Russians paid the lower 12 per cent marginal rate. Since 2001, Russia has had a flat personal income tax rate of 13 per cent. The CIT has had different rates over the years, with a high rate of 43 per cent in 2001. Since 2009, the rate for the CIT has been 20 per cent.Footnote 19 While the VAT's standard rate was cut in January 1993 from 28 to 20 per cent, the top rate has been 18 per cent since 2004.Footnote 20 Together with excise taxes, the VAT, the CIT and the PIT composed roughly three-quarters of total tax collections in the consolidated budget in the 1990s.Footnote 21 Excise taxes, tariffs and mineral taxes, which function like royalties, also have been strong sources of revenue.Footnote 22
As for how these laws are perceived by the tax collectors themselves, even a good number of Russian tax officials think that their country's tax laws are unfair. According to the 2011 Russian Public Officials’ Survey, 18 per cent stated that the tax laws are not fair, with a further 10 per cent refusing to say (Appendix I, Question #26.)
According to Michael Alexeev and Robert F. Conrad, the tax system in Russia has been deemed to work well largely because the tax administration makes it difficult for exporters to obtain VAT refunds and because of overtaxation of the oil and gas sector, estimates of the revenue share of which range from 35 to 60 per cent once CIT, VAT, mineral extraction charges and export taxes, among others, are added up.Footnote 23
Political Origins of Russia's Tax Regime
In the early 1990s, Russia needed to construct a new tax system that would obtain revenue from the newly privatized sectors of the economy. To do so, it relied on elite bargaining with the owners of a very narrow, but quite profitable and identifiable revenue base of the new economy – the large-scale extractive industries involved in exporting commodities, including the oil and gas firms and companies involved in minerals and metals, which had recently broken off from the state itself, had benefited from Russia's concentrated economy and profited from the loans-for-shares program, and were well known to the tax authorities. ‘Elite bargaining was a hybrid system of revenue extraction that combined the new conditions of the transition economy with practices familiar to the command economy’, writes Easter. ‘It rested on a complex web of informal elite ties stretching across political and economic spheres and from centre to regions.’Footnote 24 Similarly, Pauline Jones Luong and Erika Weinthal argue that after the 1998 financial crisis, the interests of government and the large oil firms coincided, making reforms on oil-sector-specific taxes and profits taxes possible.Footnote 25
Such elite bargaining with respect to this small, but profitable and unique-to-Russia sector of the economy led to a heavy burden for the selected few companies. This has led Scott Gehlbach to conclude that the structure of Russia's taxation helps to explain the form of capitalism that has developed. ‘With the focus in the former Soviet Union on a number of key revenue sources, tax authorities never learned to extract revenues from other sorts of enterprises or from individuals’, writes Gehlbach. ‘As a consequence, politicians…were led to promote those sectors that they knew would produce tax revenue, at the expense of those that would not. In contrast, in Eastern Europe – where tax systems had been structured to cast the revenue net more widely – there were fewer such perverse incentives.’Footnote 26 Unsurprisingly, with the state invested in such a focused sector of the economy, tax arrears from the energy sector were more accepted by the state. ‘[T]he state would tolerate tax arrears so long as the energy sector continued to supply even delinquent customers, thus preventing too rapid a collapse of key employment-providing enterprises and service-providing public-sector organizations’, write Andrei Shleifer and Daniel Treisman. ‘Of the growth in budget arrears in [the mid-1990s], more than 90 per cent reportedly resulted from state-sanctioned exemptions.’Footnote 27
In addition to the firms involved in exported extracted commodities, the regional governments, which gained powers in the 1990s from Russia's dysfunctional federalism, also were involved in the elite bargaining process, which influenced Russia's tax structure for decades to come. Regional governments united with the large-scale extractive industries ‘to undermine reformers’ attempts to restructure the tax system in ways that would have improved incentives for growth and tax collection’, continue Shleifer and Treisman. ‘…Large enterprises and regional governments also colluded to weaken the collection of federal taxes and thus keep more resources in the regions. Their strategies involved diverting a growing share of economic activity into the unofficial economy and increasingly turning to nonmonetary means of payment.’Footnote 28 As a result, just as the state had tolerated arrears by some large firms, the federal government in the 1990s tolerated tax withholding (or allocated larger transfers) to the regions that threatened to declare sovereignty, stage strikes or vote for the opposition.Footnote 29
The 1998 financial crisis, however, brought unity to the large-scale extractive industries and the government, setting the stage for the major tax reforms of 2000 and 2001, which, under President Vladimir Putin, brought forth the 13 per cent flat PIT and the unified social tax (UST), replacing various social contributions; reform of the VAT; and a decrease in the CIT rate and in the dividend tax rate. Assisting in these reforms was former Prime Minister Yegor Gaidar's Institute for the Economy in Transition.Footnote 30
Ukraine's Tax Regime
As in its neighbours, the most important taxes administered in Ukraine are the PIT, the CIT and the VAT, in reverse order of significance to the state budget. The PIT rate has been less stable than in Russia. Since January 2016, the PIT rate has been set at a flat 18 per cent for all salaries regardless of amount. Just prior to this, the PIT rate was tied to the amount of personal income, with a rate of 15 per cent applied if income did not exceed ten times a minimum monthly salary or 20 per cent for income in excess of that amount.Footnote 31 Up until 2003, the PIT was a progressive tax, but, from 2004 to 2010, a flat rate of 13 per cent (as in Russia) and, from 2007 to 2010, a flat rate of 15 per cent applied. Since August 2014, as a response to the war against Russia in the Donbas region, a temporary military tax of 1.5 per cent of taxable income has been introduced for all those who pay a tax on their personal income.Footnote 32 Social security contributions have been shared by employers and employees, but since January 2016, employers are deemed fully responsible for paying a 22 per cent tax on salaries – significantly down from rates that had earlier ranged from 36.76 to 49.70 per cent.Footnote 33
Since the late 1990s, the CIT rate in Ukraine has been slowly dropping from a high of 30 per cent to a current level of 18 per cent, and the VAT has had a top rate of 20 per cent.Footnote 34 Other taxes include excise taxes, vehicle ownership tax, real estate tax, rent tax, fixed agriculture tax and the simplified small business tax.Footnote 35 The last, which since its introduction in 1998 has played an important role in Ukraine due to its low rate and due to the ease with which individuals have been able to switch their employment status from employee to ‘independent’ consultant while still working for the same firm, applies to individual entrepreneurs and legal entities whose annual income does not exceed 5 million Ukrainian hryvnia (approximately U.S.$200,000 in mid-2016) – down significantly in 2016 from a previous income of 20 million Ukrainian hryvnia. From 2016, the rate for this simplified system has increased to 3 per cent for VAT payers and to 5 per cent for non-VAT payers.Footnote 36
Political Origins of Ukraine's Tax Regime
Whereas the 1990s debate over the tax regime in Russia was resolved in the early 2000s, just as Putin ascended to office, the process for Ukraine took even longer and occurred in an even more fragmented manner. Not until late 2010 was a tax code adopted in Ukraine. Much of the delay likely is due to the ‘unholy alliance between an executive interested in possibilities for selective enforcement, oligarchs interested in a system with privileges rather than a level playing field, and a Communist Party opposed to a market economy’ that emerged in the 1990s and continued, more or less, up to the EuroMaidan Revolution.Footnote 37
Emblematic of the uncertainty and discord among policy makers in the 1990s was perhaps the VAT tax, which constantly changed in that decade with respect to rates, tax base and exemptions. ‘In 1999, Serhyi Teriokhin, head of the tax and customs subcommittee of the Verkhovna Rada [Ukraine's parliament]’, writes Verena Fritz, ‘estimated that “since independence, Ukraine […] has revised its value-added tax rules more than 200 times.”’Footnote 38 Similarly, the Razumkov Centre tracked the number of regulatory acts that define all tax payment procedures as adopted each year in the 1990sFootnote 39:
| 1991 | 1992 | 1993 | 1994 | 1995 | 1996 | 1997 | 1998 | 1999 |
|---|---|---|---|---|---|---|---|---|
| 21 | 31 | 103 | 142 | 291 | 329 | 436 | 664 | 500 |
The dramatic increases in regulations by the end of the decade surely must have bewildered accountants and state tax employees alike!
Ukraine's adoption in March 2003 of the flat personal income tax, two years after Russia's, came under a ‘For a United Ukraine’ coalition government with few right-wing members, veering from an East European pattern in which right-wing governments sought the adoption of the flat tax. Hilary Appel has argued that the passage of the flat tax largely was due to ‘economically liberal politicians’ who held powerful positions in the Rada, including Teriokhin, who claimed that the new flat tax rate would bring in more taxpayers and reduce the shadow economy.’Footnote 40
Under President Viktor Yanukovych, in December 2010, Ukraine at last adopted a tax code, which sought to define the status, rights and responsibilities of the taxpayers and of the tax administration structures. Coming into force in January 2011, the tax code since has seen multiple changes incorporated into it. Among other things, the code abolished the simplified tax for small business entrepreneurs, forcing at least one million to close shop in the first year, while enabling easier transfer pricing, which benefited larger businesses by enabling them to transfer their profits abroad without paying any tax.Footnote 41 In subsequent amendments, after significant protests by thousands of small entrepreneurs in Kyiv,Footnote 42 the popular simplified taxation was brought back into the code.
Since the EuroMaidan Revolution, Ukraine's new wave of Rada deputies and politicians have been trying to reform the country's tax legislation, largely in order to broaden the tax base and to simplify the administration of tax collection, as well as to lower rates in order to appeal for public support for the post-Yanukovych reform process and bring more income out of the shadow economy.Footnote 43 (Broadly speaking, though, these long-unfulfilled objectives have remained the same in Ukraine since the debate over tax reform began in the mid-1990s.)
At the same time, policy-making with respect to taxation is a multi-institutional process in Ukraine, usually forcing the Rada deputies to depend upon other state agencies that serve as the primary authors of draft tax legislation. In February 2015, Andrei V. Zhurzhiy, first deputy chair of the tax committee within the Rada and a new MP since 2014, remarked that he did not consider the package of tax reforms passed in late December 2014 to be true reforms, as they had been prepared by the Ministry of Finance and the tax administration and did not reach MPs in sufficient time to review, let along make changes. New tax laws needed to be passed before a new year began so that businesses could begin to operate under them. Such a late arrival of the draft legislation on deputies’ desks was quite a revelation for the former businessman.Footnote 44 A year later, on the eve of 2016, a compromise was found between the Ministry of Finance's first draft and one prepared by the Rada Committee on Taxation and Customs Policy, headed by Nina Iuzhanina.Footnote 45
International Tax Assistance for Poland, Russia and Ukraine
In creating their tax systems, Poland, Russia and Ukraine each had different reactions to the tax system reform advice they received from abroad. The type of tax system constructed reflected the type of economy envisaged.
From the very start of the transition, Poland, Russia and Ukraine all faced international pressures to get their fiscal houses in order, but also received technical and financial aid from abroad. In addition to the foreign aid programs of the United States, the European Union and other foreign governments, coupled with the advice of academics and global think tanks, particular key roles in the tax reform process were played by the International Monetary Fund (IMF) and World Bank.Footnote 46 In the early 1990s, Poland, for one, had a tremendous foreign debt inherited from the Polish People's Republic (PRL) and needed the Bank and the IMF, which provided loans that came with conditions for all three states. ‘Over the following years, the IMF's Fiscal Affairs Department would play an important role in tax policy and tax administration in Russia’, writes Vito Tanzi in his biography. ‘During the decade of transition, the department would help Russia establish a new tax system and a true tax administration. But it would take several years and a lot of hard work on the part of many staff missions.’Footnote 47 The World Bank also sponsored Tax Administration Modernisation Projects (TAMPs) in Russia and Ukraine, described in greater detail in the next chapter.
The Organisation for Economic Co-operation and Development (OECD) was active from the beginning of the transition as well, with training of tax officials.Footnote 48 The OECD also worked with Russia during the enactment of its tax code in the late 1990s and early 2000s to ensure that the legislation would coordinate with international standards.Footnote 49 (Similarly, by 1999, with the work on the code, Tanzi remarked, ‘things were finally going much better than in previous years and…for the first time, the Russians were listening to the advice received [from the IMF] and there were concrete signs of progress’.Footnote 50)
In terms of following the advice offered from abroad, most of the transition countries closely followed guidance on changing tax policy – and most followed suit with legislation, but many ignored changing their tax administrations and incorporating more established western accounting practices.Footnote 51 Poland (along with the Czech Republic, Hungary, Slovenia, and the Baltics) acted quickly on foreign advice and introduced comprehensive reform almost immediately, while there was less broad consensual support for tax reform in countries such as Russia and Ukraine, enabling vested interests to block reforms.Footnote 52
Easter describes three waves of tax reform in Central and Eastern Europe: A first wave of capitalist-style tax reforms that accompanied the macro structural reforms of the early 1990s that was assisted by Western economic advisors was followed, for those EU accession countries like Poland, by a second wave in which indirect sales taxes (the VAT) were aligned with those in the rest of the European marketplace. (VAT, of course, became the indirect tax of choice not just for those states aspiring to join the European Union but also for the other transition states as well.) A third wave, caused by the transition economies’ low tax morale, weak tax administration and poor economic capitalization, followed in the 2000s with the arrival of the flat-tax and other rate-cutting reforms of personal and corporate direct income taxes.Footnote 53 (While Poland did not adopt the flat PIT tax as did its neighbours Russia and Ukraine, it did lower its direct tax rates during this period.) In short, the first wave involved Western advisors, especially from the IMF; the second involved the European Union; and the third originated from learning and copying other Central and Eastern European states in the region – as flat taxes became an Eastern European rather than a Western European phenomenon.
The IMF's influence, especially in the first wave, was greater with respect to tax policy, macroeconomic and technical issues than it was with respect to providing practical advice on structural and institutional reforms. Getting advice accepted in 1990s Russia, though, was difficult, in part due to the fact that many Russians felt it to be ‘humiliating’ to ask the IMF for loans.Footnote 54 The IMF's activities in the 1990s – such as technical assistance, posting a senior tax administration expert at the State Tax Service, and setting targets for revenue collection as conditions for loan disbursements – failed to have much of an impact on revenues in Russia.Footnote 55 However, with the drafting and adoption of the new tax code, the IMF's influence grew. ‘In the case of tax policy reform’, writes John Odling-Smee, ‘major changes did not come until 2001 under President Putin. The seeds of some components of this reform had been sown earlier, partly by the IMF and other technical assistance advisors. The IMF staff had opposed other components, however, notably the move to a flat rate personal income tax, which, although desirable on structural grounds, had seemed to the staff to carry the risk of a temporary loss of revenue.’Footnote 56
With respect to the influence of the European Union, particularly with regard to Easter's second wave, the evidence is mixed. To start with, Poland was not the only CEE state to join the European Union in 2004. Seven other states did as well, all with varying levels of tax arrears and fiscal imbalances. Revelations that the prime minister had lied about fiscal imbalances led Hungarians to protest in 2006, while Bulgaria and Slovakia – states that held high enthusiasm for EU accession – had difficult tax problems. In some ways, what entrant states can do is narrowed by the process of EU integration, and states cannot do what citizens want them to do. On the other hand, getting into the European Union does not provide states with any more incentives to collect more taxes in and of itself, especially if the European Union is to provide subsidies.
Appel argues, with respect to the second wave of indirect sales tax reforms, that the European Union maintained a strong influence on Poland and the other EU accession countries through the exertion of international leverage supporting once-stalled tax reforms. ‘Their tax laws had to be harmonized with existing EU law, and all areas of indirect taxes had to follow the acquis communautaire, the body of EU law whose adoption was required for membership’, writes Appel. ‘…In practice this meant that the East Europeans imported their consumption tax regime from abroad with virtually no concessions to domestic groups. Since consumption taxes generate the largest portion of tax revenue, the loss of control over taxation was enormous.’Footnote 57
Easter, on the other hand, maintains that the EU-directed reforms were delayed, incomplete and partially successful and that domestic political and structural constraints were just as determinative in the formation of the post-communist tax regimes. ‘Even in the case when international leverage was at its highest (EU accession reform)’, states Easter, ‘domestic political considerations (rooted in revenue bargains) prompted post-communist governments to resist, delay and renegotiate particular features of the tax policy reform. In the end, the European Commission acquiesced to an incomplete tax harmonization at the point when membership was conferred on the post-communist candidates.’Footnote 58 Appel, for her part, does agree that domestic politics was decisive with respect to the development of and approach to taxing personal income in Central and Eastern Europe.Footnote 59
In short, throughout the transition, all of the transition states benefited from advice and assistance from abroad in constructing their tax systems, but the extent to which such foreign input mattered is mixed, piecemeal and contested. For the most part, foreign assistance offered to all three of these states was greatest in the 1990s and into the early 2000s. Ukraine, though, received assistance for a more prolonged period of time, and as will be explored in Chapter 8, some of that advice has been forthcoming more recently, with the re-launch of reforms after the 2014 EuroMaidan Revolution.
Measuring Tax Compliance in Poland, Russia and Ukraine
Throughout the transition to a market economy, Poland was shown to be consistently able to extract revenue, though it did fall short of its goals at times and had significant (but not incapacitating) tax arrears. Meanwhile, data from Russia and Ukraine are more erratic, but show tax collection to be poor throughout most of the 1990s with some improvement after 2000.
Extractive capacity, measured in terms of tax extraction, is the most commonly used measure of a state's capacity.Footnote 60 However, obtaining measures for the ability to collect taxes – especially in a series over time that is comparable across countries – is not easy. One of the most frequent methods of reporting tax revenue statistics is to present the amount of revenue collected as a percentage of national income, usually the country's GDP.Footnote 61 In his review of different methodologies for analysing states’ tax income, Lieberman explains that tax collection data are often presented in this manner ‘because analysts implicitly agree that the problem or challenge for states is to collect a portion of the total economy in tax revenues, and that opportunities and constraints on taxation for policy-makers and the bureaucracy are ultimately determined by the size of the economy’.Footnote 62
However, presenting tax collection data as a percentage of GDP does have some limitations – especially if the focus of concern is assessment of a state's capacity to tax. First, as Lieberman has observed, displaying data in this way assumes that no matter what the size of the economy actually is, the collection of a certain percentage of a country's national income would imply that the effort was just as difficult as if a similar percentage in GDP terms was collected from a country with markedly different national income. ‘By looking at income tax collections as a share of GDP’, Lieberman writes, ‘the measure controls for the relative size of the economy, but assumes that the challenge of collecting direct taxes from any economy is basically the same problem.’Footnote 63 In other words, the task of collecting taxes may be far more challenging for a new nation embarking on the task of state-building than for a more established state with a much larger economy. The size of the wealth and how it is distributed in society might be significant as well.
In addition, while readily available for cross-national purposes, such ‘taxes collected as a percentage of GDP’ data do not account for the actual tax rates and expected tax levels. Some states do, in fact, have significantly lower tax rates than others, but this may not imply that such states are less capable of raising revenue that they want or need. ‘There is a difference between extractive potential and actual extraction rates’, writes Francis Fukuyama. ‘Actual tax rates are set not just by extractive potential, but by policy choices regarding the optimal rate and types of taxation.’Footnote 64 The fact that the United States collected more tax revenue during the two World Wars than before or after reflects differences in policy preferences as to what the size of government should be during times of war and peace. Moreover, some governments have better or worse perceptions of their own societies, including how they envision wealth and income to be distributed. As Alexeev and Conrad also remark, ‘the fact that a country collecting significant tax revenue is not necessarily evidence of the tax system efficiency or even effectiveness of tax administration. This is because tax effort [taxes as a share of GDP] regressions do not include either a measure of statutory tax burden or a measure of welfare loss associated with tax collections. That is, a country with a very efficient tax system and tax administration might be characterized by low tax effort simply because its population prefers to have a small public sector. Conversely, a country that exhibits high tax effort might be collecting taxes in an inefficient way.’Footnote 65
Hence, what may be needed is a measure of tax collection that incorporates states’ perceptions of themselves and their societies, one that includes, from the earlier definition of state capacity presented in Chapter 2, the concept of state goals and objectives.
A perfect measure of tax collection, then, would be the amount collected as a percentage of what the state believes should ideally be collected in order for it to accomplish the tasks it would like to carry out. Examining tax arrears as determined by a country's Ministry of Finance or Tax Administration – the amount of taxes not collected but what the state thinks it should have collected – can help to approximate the state's view of those data at an aggregate level. Further, it is critically important to assess, if possible, the willingness of citizens to comply with the state and pay their dues. Therefore, this chapter will present data on tax arrears and data from a bespoke series of surveys on citizen attitudes. With this two-pronged approach, tax capacity will be assessed at the aggregate and individual levels.
Comparing Levels of Aggregate Tax Arrears with What Is Collected
Presenting data on aggregate tax arrears – that is, presenting information on the size and collection of each year's unpaid taxes – provides a view as to how good a state is at collecting tax revenue in light of what it believes is owed to it. Table 4.1 displays overall tax arrears as a percentage of all taxes collected, derived by the author utilizing data from the Ministry of Finance in Poland, from the RF State Statistics Service, and from the IMF, World Bank and the State Fiscal Service in Ukraine.
| 1994 | 1995 | 1996 | 1997 | 1998 | 1999 | 2000 | 2001 | 2002 | 2003 | 2004 | |
|---|---|---|---|---|---|---|---|---|---|---|---|
| Poland | na | 6.0 | 5.7 | 5.0 | 4.7 | 6.1 | 7.7 | 9.7 | 11.4 | 10.7 | 10.3 |
| Russia | 11.2 | 16.1 | 27.6 | 31.1 | 49.4 | 41.7 | 31.2 | 25.5 | 22.4 | 19.5 | 15.8 |
| Ukraine | na | 6.0 | 6.5 | 9.5 | 44.0 | 45.2 | 31.7 | 17.4 | 53.3 | 42.0 | 22.3 |
| 2005 | 2006 | 2007 | 2008 | 2009 | 2010 | 2011 | 2012 | 2013 | 2014 | 2015 | |
|---|---|---|---|---|---|---|---|---|---|---|---|
| Poland | 9.3 | 8.9 | 7.7 | 7.7 | 8.3 | 8.8 | 9.1 | 10.4 | 12.8 | 15.2 | na |
| Russia | 19.3 | 13.9 | 10.9 | 7.2 | 8.9 | 8.8 | 7.2 | 6.2 | 6.4 | 6.1 | 6.0 |
| Ukraine | 8.7 | 5.7 | 3.6 | 3.7 | 5.3 | 6.0 | 3.9 | 2.6 | 3.1 | 6.7 | 4.7 |
| Poland average (1995–2014) | 8.8 | ||||||||||
| Russia average (1994–2015) | 17.8 | ||||||||||
| Ukraine average (1995–2015) | 15.8 | ||||||||||
a For Poland, Ministry of Finance, 2000, p. 15; 2001, pp. 4, 14; 2002, pp. 4, 29; 2003, pp. 4, 16; 2004, pp. 5, 19; Ministry of Finance websites (<www.archbip.mf.gov.pl/bip/7786.html>) accessed 8 July 2014 and (<www.finanse.mf.gov.pl/budzet-panstwa/>) accessed 18 July 2016. The Overall Tax figure was compiled using data for corporate income tax, personal income tax, taxes on goods and services, excise tax, games tax and abolished taxes. Also, note that in 2002 overall taxes do not include arrears from excise taxes.
b Data compiled by author with statistics from Rosstat, 1998, pp. 22–24, 59; 2000, pp. 68, 72; 2002, pp. 58, 62; 2004, pp. 72, 76; 2006, pp. 73, 77; 2008, pp. 77, 83; 2010, pp. 82, 87; and 2012, pp. 81, 86. On 18 July 2016, 2012–2014 data were accessed from Finansy Rossii 2014 at www.gks.ru/wps/wcm/connect/rosstat_main/rosstat/ru/statistics/publications/catalog/doc_1138717651859, while 2015 data were accessed at: <http://www.gks.ru/wps/wcm/connect/rosstat_main/rosstat/ru/statistics/finance/#> and at <www.gks.ru/free_doc/new_site/finans/fin210g.htm>. The Overall Tax figure was compiled using aggregate data for all taxes received, which include corporate income tax, personal income tax (although arrears data are not provided separately for this tax as in Poland and Ukraine), taxes on goods and services, excise taxes, payments for the use of mineral wealth and natural resources, and property taxes. In 1994, a special tax also was included in the taxes collected figure, and from 2000 to 2003, Rosstat also includes a separate sales tax and a taxes on gross revenue.
c Unlike the Polish and Russian tax arrears data, the Ukraine data do not come from a single source, as no institution or organization, including the Ukrainian Ministry of Finance, has time series data from the mid-1990s until the present. Obtaining financial and tax data in Ukraine is not just a problem for independent researchers, but also has been regarded as a problem for government policy makers trying to make policy projections. The 1995 data are from the IMF, 1999, pp. 100, 102. 1996–2001 data are from a World Bank Ukraine office document entitled ‘Descriptive and Diagnostic Analyses,’ pp. 2 and 3. 2002–2004 data are from World Bank, 2007, p. 23, but the CIT and VAT tax arrears data for 2002–2003 are from the IMF, 2005, pp. 28, 31. The 2005–2014 data were obtained from the State Fiscal Service of Ukraine by a direct request from a Ukrainian parliamentary deputy's office. The 2015 figure was provided in a personal e-mail from the World Bank's Washington, DC office on 2 June 2016.
Overall, the Polish tax system has been remarkable in its ability to raise tax revenue for the state without any major obstacles. With respect to unpaid taxes, the total amount of year-end arrears averaged just 8.8 per cent of all taxes received by the state for the years 1995 to 2014. This places Poland's performance close to the 4–6 per cent range typical for Canada, the United States and Australia.Footnote 66 By further comparison, from 2000 to 2002, the average amount of tax arrears in the United States as a percentage of all taxes collected was 3.8 per cent.Footnote 67
As Table 4.1 shows, for all arrears in Poland from 1995 to 2014, the amount of tax arrears for the most part can be described as significant, but not overwhelming. Throughout the 1990s, Poland had a moderate level of tax arrears. Indeed, the total stock by the end of 1999 was nearly 6 per cent of all taxes collected.Footnote 68 Yet Poland fell out of that range after 1999, when tax arrears increased to an average of 9.1 per cent of tax receipts for the years 2000–2010, and the overall level of tax arrears in relation to annual total tax receipts appears to have doubled from the 1990s figures in the more recent years 2013–2014.
The relatively low rate of Poland's tax arrears in the 1990s does not suggest, however, that Poland was as efficient as some of the better Western countries in collecting arrears. Poland's Ministry of Finance's own figure of only 28.8 per cent of all tax arrears having been realized as of 31 December 1999 suggests that overall, in more than 7 out of 10 cases, tax arrears continued to go unpaid.Footnote 69 Comparing Poland with Sweden, for example, one finds that in 1998, while Poland had an overall 4.7 per cent ratio of net tax arrears to tax receipts, Sweden had a 1.2 per cent ratio of new arrears to total taxes. Moreover, of these new arrears for that year in Sweden, 33.6 per cent were paid.Footnote 70 Matching that figure up with the 28.8 per cent figure suggests that Poland performs somewhat well with respect to tracking down tax arrears. Poland's main problem (and Russia's and Ukraine's, as we shall see) is that it had more arrears to start with than a Nordic country like Sweden, posing a greater administrative challenge from the beginning.
Meanwhile, in Russia, the total amount of year-end arrears averaged just 17.8 per cent of all taxes received by the state for the years 1995–2015. Further, in Ukraine, from 1995 to 2015, the total amount of arrears averaged 15.8 per cent of all taxes received by the State Tax Administration (STA), placing Ukraine much closer to Russia than Poland and other OECD states.
In general, tax arrears have been far more significant in Russia and Ukraine than in Poland. Whereas the overall stock of total tax arrears amounted to just under 6 per cent of all tax receipts in Poland by the end of 1999 and the total amount of tax arrears as a percentage of a year's tax revenue climbed gradually to 15.2 per cent in 2014, the total amount of tax arrears never dipped below 15 per cent of total tax income in Russia from 1995 until 2005 or in Ukraine from 1998 to 2004. Moreover, in both Russia and Ukraine, in the late 1990s (1997–2000), the total stock of arrears averaged from a third to half of all tax income. Indeed, around 28 per cent of all registered legal entities in Russia had tax arrears in 1998.Footnote 71 As the IMF observed, even though the stock of arrears in the mid- to late 1990s was reduced by high levels of inflation, arrears have continued to remain high in comparison with those in OECD countries.Footnote 72 (The IMF in 1999 did place Russia's voluntary tax compliance rate at less than 70 per cent, in contrast to compliance rates of about 80 per cent in the United States, 85 per cent in the European Union and 95 per cent in the Nordic countries.Footnote 73)
Figures 4.1 and 4.2 present the annual tax arrears for the CIT and the VAT for the three countries. (Separate data for PIT arrears were not available at all for Russia or for many years for Ukraine.) For all three states, the VAT tax has proven to be the most difficult of the taxes to collect in full. However, in Russia and Ukraine, the VAT arrears have been gigantic, averaging 36.1 per cent from 1994 to 2015 for Russia and 23.9 per cent from 1995 to 2014 for Ukraine. Yet, noticeably, the flow of total tax arrears began to lessen somewhat gradually after the early 2000s for all three states, suggesting either that there were fewer additional arrears each year or that the tax administration was, perhaps, becoming more effective in collecting old arrears.
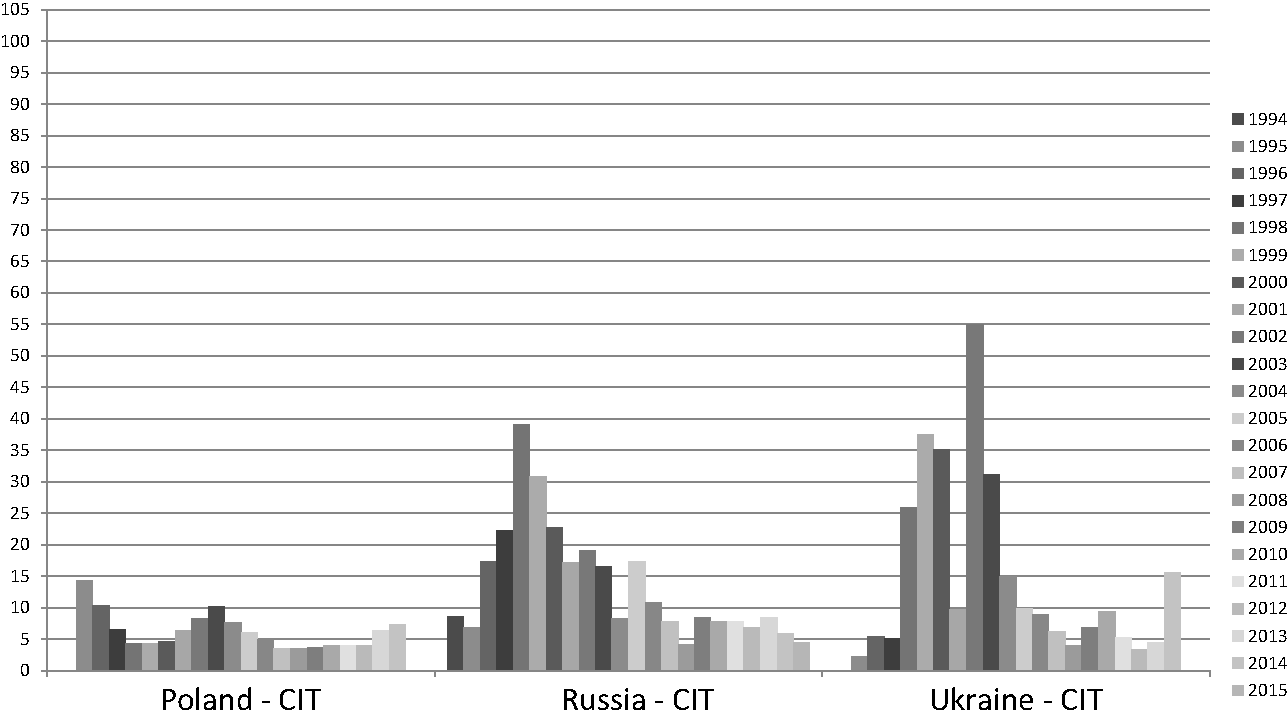
Figure 4.1 Total tax arrears as a percentage of annual total tax receipts for the corporate income tax in Poland, Russia and Ukraine
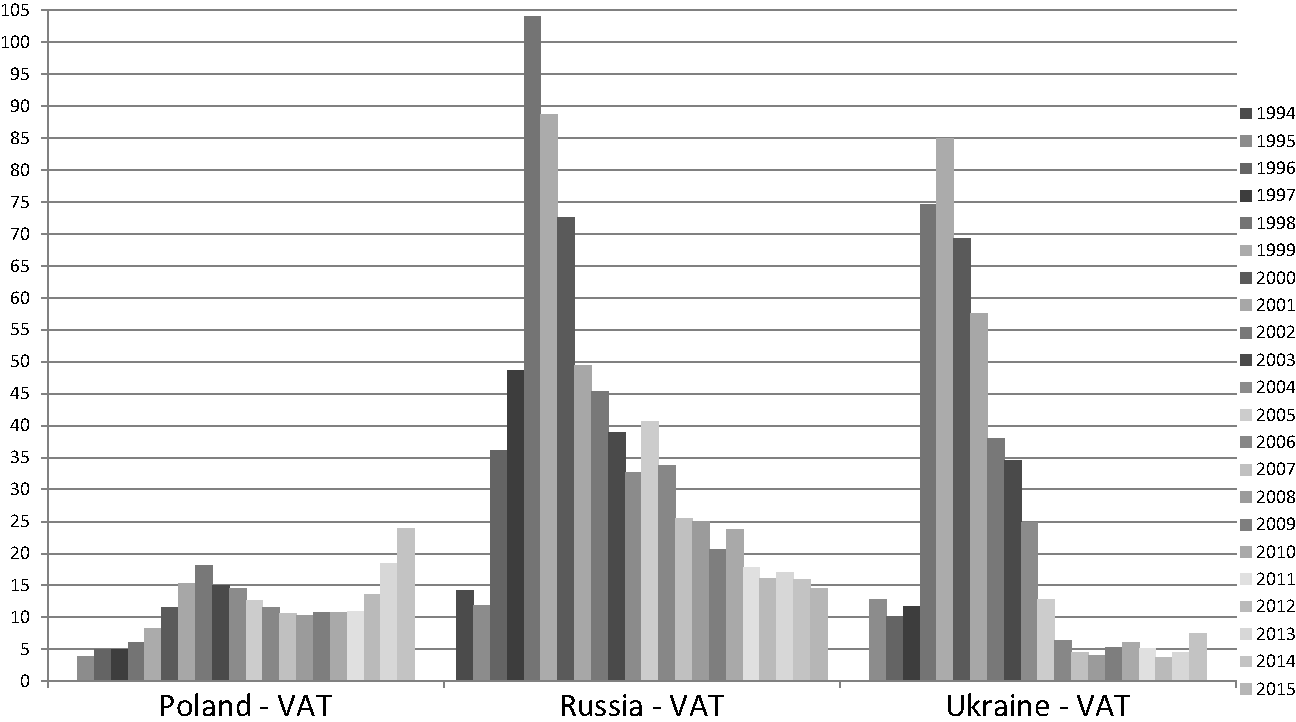
Figure 4.2 Total tax arrears as a percentage of annual total tax receipts for the value-added tax in Poland, Russia and Ukraine
Moreover, despite these tax arrears statistics, outside experts differ with regard to what are, in fact, the actual tax collection rates in Russia. According to the Moscow-based Economic Expert Group, an independent group which was founded by the Ministry of Finance and which works closely with it and the Ministry of Economic Development and Trade, the collection of VAT in the early 2000s did not exceed 62 per cent, while outside experts at the Centre for Economic and Financial Research and the Russian Union of Industrialists and Entrepreneurs (RSPP) thought in 2003 that the VAT tax was not being collected at more than 50 per cent.Footnote 74 Moreover, Russian Prime Minister Mikhail Kasyanov was quoted in April 2002 as stating that the current overall tax collection rate was 92–93 per cent, compared with 55–60 per cent in 1998.Footnote 75 A year earlier, Kasyanov stated that tax collection in 2000 was 60 per cent.Footnote 76 Hence, the true rate of tax collection might actually be far lower than in the data provided by the Ministry of Finance, which shows that levels have approached Poland's only since 2001.
The reliability of the tax arrears data presented here for Ukraine also could be of some concern. Unlike those for Poland and Russia, the data for Ukraine are from three distinct sources rather than from one source throughout the time series, and the different sources – when they do have overlapping data – are not consistent. For example, the World Bank provides a much higher figure for 2006 when it states that the overall tax arrears as a share of tax revenues were 18 per cent, whereas the State Fiscal Service provides data that yield a figure of 5.7 per cent.Footnote 77 Similarly, using World Bank data to derive overall tax arrears yields a figure of 6.5 per cent of all taxes collected in 1996, but using IMF data yields 10.4 per cent. As the lower figures are used to assess Ukraine's tax arrears in Table 4.1, it is difficult to distinguish greatly between Russia and Ukraine with respect to the annual tax arrears averages over the entire period, but it can be firmly concluded that both countries performed significantly worse than Poland and the OECD states.
Tax Offsets in Russia and Ukraine
Accompanying the rise of tax arrears, especially in Russia and Ukraine, was the phenomenon of tax offsets – that is, the cancellation of debts between the taxpayer and the government in which negligent taxpayers exchanged their tax debts for government arrears or payables, which created significant damage to the administration of tax collection. The tax offsets, as well as the swapping of promissory notes among firms and governments (national and local), enabled some tax officials overseeing the arrears to overestimate the value owed, opening the door to graft and corruption and creating an incentive for firms not to pay taxes.Footnote 78 In 1997, Jennifer L. Franklin wrote that the Russian Finance Ministry had estimated that an approximate U.S.$28.6 billion worth of tax breaks was offered to the wealthy and politically connected in Russia each year.Footnote 79
Jorge Martinez-Vazquez and Robert M. McNab have estimated that in the transition countries, revenues collected through offsets peaked at around half of what was actually due from tax revenues in 1996–1998.Footnote 80 Hence, the decline in Russia's revenue in the 1990s may have been even greater, if one were only examining cash revenues and excluding non-cash revenues, or what are referred to as ‘cash offsets’. ‘The decline in cash revenues at the federal level has been dramatic’, write Liam Ebrill and Oleh Havrylyshyn at the IMF. ‘Revenues for regional governments, including tax offsets, during the period 1993 to 1997 remained at about 22 per cent of GDP, while federal government cash revenues declined from about 14 per cent to just over 9 per cent of GDP. This difference has less to do with fiscal-federal relations than it does with the extensive and growing use of tax offsets by regional governments. The precise extent to which tax offsets are used by regional governments is not known, but they are believed to account for the bulk of revenue at present. At the federal level, the use of such offsets, on the order of 3 per cent of GDP in 1997, is reflected in the revenue data during the years prior to 1997.’Footnote 81 Moreover, the Russian state had to accept such tax offsets, weakening its control over spending priorities and taxpayers’ dues.Footnote 82 Such regular granting of tax offsets created further expectations that their employment would be repeated, impacting tax payment discipline negatively.Footnote 83
An additional problem of the 1990s was the continued use of tax amnesties, which led to increases in tax arrears as taxpayers began to expect that such amnesties would be offered in the future.Footnote 84
Hence, from the data presented here, one can judge Poland's tax collection to be ‘moderately successful’, with some decreased success in 2012–2014, while Russia's and Ukraine's performance can be judged as varying from ‘quite poor’ to ‘improving’. Throughout the transition as a whole, the Polish tax system has been able to raise tax revenue for the state without any major obstacles and, at times, close to or above its target levels. It consistently is able to extract revenue from society year by year, but it does fall short of its goals at times and has significant, though not incapacitating arrears. Meanwhile, data from Russia and Ukraine are more erratic. Tax collection was poor and tax arrears high throughout the late 1990s for these countries. After 2000, tax arrears are not as great and, by measures of the state's intentions, tax collection rates are up.
What accounts for Poland's moderate success and for Russia and Ukraine's moderately poor results? In the rest of this chapter, after presenting individual-level data on tax compliance, we will examine how the economy can affect the changes in tax collection from year to year. Then, in Chapters 5 and 6, we will proceed to examine how the ability to raise revenue on the part of the Polish and Russian states depends upon a mix of bureaucratic rationalism and social compliance.
Obtaining Individual-Level Data on Tax Compliance
‘The empirical study of tax compliance is cumbersome because individual-level data is very difficult to collect’, Marcelo Bergman has written. ‘Most government agencies are reluctant or legally unable to allow research on individual tax returns. Even when such information becomes available, it is usually impossible to create data sets that also include individual preferences and attitudes, which are needed to explain tax behaviour.’Footnote 85
While Bergman was writing about studying tax compliance in Latin America, nowhere more, perhaps, are his words more appropriate than with respect to trying to obtain data from tax administrations in Eastern Europe and the former Soviet Union – especially with respect to today's geopolitical climate and Russia. Yet, in gauging specifically how well residents in new states such as Poland, Russia and Ukraine become true citizens, it is necessary to measure how compliant the populace is with respect to taxes. So is it possible to delineate exactly how willing post-Soviet and post-socialist societies are to pay taxes?
While there is a lack of data on taxpayer compliance rates in these three countries, results from a series of unique Taxpayer Compliance Attitudinal Surveys designed by this author and carried out by the Centrum Badania Opinii Społecznej (CBOS Public Opinion Research Centre) and the PBS DDG Market Research firm in Poland, the Public Opinion Foundation (FOM) in Russia, and the Razumkov Centre for Economic and Political Studies in Ukraine in 2004, 2005, 2010, 2012 and 2015 do further illustrate how Poles, Russians and Ukrainians view paying their dues. Questions for some of the survey questions were based on earlier studies of tax compliance in the United States.Footnote 86
Recognizing the limitations of the available tax data in providing accurate estimations of tax compliance in countries with a history of barter, high levels of black market activity and less than transparent finance ministries and tax administrations, one of the survey questions that asks respondents whether they ‘would follow the tax laws even if you do not consider them to be fair’ is highlighted (see Table 4.2.)
Table 4.2 Poland, Russia and Ukraine Taxpayer Compliance Attitudinal Surveys 2004, 2005, 2010, 2012 and 2015
| Question: Would you follow the tax laws even if you do not consider them to be fair? (Appendix II: Question #22, Percentage of Responses) | ||||||||
|---|---|---|---|---|---|---|---|---|
| Poland 2004 | Poland 2010 | Russia 2004 | Russia 2010 | Ukraine 2005 | Ukraine 2010 | Ukraine 2012 | Ukraine 2015 | |
| Yes | 83 | 77 | 53 | 52 | 36 | 44 | 39 | 45 |
| No | 6 | 15 | 28 | 30 | 37 | 37 | 36 | 34 |
| Hard to say | 10 | 8 | 19 | 18 | 27 | 20 | 25 | 22 |
The surveys constitute an effort to obtain a direct measure, assessed at the individual level, of tax complianceFootnote 87 in light of the fact that these countries’ tax administrations have yet to release any direct self-reports of individual taxpayers, such as anonymized tax returns. Indeed, it would be very difficult to gauge whether or not respondents paid their taxes in full and on time, short of receiving such individual-level data from the STAs in each country. (The IRS in the United States, for example, has periodically shared such data with academic researchers, after omitting personally identifiable data.Footnote 88)
Obviously, obtaining such measurements through surveys is a bit tricky, complicated especially by the fact that this survey of a sensitive topic, laid out more fully in the first Appendix, is the first set of survey questions designed to test tax compliance theories in these states, all of which have a history and tradition of authoritarian rule. Moreover, the surveys are taken at just two points in time in Poland and Russia and four points in time in Ukraine. Further, any reforms or improvements with respect to tax law or tax procedures undertaken by the state in recent years may not have caught up in the minds of respondents as they form their current overall attitudes towards paying taxes. In addition, while attitudinal decisions are important components of behaviour, surveying attitudes towards compliance is not precisely the same as measuring tax compliance itself.Footnote 89 As no one has undertaken such a comprehensive survey on attitudes in these transitional countries to test tax compliance theories, the data from the surveys are suggestive, not definitive.
Nevertheless, asking individuals directly whether or not they pay their taxes on time and in full is not likely to yield accurate and honest responses in most parts of the globe. But the Taxpayer Compliance Attitudinal Survey Question #22 does seek to replicate as much of a ‘real world’ scenario as possible, one in which individuals every day do choose to follow or not the tax laws even when they disagree with them. It is a measure of individual attitudes towards tax compliance, and the research to come in Chapters 6 and 7 is an examination of the links between those attitudes that are an inherent and essential part of behavioural decisions to comply or not to comply. Hence, because it presents as much of a realistic situation as possible, one in which individuals decide for themselves what makes for fairness in taxation or not, Question #22 is chosen as the main dependent variable for analysis in the upcoming chapters, where the focus is on why variation exists among these three countries.
And, indeed, the three countries do have distinctly different responses to this question on an individual level. Whereas 83 per cent of Poles in 2004 (and a similar 77 per cent in 2010) would follow the tax laws even if they regarded them as unfair, only 53 per cent of Russians in 2004 (and a nearly identical 52 per cent of Russians in 2010) and 36 per cent of Ukrainians in 2005 (and a somewhat similar 44 per cent of Ukrainians in 2010, 39 per cent of Ukrainians in 2012 and 45 per cent of Ukrainians in 2015) would do the same (Question #22). (Expressed another way, and as shown in Appendix III, when compared with the answers to Question #26 regarding whether or not the respondent viewed his or her country's tax laws as fair, in 2010, a minimum of 12 per cent of Poles, a minimum of 21 per cent of Russians and a minimum of 37 of Ukrainians did not have any intention of complying with their countries’ tax laws.)
By design, the Taxpayer Compliance Attitudinal Surveys focus on individuals rather than directly on businesses. This is in part because it is difficult to assess the intentions of businesses with respect to tax matters without examining their tax returns – largely because it is not clear whether one should survey accountants, employees, or executives, but due as well to access. Nevertheless, the surveys, as general surveys of the Polish, Russian and Ukrainian publics, presented here of course include individuals who work in businesses. Moreover, additional questions are included in the survey (such as Question #2 in Appendix I), which inquire as to how respondents paid their taxes – by themselves directly, through their employers or by other means. Individuals who pay their own taxes are likely to have higher incomes and/or work at two or more jobs, as opposed to those who have their employers file their taxes for them – especially in Russia and Ukraine, which had flat personal income taxes during the time of the surveys. In addition, one of the sociodemographic questions employed in the surveys asked about occupation, with an option for those who are managers and/or entrepreneurs. Both of these factors were considered in the analysis undertaken in Chapters 6 and 7, and as will be detailed in greater detail there, both factors were found to have little or no impact, especially compared with the critical variables under analysis, suggesting that those who work in business have attitudes towards the state similar to those of the populations as a whole. Nevertheless, assessing attitudes towards tax compliance in businesses through targeted surveys aimed at firms of all sizes would yield important and interesting data, especially as the popular Business Environment and Enterprise Performance Survey (BEEPS), a joint project of the European Bank for Reconstruction and Development (EBRD) and the World Bank, only asks a few questions regarding tax issues, and none on tax compliance.
The Influence of Economic Factors
The Black Market
In the first four years of Poland's transition (1990–1993), the share of the unofficial economy, according to an electricity consumption estimate, averaged about 20 per cent of the country's GDP.Footnote 90 In contrast, in Russia, the average was about 38 per cent of the country's GDP in the first four years after the collapse of the Soviet Union (1992–1995). Ukraine's average was about 42 per cent over the same period. In other words, at the very beginning of the transition, Russia and Ukraine's black market economies were about twice as big as Poland's relative to the total economies. For 1999 to 2007, utilizing Daniel Kaufman and Aleksander Kaliberda's MIMIC method, the share of the unofficial economy was found to be about 27 per cent for Poland, 44 per cent for Russia and 50 per cent in Ukraine.Footnote 91 These figures could suggest that on the average about this much of GDP is hidden from taxation each year in each country.Footnote 92 (As a means of comparison, the underground economy is deemed to be about 2 to 10 per cent of GNP in Western economies, with perhaps 7 to 10 per cent being a reasonable estimate for the United States.)Footnote 93
In addition, as shown in Table 4.3, Poland had less of its economy hidden than many other transition states. In short, the black market economy and the non-cash (or barter) economy were much larger in Russia and Ukraine than in Poland, massively cheating state treasuries of needed revenue.
Table 4.3 Measurements of the unofficial economy as a percentage of GDP in selected transition countries for the early 1990s by the electricity method and for 1999–2007 by the MIMIC method
| 1989 | 1990 | 1991 | 1992 | 1993 | 1994 | 1995 | 1999 | 2000 | 2001 | 2002 | 2003 | 2004 | 2005 | 2006 | 2007 | Avg | |
|---|---|---|---|---|---|---|---|---|---|---|---|---|---|---|---|---|---|
| Czech Rep. | 6 | 7 | 13 | 17 | 17 | 18 | 11 | 19 | 19 | 19 | 19 | 19 | 18 | 18 | 17 | 17 | 16 |
| Georgia | 12 | 25 | 36 | 52 | 61 | 64 | 63 | 68 | 67 | 67 | 66 | 66 | 65 | 64 | 62 | 66 | 56 |
| Hungary | 27 | 28 | 33 | 31 | 29 | 28 | 29 | 25 | 25 | 25 | 25 | 24 | 24 | 24 | 24 | 24 | 27 |
| Lithuania | 12 | 11 | 22 | 39 | 32 | 29 | 22 | 34 | 34 | 33 | 33 | 32 | 32 | 31 | 30 | 30 | 28 |
| Poland | 16 | 20 | 24 | 20 | 19 | 15 | 13 | 28 | 28 | 28 | 28 | 28 | 27 | 27 | 26 | 26 | 23 |
| Russia | 12 | 15 | 24 | 33 | 37 | 40 | 42 | 47 | 46 | 45 | 45 | 44 | 43 | 42 | 42 | 41 | 37 |
| Ukraine | 12 | 16 | 26 | 34 | 38 | 46 | 49 | 53 | 52 | 51 | 51 | 50 | 49 | 48 | 47 | 47 | 42 |
In addition to such cross-national data, the Gdańsk Institute for Market Reforms found in 1994 that 29.6 per cent of those Poles surveyed reportedly had worked on the black market. The survey also found that about 13.8 per cent of all personal income in Poland is not registered.Footnote 94 Similarly, in January 2005, CBOS reported that 13 per cent of Poles surveyed stated that taxes on their salaries were not paid in full or in part to the social security system (ZUS), whereas 87 per cent stated that their social security taxes were paid in full.Footnote 95 Hence, taking these figures as a proxy for social compliance with respect to taxation, Poles would appear to have complied with registering their incomes from 70 to 87 per cent of the time after the transition began.
In contrast, in Russia, in 1994, a survey of businesses carried out by the Working Centre for Economic Reforms under the Russian government found that only 1.5 per cent of respondents said that they registered all business transactions on their books, 33.1 per cent acknowledged that they hid up to 25 per cent of transactions, 28.9 per cent stated that they hid up to 50 per cent, and 18.4 per cent admitted to not registering up to 100 per cent of transactions.Footnote 96 Assuming equal weight on the size of the transactions reported and unreported, up to 59 per cent of all economic activity was not reported by businesses in Russia that year.
In addition, a survey conducted by the Sociology Institute of the Russian Academy of Sciences four months after the introduction of the flat rate for the PIT in 2001 found that only 48 per cent of Russians polled in Moscow and St. Petersburg received a salary paid in full compliance with the tax laws. Of those polled, 39 per cent were considered ‘grave’ tax evaders, receiving their salaries in cash in agreement with their employers.Footnote 97 In 2005, Deputy Finance Minister Sergei Shatalov reported that ‘under-the-table salaries’ make up 30 per cent of the country's total payrolls.Footnote 98
Moreover, whereas 4,700,000 individual businesspeople and 3,300,000 organizations were on the tax lists as of 1 January 2003,Footnote 99 as of that date 2.2 million companies and self-employed individuals did not submit reports to tax authorities and about 920,000 companies and self-employed individuals submitted zero reports – figures that suggest that 38.5 per cent of all companies and self-employed individuals do not pay taxes.Footnote 100 In 2006, despite a decrease of 1 per cent a year in the number of ‘grey salaries’ immediately after the flat PIT was adopted, the figure for ‘grey salaries’ rose again to more than 32 per cent.Footnote 101 Similarly, even two years after the corporate tax rates were lowered, many firms were said still to be maintaining double account books out of a fear that the new tax policies and tax rates would change yet again.Footnote 102 Hence, the size of the black market economy during the transition in Russia may well range from 32 per cent to 59 per cent in the early 2000s. If that much of the economy is out of the domain of what is taxed, only 41 to 68 per cent of economic activity may well be reported to the tax authorities.
In the first half of 2015, Ukraine's Economy Ministry estimated that 42 per cent of the nation's economy, or about US$18 billion, went unaccounted for, and according to economist Friedrich Schnieder, since 2008, an average of 44.5 per cent of Ukraine's GDP has not been on the books.Footnote 103 And, as shown in Table 4.3, Ukraine's share of the black market ranges from 34 to 53 per cent in the first decade after the collapse of the Soviet Union, suggesting that only 49 to 66 per cent of economic activity in the country might have been reported to the tax administration. Iuzhanina, chair of the Rada's Tax and Customs Policy Committee, has written that around 80 per cent of PIT is collected from government employees’ salaries, simply because ‘it is nearly impossible to dodge the tax on government wages’, while the private sector ‘chooses to pay its workers under the table to avoid the tax altogether’.Footnote 104
If, indeed, the unofficial economies are this large and the tax declaration rates were 70 to 87 per cent for Poland, 41 to 63 per cent for Russia and 49 to 66 per cent for Ukraine, it would appear that the tax arrears figures reported by the three state's tax administrations should have been much larger. The fact that they are not suggests that these post-communist governments are neither able nor willing to reach out and uncover all of the income derived from unreported economic activity, and they are not considering such income when deriving estimates for real amounts of tax due. And, because the size of the black market economy is greater in Russia and Ukraine than in Poland, the ability or willingness of the Russian and Ukrainian state tax organs to capture all economic activity taking place within state borders is less.
The Barter Economy
A main underlying factor fuelling the unofficial economy is, of course, the use of barter between firms in the post-communist economies. Barter, especially as a form of payment in Russia's and Ukraine's regions, in many ways was a holdover from the Soviet system, in which commands and orders, rather than money, were what was needed to get things done. From the beginning of the transition, there was a relative scarcity of money in the Russian economy due ‘to both the lack of the very concept itself in the socialist planning system and to the consequence of the drastic devaluation of the working capital of enterprises after the price liberalization of 1992’.Footnote 105 David Woodruff's Money Unmade and Clifford G. Gaddy and Barry W. Ickes's Russia's Virtual Economy detail precisely how the Russian state struggled as it sought to root out barter and make money supreme again in the 1990s. The authors also lay out precisely how political conflicts ensued between, on the one hand, bank-led industrial groups and large firms, like Gazprom, which stood to benefit from a monetary-based economy and for which evading taxes had greater risks, and, on the other hand, local coalitions in the regions, which benefited from barter and which included newly created firms that had unaccounted cash sales and that resorted to tax evasion.Footnote 106
For those that engaged in the barter economy, there were multiple reasons. Barter, or transactions by regional governments, banks or enterprises through the use of promissory notes (or veksels), write Shleifer and Treisman, ‘was a way of avoiding holding cash in bank accounts that could be confiscated by tax collectors if taxes went unpaid. It was also a way of getting around a law that prohibited selling below cost – prices could be artificially manipulated in a barter deal. In addition, paying taxes in kind rather than in cash was a way to favour the regional and local over the federal budgets, since accepting tax payments in concrete or cucumbers was easier for a city government than for the State Tax Service in Moscow.’Footnote 107 In Ukraine, the share of the barter economy was said to be over 35 per cent of GDP in 1994 and more than 40 per cent of GDP in 1997–1998.Footnote 108
Without a doubt, the barter economy has played a strong role in the story of post-communist tax collection – not just because part of the economy was hidden through barter activity, but also because the tax authorities also engaged in barter by collecting tax debts partly in the form of nonmonetary, in-kind transactions. The rise of barter made collecting taxes complicated, especially at the federal level in contrast to the local level, where fiscal responsibilities could be conceived in less monetary terms. ‘The builders of the Soviet economy’, writes Woodruff, ‘had “hardwired” the ability to tax particular economic actors in kind into the very social infrastructure of Russia.’Footnote 109 As a result, local governments and later the federal government began to accept in-kind taxation. Woodruff calculates that by 1996 approximately 60 per cent of local tax receipts were in kind, and at the federal level, the share of tax income that was nonmonetary was about 19 per cent in 1995, 33 per cent in 1996 and 40 per cent in 1997.Footnote 110
While the phenomenon of in-kind taxation appears to have been in decline after 2000 – certainly after Russia's 2001 tax reform – and while this author did not encounter any reports of nonmonetary taxation after his research began in the early 2000s, the fact that the size of the unofficial economies still has remained substantial in subsequent years implies that in-kind taxation could well continue in some form to this day. ‘[I]t is important to note that Russia widely uses nonmonetary taxation where federal, regional or local authorities invite a company to participate or invest in some sort of project where it is implicitly understood that the company will not show a profit’, writes Mikhail Glazunov. ‘Using nonmonetary taxation gives authorities additional opportunities for realization of important projects without dipping into the official budget, as well as developing opportunities for the personal enrichment of members of the authorities.’Footnote 111 Hence, as the post-transition period marches on, the forms in-kind taxation takes may well be more discreet and hidden than they were in the 1990s.
The Economic Explanation
Unexpected declines in economic growth are important factors in analyzing why certain tax collection goals, placed in the budget law in August or the early fall of the previous year, may not be met. For Poland, the tax revenues, which were higher than forecast in the budget laws for the years up to 1998, could be viewed, for example, as being largely due to the higher-than-expected inflation in those years,Footnote 112 suggesting that the above-perfect or near-perfect tax performance compared with the budget was based on a devaluation of money over the course of the year. Meanwhile, in Russia, the improvement in tax collection in the 2000s could be due to a rebound in the overall economy and to higher-than-expected world oil prices.
To understand better the relationship between the economy and tax collection, Figures 4.3, 4.4 and 4.5 depict comparisons of the annual rate of GDP growth with taxes collected by the Polish, Russian and Ukrainian states, respectively, as a percentage of all taxes dueFootnote 113. Overall, in comparing macroeconomic statistics with aggregate tax data, there are times when there is a general direct correlation between the rise and fall of tax income and the rise and fall of the overall general economy over the course of the post-transition period in all three states. The amount of tax arrears appears to rise and fall with GDP growth but not approaching a direct correlation. For Poland, in Figure 4.3, the percentage of taxes collected decreases as the GDP falls, roughly from 1997 to 2002, but after that, the rise and fall of taxes and the GDP do not seem to be in a clear, direct relationship. Similarly, for Russia, in Figure 4.4 the percentage of taxes collected rises with economic growth from 1998 to 2000, but also continues to rise since then even though the economy sees declines. And, for Ukraine, in Figure 4.5, there appears to be a correlation from 1997 to 2003, but the percentage of taxes collected continues to rise after 2007 despite economic declines. Hence, there are years in each graph where the tax measures rise but the macroeconomic measures fall and vice versa. Further, the rates at which the tax revenue rises or falls from year to year do not seem to correlate exactly with those of the economy. Nevertheless, the trend is there, suggesting that the general state of the economy is a major factor in tax revenue outcomes.
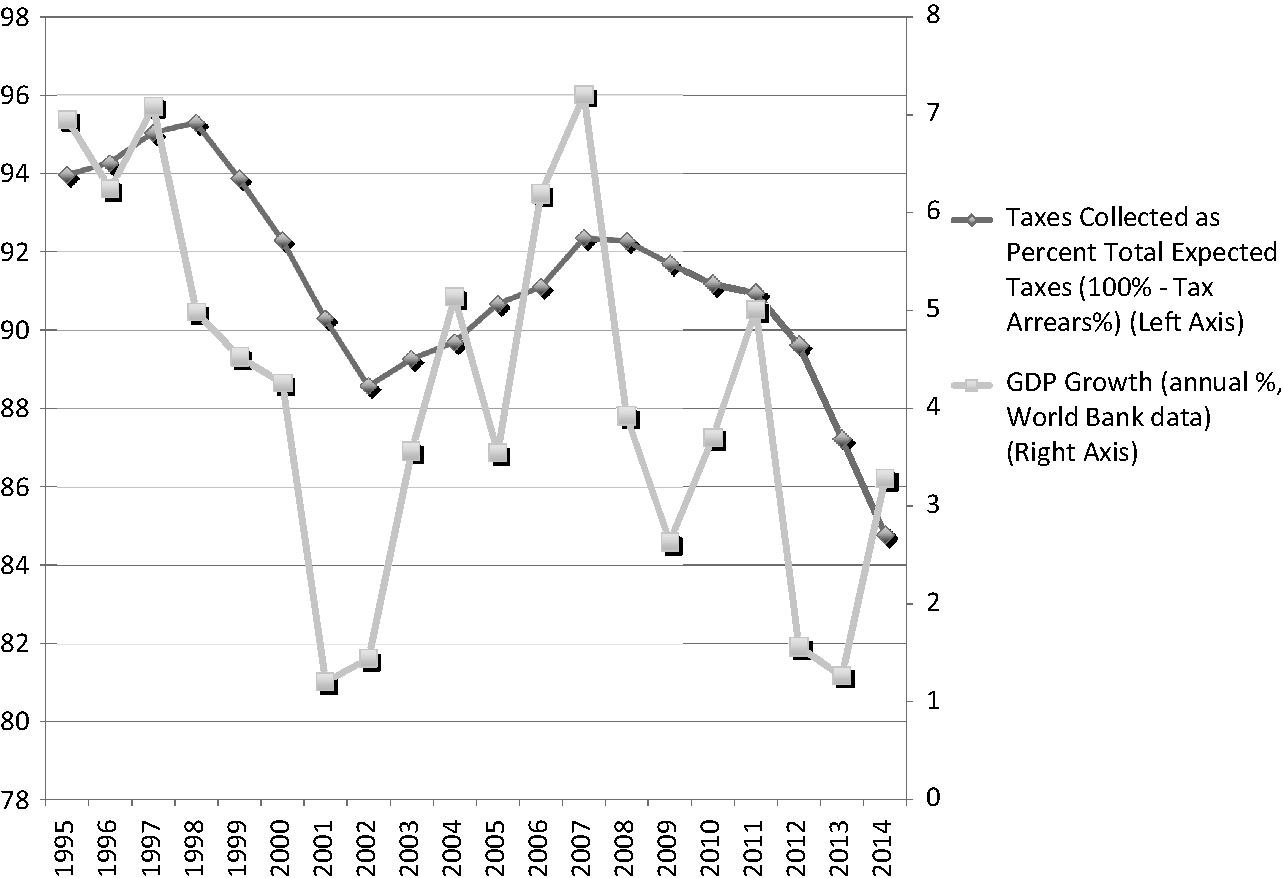
Figure 4.3 Overall tax collected as a percentage of all taxes due and annual GDP growth, Poland
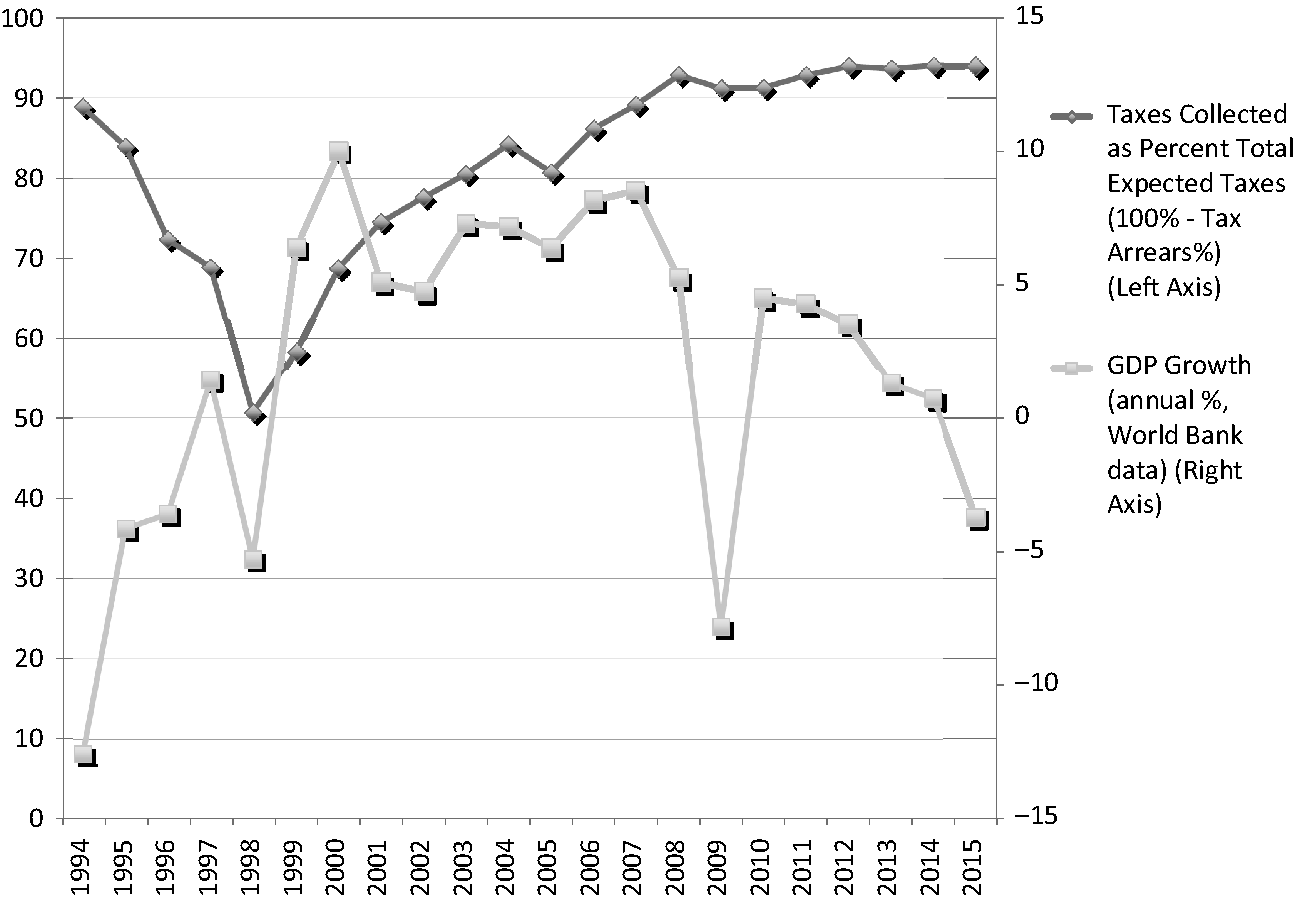
Figure 4.4 Overall tax collected as a percentage of all taxes due and annual GDP growth, Russian Federation
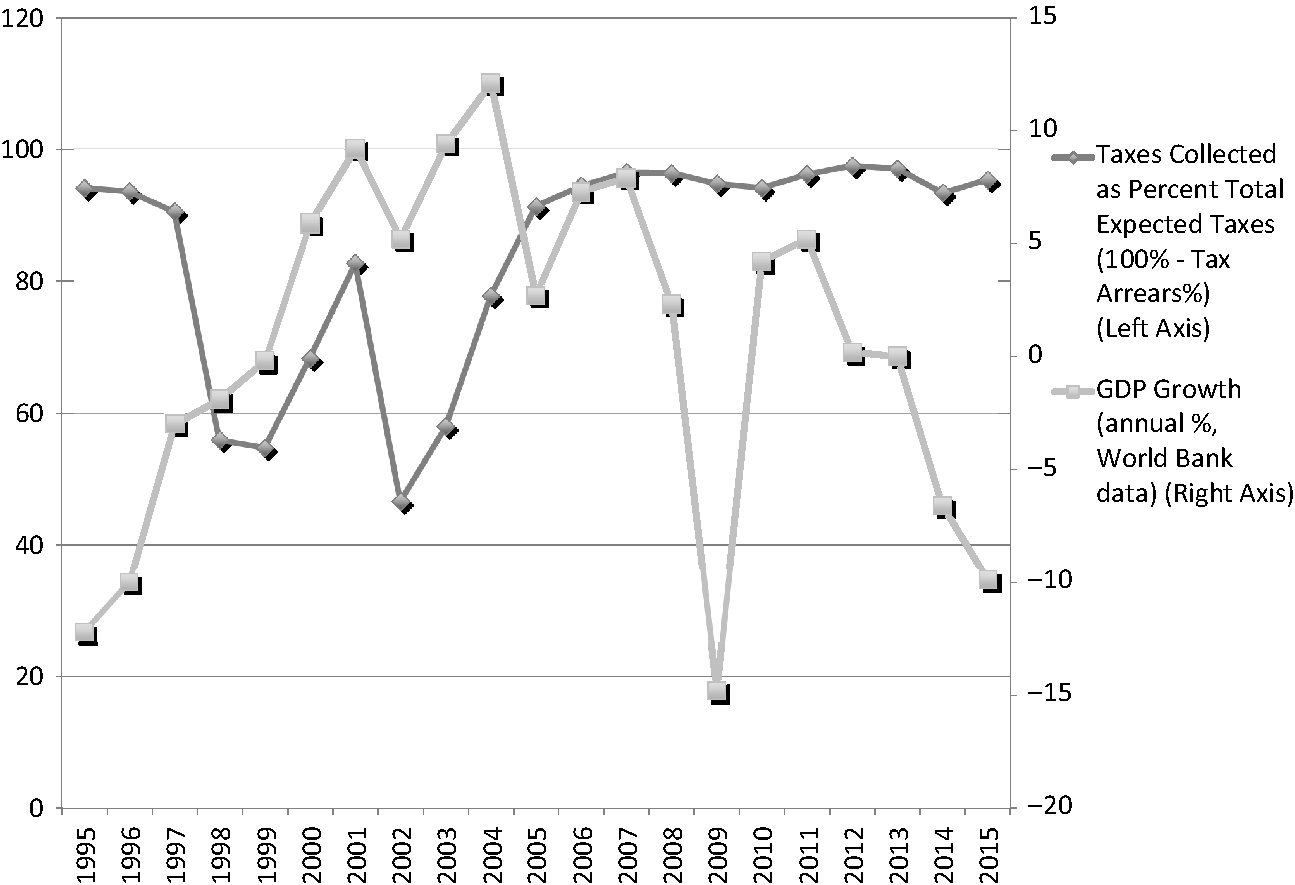
Figure 4.5 Overall tax collected as a percentage of all taxes due and annual GDP growth, Ukraine
In Poland, such a correlation between the health of the economy and tax collection was noted by both the Ministry of Finance and the Supreme Audit Chamber (Najwyższa Izba Kontroli, or NIK.) With respect to tax arrears in the 1995–1999 period, the Ministry of Finance lists a few critical reasons, including the difficult transformation of state sector enterprises at the beginning of the 1990s and the lack of restructuring of certain branches of industry.Footnote 114 In particular, the Ministry of Finance attributes the growth in arrears from 1998 to 1999 to four sectors of the economy that have yet to be restructured, namely the hard coal industry, the defence industry, the steel industry and light industry.Footnote 115
NIK in its annual reports on the budget tends to concur with the Ministry of Finance on the rationale for such large arrears. Back in 1992, NIK mentioned that a sizeable portion of tax arrears were from many large state-owned firms,Footnote 116 and its 1993 report on the budget even goes as far as listing the top 20 firms in Poland with the most tax arrears and the amounts owed.Footnote 117 Its 1999 budget report also cites the growth in VAT arrears as being due to the coal and mining industries.Footnote 118
As the Russian economist Vladimir Popov (and several others) has pointed out, from 1990 to 1998, the Russian government's share of revenues and expenditures, in real terms, decreased dramatically by two-thirds in comparison with the Soviet days, and, as a percentage of GDP, was cut in half, even while the GDP itself fell by nearly 50 per cent.Footnote 119 While a great deal of this can be attributed to the financial crisis of August 1998, as the collection of income and profits taxes hit the lowest levels in 1998 and 1999, the decline, again at least for direct taxes, began much earlier in the 1990s.
While budget projections, which are adopted by the Sejm in Poland, by the State Duma in Russia and by the Rada in Ukraine at the beginning of each year, are based on analysis of expected inflation and expected economic conditions, a change in inflation, economic growth or, in the case of Russia, oil prices from that which is expected can impact the amount of tax revenue actually collected. For example, in Poland, 2001 data show a decline in taxation from expected amounts, reflecting the downward change in the Polish economy during that year. In its report on the fulfilment of the 2001 budget, NIK states that ‘a significant part of the difference (about 50 per cent), between the planned and factually realized income of the budget of the state, can be explained by the non-performance of macroeconomic indicators adopted for the budget, that is a low pace of economic growth and a faster than expected growth of unemployment.’Footnote 120 But NIK comments that part of the blame for the poor 2001 budget figures was due to a failure in drawing up those projections to begin with. ‘However’, NIK writes, ‘it's necessary to attribute the remaining amount of unrealized income…to an overassessment of the results of systemic changes as well as to the infeasibility of the assumed tax collection indicators.’ In short, NIK concludes that ‘during the drafting of the 2001 Budget Law, a serious planning error was committed’.Footnote 121
Measurements of the overall health of the economy do help to explain the variation from year to year of the collection of taxes. It is clear that the fluctuations in the economy, often unexpected, have affected the rise and fall of tax revenue in Poland, Russia and Ukraine, as they would in any state. Moreover, for example, when the economic conditions worsened comparatively for Poland in the late 1990s (as Poland's remarkably high growth rate eased off), higher-than-actual rates of growth were still utilized in the forecasting of the planned tax revenue, which was conducted annually in the early fall of the previous year, leading to lower-than-expected levels of tax returns. In short, because economic forecast data were used in the planning of tax revenue each year, one should not be surprised to see such a correlation, especially in comparison with the forecasts made in each year's original budget law.
However, even if we grant that a lot of the impact is economic, the relationship is not as straightforward, since receiving more income creates more opportunities to hide it and opportunities to choose not to comply, causing tax arrears to go up. And, even if Figures 4.3, 4.4 and 4.5 were to show direct relationships between taxes collected and GDP (which they do not), the correlation between the overall health of the economy and the tax revenue levels does not undermine the role of other factors that enable the bureaucracy to extract revenue from society. In fact, the ability of a country's tax administration to oversee the collection of revenue depends on more than pure economic factors. As will be argued in the next three chapters, the moderate success of tax collection in Poland and the relatively poorer performance in collecting revenue in Russia and Ukraine in the first decades after communism depend upon institutional factors within the state and within society, namely a mix of bureaucratic rationalism on the part of the state and social compliance on the part of the society. Moreover, with respect to the Taxpayer Compliance Attitudinal Surveys, the responses to Question #22 were quite similar for each country across the different years of the surveys, even though there was significant variation in the level of economic growth across the survey years in the three countries. This further suggests that while economic growth matters, other factors are at play – especially in explaining individual-level attitudes towards paying taxes.
The Impact of Tax Rates
Similarly to economic factors, tax collection also relates to changes in tax rates and in tax structure design. One of the most discussed tax policy changes in Central and Eastern Europe since 2000 has been the adoption of the flat tax – especially the adoption of a flat, or single-rate, personal income tax for all taxpayers in at least a dozen countries, including Russia in 2001 and Ukraine in 2003, but not Poland. The impact of the flat tax, especially in Russia, on tax collection especially has been questioned within the literature, although Ukraine changed to the same flat rate two years later as well. As part of a package of tax reforms passed in 2000, Russia introduced a flat 13 per cent personal income tax (PIT) rate, which replaced the earlier 12, 20 and 30 per cent tiered rates. The following year, the revenues from PIT increased 46 per cent in nominal and 26 per cent in real terms, from 2.4 per cent to 2.9 per cent of GDP. PIT revenues increased another 3.3 per cent in the following year.Footnote 122 Of the over a dozen countries that adopted the flat tax in the region, Appel has stated that IMF calculations in 2006 showed only Latvia, Lithuania and Russia to have seen an increase in revenue in the year following adoption.Footnote 123
While some have claimed that the increases in tax collection in 2001 and 2002 were due to the lowering of tax rates, particularly with the introduction of a flat personal income tax rate,Footnote 124 it is very unclear whether the increases in income tax collection in Russia were mainly due to tax rate reduction. The IMF has stated that the increase was caused by the expansion of the tax base, tightening control over tax minimization schemes, primarily insurance schemes, high global oil prices and real growth in incomes.Footnote 125 In addition, the IMF also has observed that in 2001 tax performance ‘exceeded expectations across the board, even more so for taxes other than the PIT’.Footnote 126
Vahram Stepanyan at the IMF, moreover, has written that ‘there seems to be little evidence of a substantial improvement in personal income tax revenues that resulted simply from a reduction in the top marginal tax rates’.Footnote 127 He points out that PIT revenues did in fact increase from the year 2000 to the year 2001, but only from 2.5 to 2.6 per cent of GDP. Moreover, he also points to changes in revenue sharing agreements between the federal and local governments that might have given the local governments more of an incentive to enforce PIT administration better.Footnote 128
Mikhail Pryadilnikov and Elena Danilova write that the increase in tax revenue in the immediate years after the 2000 tax reforms was due to a combination of reforms and factors, and not to the rate changes alone. Accompanying changes to the Tax Code, rates and tax administration structure, they write that ‘the Tax Service began a rapid effort to expand the registration of individual taxpayers. It rolled out its plans in a massive advertising campaign filling every Russian town with billboards explaining the importance of paying taxes on time. The agency also offered amnesty to individual taxpayers and expanded its staff to cover the anticipated increase in individual declarations. These initial efforts worked.’Footnote 129 Appel also concurs that the flat tax was part of a broader series of reforms. ‘At the same time as the flat tax took effect, the Russian government issued taxpayer identification numbers, eliminated ceilings for overdue taxes, increased significantly the legal authority of the tax administration, and bolstered the state apparatus’, she writes. ‘Social insurance taxes were lowered, and there were changes to corporate taxes and later energy taxes…Given the simultaneity of reforms, scholars have found it nearly impossible to calculate the effect of the flat tax on revenue or growth.’Footnote 130 Moreover, Alexeev and Conrad conclude that after the initial improvements in the immediate years following 2000–2001, ‘the situation has deteriorated considerably a few years later, particularly in terms of tax administration’Footnote 131 and that the 2000 tax reforms ‘had only marginal effects on tax effort and perceptions’.Footnote 132
To sort through the impact of the flat tax rate, particularly in light of the overall 2000 package of tax reforms, Anna Ivanova, Michael Keen and Alexander Klemm undertake several statistical analyses to determine whether the increased tax revenue was a consequence of the tax rate changes themselves, only to find that it is unclear whether the increased compliance came from the reforms themselves or the methods of enforcement.Footnote 133 Gorodnichenko, Martinez-Vazquez and Peter (2009), however, find that lowering tax rates can, in some situations, reduce the level of tax evasion, using indirect methods to measure tax evasion, but that the Russian flat tax did not lead to much of an increase in economic productivity on the supply side.Footnote 134 Appel has argued that ‘Certainly a large portion of growth in GDP and income tax revenues can be traced to the surge in gas and oil prices. For example, speaking to the efficacy of the Russian tax reform, the IMF's representative in Moscow attributed 80 per cent of the increase in Russian revenues in 2001 to the strength of the oil and gas sector.’Footnote 135 Hence, the data and findings on whether the flat tax rate led to increased tax compliance are mixed and still up for debate, largely because of other factors and reforms that took place simultaneously.
Yet, if changing marginal rates were to have an effect on compliance, one would expect at the individual level that attitudes towards compliance would be responsive to the lowering of rates. Yew, Milanov and Gee find in their study over a three-year period that the major changes in Russia's tax structure in 2001 did not impact individual tax morale.Footnote 136
But, how sensitive are attitudes on tax compliance to tax rates? The 2010 and 2015 Taxpayer Compliance Attitudinal Surveys help provide an answer by asking questions regarding how Poles, Russians and Ukrainians perceive tax rates. First, being reactive to low or high rates requires that one know exactly what the rate is. In 2010, in Poland, of those who knew the personal income tax rate (see Question #36 in Appendix I), only 6 respondents stated that they would not obey a tax law even if they thought it was unfair (Question #22), while 72 stated that they would – that is, 92 per cent of those who knew the tax rate stated that they would comply with tax laws, much higher than for the general population as a whole (77 per cent). That same year in Russia, 46 per cent (or 1160 respondents) knew their personal income tax rates, and 750 (or 65 per cent) of them stated that they would obey a tax law even if it were considered personally unfair – a figure higher than the 52 per cent who stated in Question #22 that they would obey. Further, in Ukraine, in 2010, of those who knew the correct personal income tax rate, 220, or 62 per cent, stated that they would obey tax laws even if they found them to be unfair; and in 2015, 249, or 57 per cent, stated the same. Hence, if being sensitive to the tax rates requires individuals to know what those tax rates currently are, then the data from these surveys suggest that those who do know are quite supportive of complying with the law, regardless of the rate.
In addition, the Taxpayer Compliance Attitudinal Surveys also inquire whether respondents are supportive of lowering the tax rates (see Question #38 in Appendix I). If lowering tax rates is to have an impact on tax compliance, then, presumably, those who supported lowering the rates for the personal income tax (as opposed to increasing, modifying or cancelling outright the PIT) would be less likely to support obeying tax laws even if they disagreed with them. In 2010, in Poland, of those who supported lowering the PIT, 777 respondents, or 85 per cent, said they would obey – a bit higher than the 77 per cent who answered Question #22 directly. In Russia the same year, 553 respondents, or 58 per cent of those who called for lowering the PIT rate, stated that they would obey – higher as well. And, in Ukraine, of those who wanted to lower the PIT rate, 851 respondents, or 56 per cent, in 2010, and 987 respondents, or 57 per cent, in 2015, stated that they would obey tax laws regardless as to whether they perceived them as unfair – again, figures that are higher than when survey respondents were asked about their attitudes towards compliance outright. Hence, from these surveys, there is no evidence to suggest that those who either knew their tax rates or wanted them lowered were more supportive of being non-compliant then the general population as a whole; in fact, the opposite appears to be true.
Finally, even if lowering tax rates makes taxpayers comply more because they recognize that their obligations are cheaper and that the state recognizes a need for them to retain more of their income, no state can, of course, continuously decrease rates to bring in more taxpayers and revenue. At some point, there is a limit to how low taxes can go, and to improve tax collection, other factors – including especially those focused on the tax administration and its procedures and behaviours – matter greatly.
In spite all of the variation in tax rates, tax policies, tax laws and economies over the past two and a half decades, or perhaps in part because of all of the rapid changes taking place in transition societies, an environment of instability was created for both taxpayers and the tax administration, producing uncertainty and inefficacy in fulfilling their respective tasks. Reforming the tax regimes and adopting new laws may have been easier than building and reforming the new tax administrations. Yet, for some transition states, such as Russia and Ukraine, an insufficient amount of the latter may be causing greater problems for the tax system. ‘[T]he way tax inspectors interact with taxpayers needs to be reformed far more than taxes per se or tax rates’, reported Ukrainian Week. ‘This, in fact, is the most complicated aspect of reforms and the most challenging task facing Ukraine's reformers. In order to attain a balance that would prevent individual tax officials from interpreting legislation as they please, to demand a bribe or to power trip, while taxpayers get to pay a fair rate, the system needs to be changed from within.’Footnote 137
Moving forward, the next chapter will begin to unpack the understudied tax administrations, while Chapters 6 and 7 will look more carefully at the impact of different approaches by the tax state to taxpayers at the individual level.
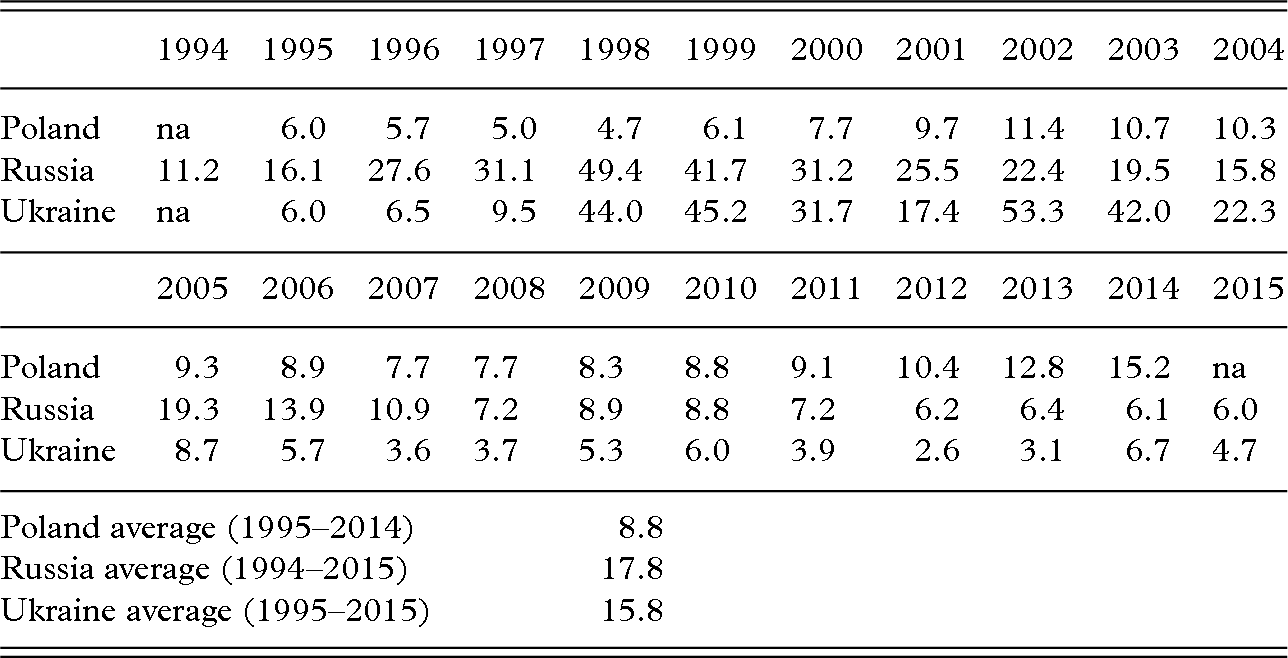


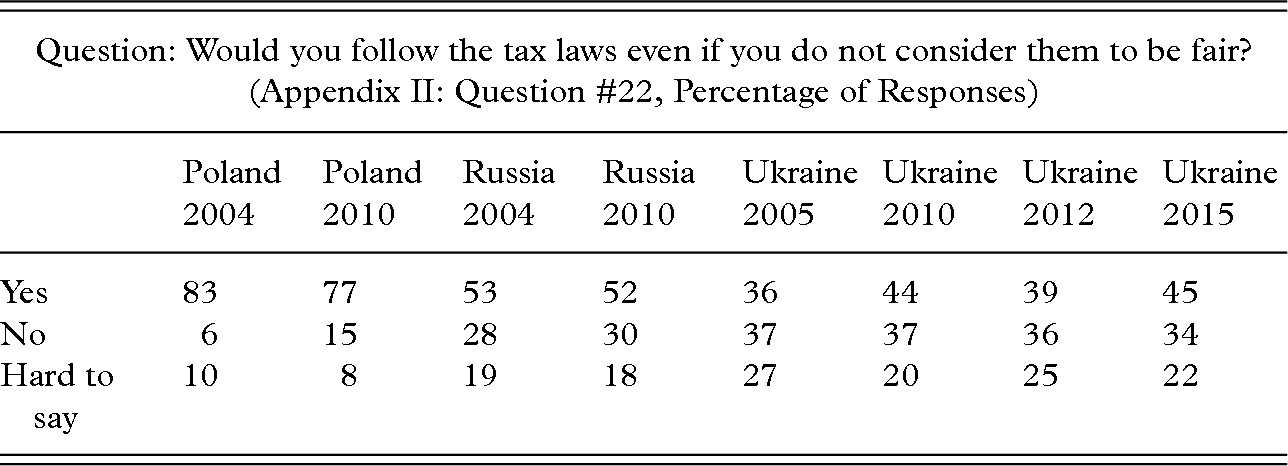
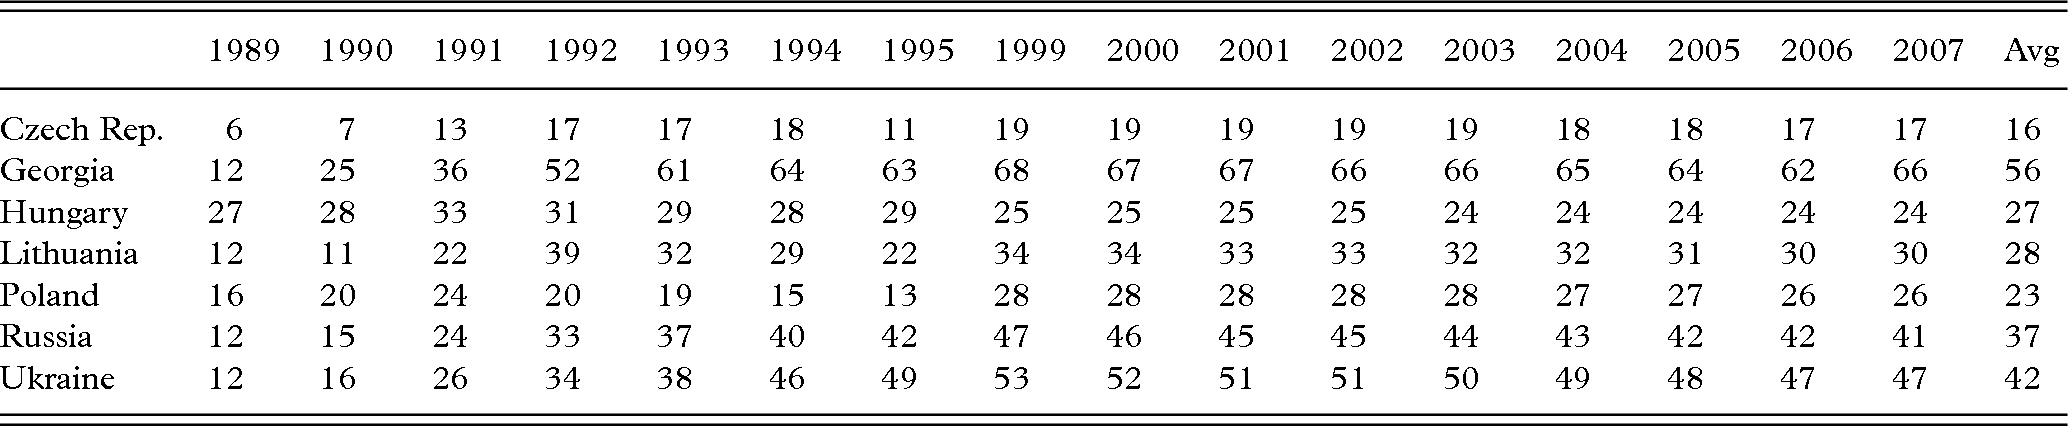


 Open access