


Accountability is at the center of many social-scientific and policy debates (WBI 2005). Indeed, accountable institutions are a target of Sustainable Development Goal 16 (UN Resolution: A/Res/70/1). However, analyzing accountability cross-nationally faces two impediments. First, the concept is “overstretched” (Lindberg Reference Lindberg2013). Second, the only cross-national accountability index (the World Bank Voice and Accountability Index, WBGI VA) has limited temporal coverage and is conceptually inconsistent and opaque (Apaza Reference Apaza2009; Langbein and Knack Reference Langbein and Knack2010; Thomas Reference Thomas2010).
We present both a conceptual framework and empirical measures of accountability that address these shortcomings. We define accountability as de facto constraints on the government’s use of political power through requirements for justification of its actions and potential sanctions. We further organize accountability by subtypes, using the common distinction between vertical and horizontal accountability and including a third subtype, diagonal accountability.
The advantages of our measures are fourfold. First, we use an innovative Bayesian modeling strategy to create indices for all three accountability subtypes and an overall accountability index. This strategy allows us to deal with both systematic missingness and the nested structure of the data, issues common in cross-national indices. Second, the indices have unprecedented coverage (virtually all countries from 1900–2016) and will be updated yearly. Third, they allow researchers to differentiate between subtypes of accountability.
Fourth, we demonstrate the validity of the new accountability measures by following Adcock and Collier’s (Reference Adcock and Collier2001) framework. We show content validity by demonstrating that our measures align with our specific conceptualization of accountability, and we show convergent validity by illustrating that they have theoretically expected relationships with related measures. Finally, we demonstrate construct validity by showing that the measures of accountability produce theoretically expected results in regression analyses, while the WBGI VA does not.
Existing Measures of Accountability
The WBGI VA is the only accountability index with worldwide coverage, from 1996 onwards. It is an aggregation of perception-based indicators from various sources (Kaufmann, Kraay, and Mastruzzi Reference Kaufmann, Kraay and Mastruzzi2010), and the number of sources per observation varies between one and 19. This structure has led to criticism that the index lacks conceptual consistency and validity (Apaza Reference Apaza2009; Langbein and Knack Reference Langbein and Knack2010; Thomas Reference Thomas2010).
Other accountability indices are limited in either cross-national coverage or the aspect of accountability they cover. For example, Williams (Reference Williams2015) provides a measure of accountability and transparency that covers a limited number of countries, 1980–present. The Global Integrity Report (2011) includes a set of indicators on government oversight, electoral integrity, and anticorruption, but it covers only 33 countries in 2016. The World Bank’s IDA Resource Allocation Index also provides some information on horizontal and social accountability, but only for 72 countries (IDA 2016).
Therefore, scholars have used indices of democracy—a broader concept than accountability—as proxies for accountability (Adsera, Boix, and Payne Reference Adsera, Boix and Payne2003; Gerring, Thacker, and Alfaro Reference Gerring, Thacker and Alfaro2012; Harding and Wantchekon Reference Harding and Wantchekon2010).
Conceptualizing Accountability
Accountability is a relationship between two actors, where “A is accountable to B when A is obliged to inform B about A’s … actions and decisions, to justify them, and to suffer punishment in the case of eventual misconduct” (Schedler, Diamond, and Plattner Reference Schedler, Diamond and Plattner1999, 17). We build on this definition by discussing three related issues: (1) to whom a government is accountable, (2) for what it is accountable, and (3) how it is held accountable.
(1) Accountability to whom? We focus on the accountability of the executive branch of the government to citizens, which is a principal–agent problem (Bovens Reference Bovens2007). Oversight bodies, such as the judiciary and the legislature, act simultaneously as the citizen’s agents and as principals in overseeing the executive. The media and civil society have a distinct, intermediary role in this context. They have not delegated power to the government and thus are not principals in a strict sense. However, they contribute to accountability by extracting and amplifying information, helping address the information asymmetry between the government and its principals (Mechkova et al. Reference Mechkova, Lührmann and Lindberg2019).Footnote 1
(2) Accountability about what? Accountability constrains the government’s use of power (Lindberg Reference Lindberg2013), which entails both preventing illicit behavior and evaluating politicians’ performance (Goetz Reference Goetz2008). Accountability thus helps citizens ensure that governments are responsive to their interests (WBI 2005).
(3) How is accountability enacted? Accountability has two main dimensions: answerability and enforcement (Schedler, Diamond, and Plattner Reference Schedler, Diamond and Plattner1999). The former includes the oversight of governments, while the latter involves rewarding good behavior and punishing undesired behavior (Goetz Reference Goetz2008). Some institutions operate on only one of these dimensions (Lindberg Reference Lindberg2013). For example, while journalists can provide information about government misconduct, they cannot impose penalties (Bovens Reference Bovens2007). In contrast, institutions of vertical accountability mainly concern enforcement.
The preceding discussion leads us to define accountability as de facto constraints on the government’s use of political power through requirements for justification of its actions and potential sanctions by both citizens and oversight institutions.
This conceptualization of accountability is distinct from classic descriptions of democracy, which focus on how citizens use elections to hold politicians accountable (Schmitter and Karl Reference Schmitter and Karl1991). There is substantial variation in the degree to which accountability actors other than voters constrain governments; such institutions can also exist in nondemocratic states (Lindberg Reference Lindberg2013).
Operationalization of Accountability
Since multiple actors enact accountability, we organize accountability into subtypes based on the spatial direction between its actors (Lindberg Reference Lindberg2013). Specifically, we operationalize accountability as three distinct subtypes: vertical, horizontal, and diagonal. Vertical accountability is a relationship between unequals (the government and citizens), while horizontal accountability is a relationship between more or less equal institutions (different branches of government; O’Donnell Reference O’Donnell1998). Diagonal accountability represents the extent to which actors outside of formal political institutions (e.g., the media and civil society) hold a government accountable. We follow Goetz and Jenkins (Reference Goetz and Jenkins2001) in describing this form of accountability as “diagonal,” as opposed to “social” (Malena and Forster Reference Malena and Forster2004), because its success ultimately depends on other accountability institutions (Mainwaring and Welna Reference Mainwaring and Welna2003). Figure 1 presents these relationships.
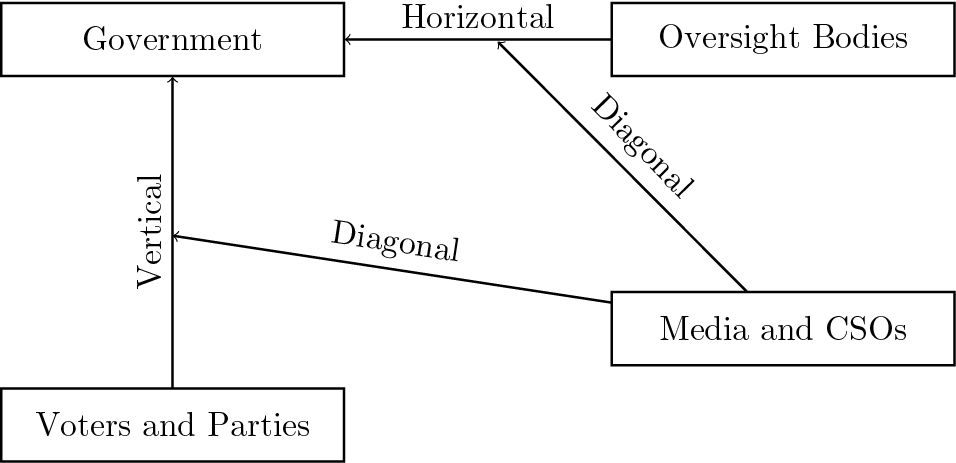
FIGURE 1 Relationship of Accountability Subtypes
Aggregation Strategy
Measuring accountability necessitates a strategy that diverges from standard latent variable techniques (Bernhard et al. Reference Bernhard, Jung, Tzelgov, Coppedge and Lindberg2017; Pemstein, Meserve, and Melton Reference Pemstein, Meserve and Melton2010; Treier and Jackman Reference Treier and Jackman2008). Specifically, we deal directly with two issues common to indices that use cross-national panel data.
First, latent concepts such as accountability have a hierarchical structure: accountability is manifested in its subtypes, which are themselves latent concepts manifested in a combination of subconcepts (e.g., “civil society”) and manifest variables (e.g., “elected executive”). We explicitly model this hierarchical structure, thereby allowing it to inform our latent concept estimates. Because such hierarchical latent variable modeling strategies inherently involve prior information, we employ a Bayesian estimation approach.Footnote 2
Second, data regarding some de facto phenomena are systematically missing because the institutions they capture do not exist. For example, free and fair elections do not exist in countries without elections. Since the existence of these institutions itself is important to accountability, we use structural modeling techniques to condition the relationship between de facto indicators and accountability on the presence of the institutions.
Because our conceptualization of accountability relies on the de facto activity of political institutions, we use indicators from the V-Dem dataset to construct our indices (Coppedge et al. Reference Coppedge, Gerring, Lindberg, Skaaning, Teorell, Altman and Bernhard2017). V-Dem uses experts to code such difficult-to-observe activities, which the project aggregates using an item-response theory model (Pemstein et al. Reference Pemstein, Marquardt, Tzelgov, Wang and Miri2015).
Vertical Accountability
Vertical accountability (Figure 2) regards the ability of a state’s population to hold its government accountable through elections and political parties (Schedler, Diamond, and Plattner Reference Schedler, Diamond and Plattner1999). Electoral accountability includes (1) election quality, (2) enfranchised population share, and (3) whether the chief executive is subject to direct or indirect elections. To measure election quality, we take into account (a) whether there are elections and (b) if so, the degree to which elections reflect the people’s will. Specifically, we model the quality of elections as a function of the presence of elections, assuming that a polity without elections has a lower level of vertical accountability than a polity with elections. We measure election quality by using seven variables that are directly related to this concept.Footnote 3

FIGURE 2 Vertical Accountability
We load the remaining two election-related variables (suffrage and elected executive) directly into the vertical accountability index. This strategy accords with our a priori belief that each of these electoral aspects is equally important to vertical accountability.
Finally, since political parties can incentivize accountability by ensuring that politicians follow a political program and abstain from activities that hurt the party’s reputation (Gehlbach and Keefer Reference Gehlbach and Keefer2011; Svolik Reference Svolik2012), we incorporate party quality into vertical accountability as a latent concept manifested in three relevant indicators.
Horizontal Accountability
Horizontal accountability (Figure 3) represents the extent to which state institutions hold the executive branch of the government accountable. This form of accountability requires the existence of institutions—legislative and judicial branches, and other oversight agencies—that can demand information and punish improper behavior (O’Donnell Reference O’Donnell1998; Rose-Ackerman Reference Rose-Ackerman1996).

FIGURE 3 Horizontal Accountability
We incorporate judicial oversight into horizontal accountability as a nested latent variable with four manifest variables, using the same strategy as for party quality in vertical accountability. To measure the ability of a legislature to hold the government accountable, we incorporate two manifest variables capturing this concept. Since polities without legislatures are unable to implement this form of accountability, we model the degree to which the legislature holds the executive branch accountable as a function of the existence of a legislature.
We directly load two additional manifest variables into the model: executive self-restraint and the degree to which state bodies (e.g., an ombudsman) investigate an executive’s activities.
Diagonal Accountability
Diagonal accountability (Figure 4) reflects the contribution of non-state actors to accountability. Civil society organizations, an independent media, and engaged citizens can use a broad range of actions to provide and amplify information about the government, thereby holding it accountable (Grimes Reference Grimes2013; Malena and Forster Reference Malena and Forster2004). For example, media reporting can help principals such as voters and legislatures make informed choices (Voltmer Reference Voltmer and Norris2010), and civil society organizations can directly pressure the government to change a specific policy (Peruzzotti and Smulovitz Reference Peruzzotti and Catalina2006).

FIGURE 4 Diagonal Accountability
We model this form of accountability as being manifested in six variables on media freedom, three variables regarding civil society characteristics (the V-Dem civil society core index; Bernhard et al. Reference Bernhard, Jung, Tzelgov, Coppedge and Lindberg2017), four variables of freedom of expression, and one variable related to citizen engagement with politics. We model all concepts except for citizen engagement as hierarchically nested latent variables.
Accountability
We create a composite measure of accountability using a hierarchical latent variable model, clustering indicators and concepts by type of accountability (Figure 5). This strategy assumes that accountability is a function of all of the indicators that were described in the previous sections, though our conceptualization of accountability subtypes structures this relationship.

FIGURE 5 Accountability
This model assumes that the different subtypes of accountability are largely complementary. However, in some cases principals disagree and thereby weaken each other, instead of constraining the government (Voorn, van Genugten, and van Thiel Reference Voorn, van Genugten and van Thiel2019). Since our data reflect de facto institutions, weakness in any subtype will result in lower scores, regardless of the source of the weakness—be it conflict between accountability institutions or a lack of independence or capacity (Appendix E.2).
Validation
Since the true values of any latent concept are unknown (McMann et al. Reference McMann, Pemstein, Seim, Teorell and Lindberg2016), we validate our indices by using content, convergent, and construct validation procedures (Adcock and Collier Reference Adcock and Collier2001).
Content Validation
Content validation concerns the alignment of a measure with its underlying concept (Adcock and Collier Reference Adcock and Collier2001). In addition to the detailed operationalization and conceptualization in previous sections, we emphasize two points to this end. First, the V-Dem data that we use closely match our theoretical framework, representing a major step forward from earlier indices of accountability. Second, our measures capture empirically important variation in accountability at both the cross-national and country levels over time.
Global Development of Accountability over Time
Our indices cover 177 polities from 1900 to 2016 (descriptive statistics in Appendix D). Figure 6 illustrates the cross-national average level of different forms of accountability over time, which tracks the waves of democratization and concomitant social and economic changes (Huntington Reference Huntington1993).

FIGURE 6 Accountability Indices Global Mean 1900–2016
While their broad trends are similar, the subindices of accountability evolve differently over time. For example, the global mean of horizontal accountability begins a period of largely upward movement only in the late 1980s, after the fall of Communist regimes in Eastern Europe. However, this increase is less pronounced than the changes in diagonal and vertical accountability are, since horizontal accountability mechanisms take more time to develop after a political transition (Mechkova, Lührmann, and Lindberg Reference Mechkova, Lührmann and Lindberg2019).
Appendix F.1 presents additional analyses of accountability trends in the BRICS countries and a liberal democracy (France). These cases demonstrate how the three subtypes of accountability evolved in different patterns in individual countries. A case in point is the transition from apartheid in South Africa. Horizontal accountability began improving in 1984, reflecting attempts to reform from above. However, diagonal accountability only began increasing in 1990 after the release of political prisoners and negotiations for a new constitution. Higher scores for vertical accountability were not achieved until after the 1994 elections.
Case-level Variation in Accountability Subtypes
Figure 7 illustrates the relationship of accountability subtypes across countries in 2016. The gray lines show the 2016 world average. Countries with high levels on a given index tend to have high values across indices; variation across subtypes is more widespread among countries with lower levels of accountability. For instance, regimes with highly flawed elections or no elected executives have low levels of vertical accountability (e.g., Eritrea and China; Figure 7a). However, these countries exhibit varying levels of horizontal and diagonal accountability. For example, China has a more active civil society and a stronger rule of law than Eritrea does, so it scores slightly higher on these dimensions (Figure 7a and 7c).

FIGURE 7 Relationship Between Accountability Subindices
Bangladesh and Iran are also both on the lower end of the accountability spectrum. However, horizontal accountability scores for Iran are relatively high, reflecting its comparatively strong oversight bodies (Figure 7a). Conversely, Bangladesh has a low horizontal accountability score, whereas its level of diagonal accountability is close to world average due to its relatively powerful civil society (Figure 7b).
Convergent Validation
Convergent validation strategies assess correlation with other indices that measure similar concepts (Adcock and Collier Reference Adcock and Collier2001). Here we do so by analyzing the relationship of our accountability indices to (1) each other, (2) other accountability indices, and (3) democracy indices (detailed analyses in Appendix F.2).
Since we conceptualize all three accountability subtypes as part of a larger concept (accountability), they should strongly correlate with each other. Since diagonal accountability bridges and enhances horizontal and vertical accountability, it should correlate more strongly with these two subtypes of accountability than they do with each other. Indeed, the correlation between horizontal and vertical accountability is the weakest (0.72), while the correlations between diagonal and both vertical and horizontal accountability are relatively high (0.83 and 0.82, respectively). Diagonal accountability also has a stronger correlation with the overall accountability index (0.97) than does either horizontal or vertical accountability (0.88 and 0.91, respectively). This correlation structure analytically follows from diagonal accountability’s strong correlation with the other subtypes.
We also expect a strong correlation between our indices and existing measures of accountability. Indeed, the WBGI VA correlates strongly with our accountability measures. Its highest correlation is with the overall accountability index (0.92), and the lowest is with horizontal accountability (0.85). This finding enhances the convergent validity of our indices because the WBGI VA includes measures of election quality, media freedom, and civil and political rights, which overall accountability captures but horizontal accountability does not.
Finally, we expect a high correlation between measures of accountability and democracy because they are closely-linked concepts. However, different subtypes of accountability should correlate more highly with some measures of democracy than with others, in line with the particular concepts these measures estimate. For example, the Freedom House/Polity combined measure includes concepts related to vertical and diagonal accountability and thus correlates more strongly with these subtypes (0.88 and 0.90, respectively) than with horizontal accountability (0.82).
Construct Validation
Construct validation involves demonstrating that a new measure yields theoretically expected results (Adcock and Collier Reference Adcock and Collier2001). Since many scholars argue that accountability improves human development (Gerring, Thacker, and Alfaro Reference Gerring, Thacker and Alfaro2012; Miller Reference Miller2015; WBI 2005), we use a key human development outcome (infant mortality) for this validation. We only present results for the accountability index; subtype analyses yield similar results (Appendix F.3).
Data and Analysis
We use data from Miller (Reference Miller2015), who proxies accountability with categorical indicators of regime type. He finds that democracies achieve better development outcomes than autocracies do and that, among autocracies, countries with elections perform better. We largely replicate his analysis, estimating an ordinary least squares model with year- and country-fixed effects and using the same controls. Our models diverge from Miller’s in that we (1) substitute measures of accountability and democracy for his categorical indicators and (2) add a measure of corruption in the model because corruption can hinder human development (Holmberg and Rothstein Reference Holmberg and Rothstein2011).
Figure 8 presents the estimated relationships between accountability and infant mortality (full results in Appendix F.3). Figure 8a shows the predicted number of deaths per 1,000 births at different levels of accountability. The results indicate that accountability has the theoretically expected strong negative correlation with infant mortality. In contrast, Figure 8b illustrates the results from a model that instead includes the WBGI VA index; WBGI VA evinces a weak positive correlation with infant mortality, the opposite of theoretical expectations. Figure 8c presents the estimated relationship between infant mortality and both our accountability index (left) and the WBGI VA (right) from a model including both variables. Given the high correlation between the two indices and low coverage of the WBGI VA, the magnitude of the relationship between the accountability index and infant mortality is much diminished; however, its coefficient is in the expected negative direction.
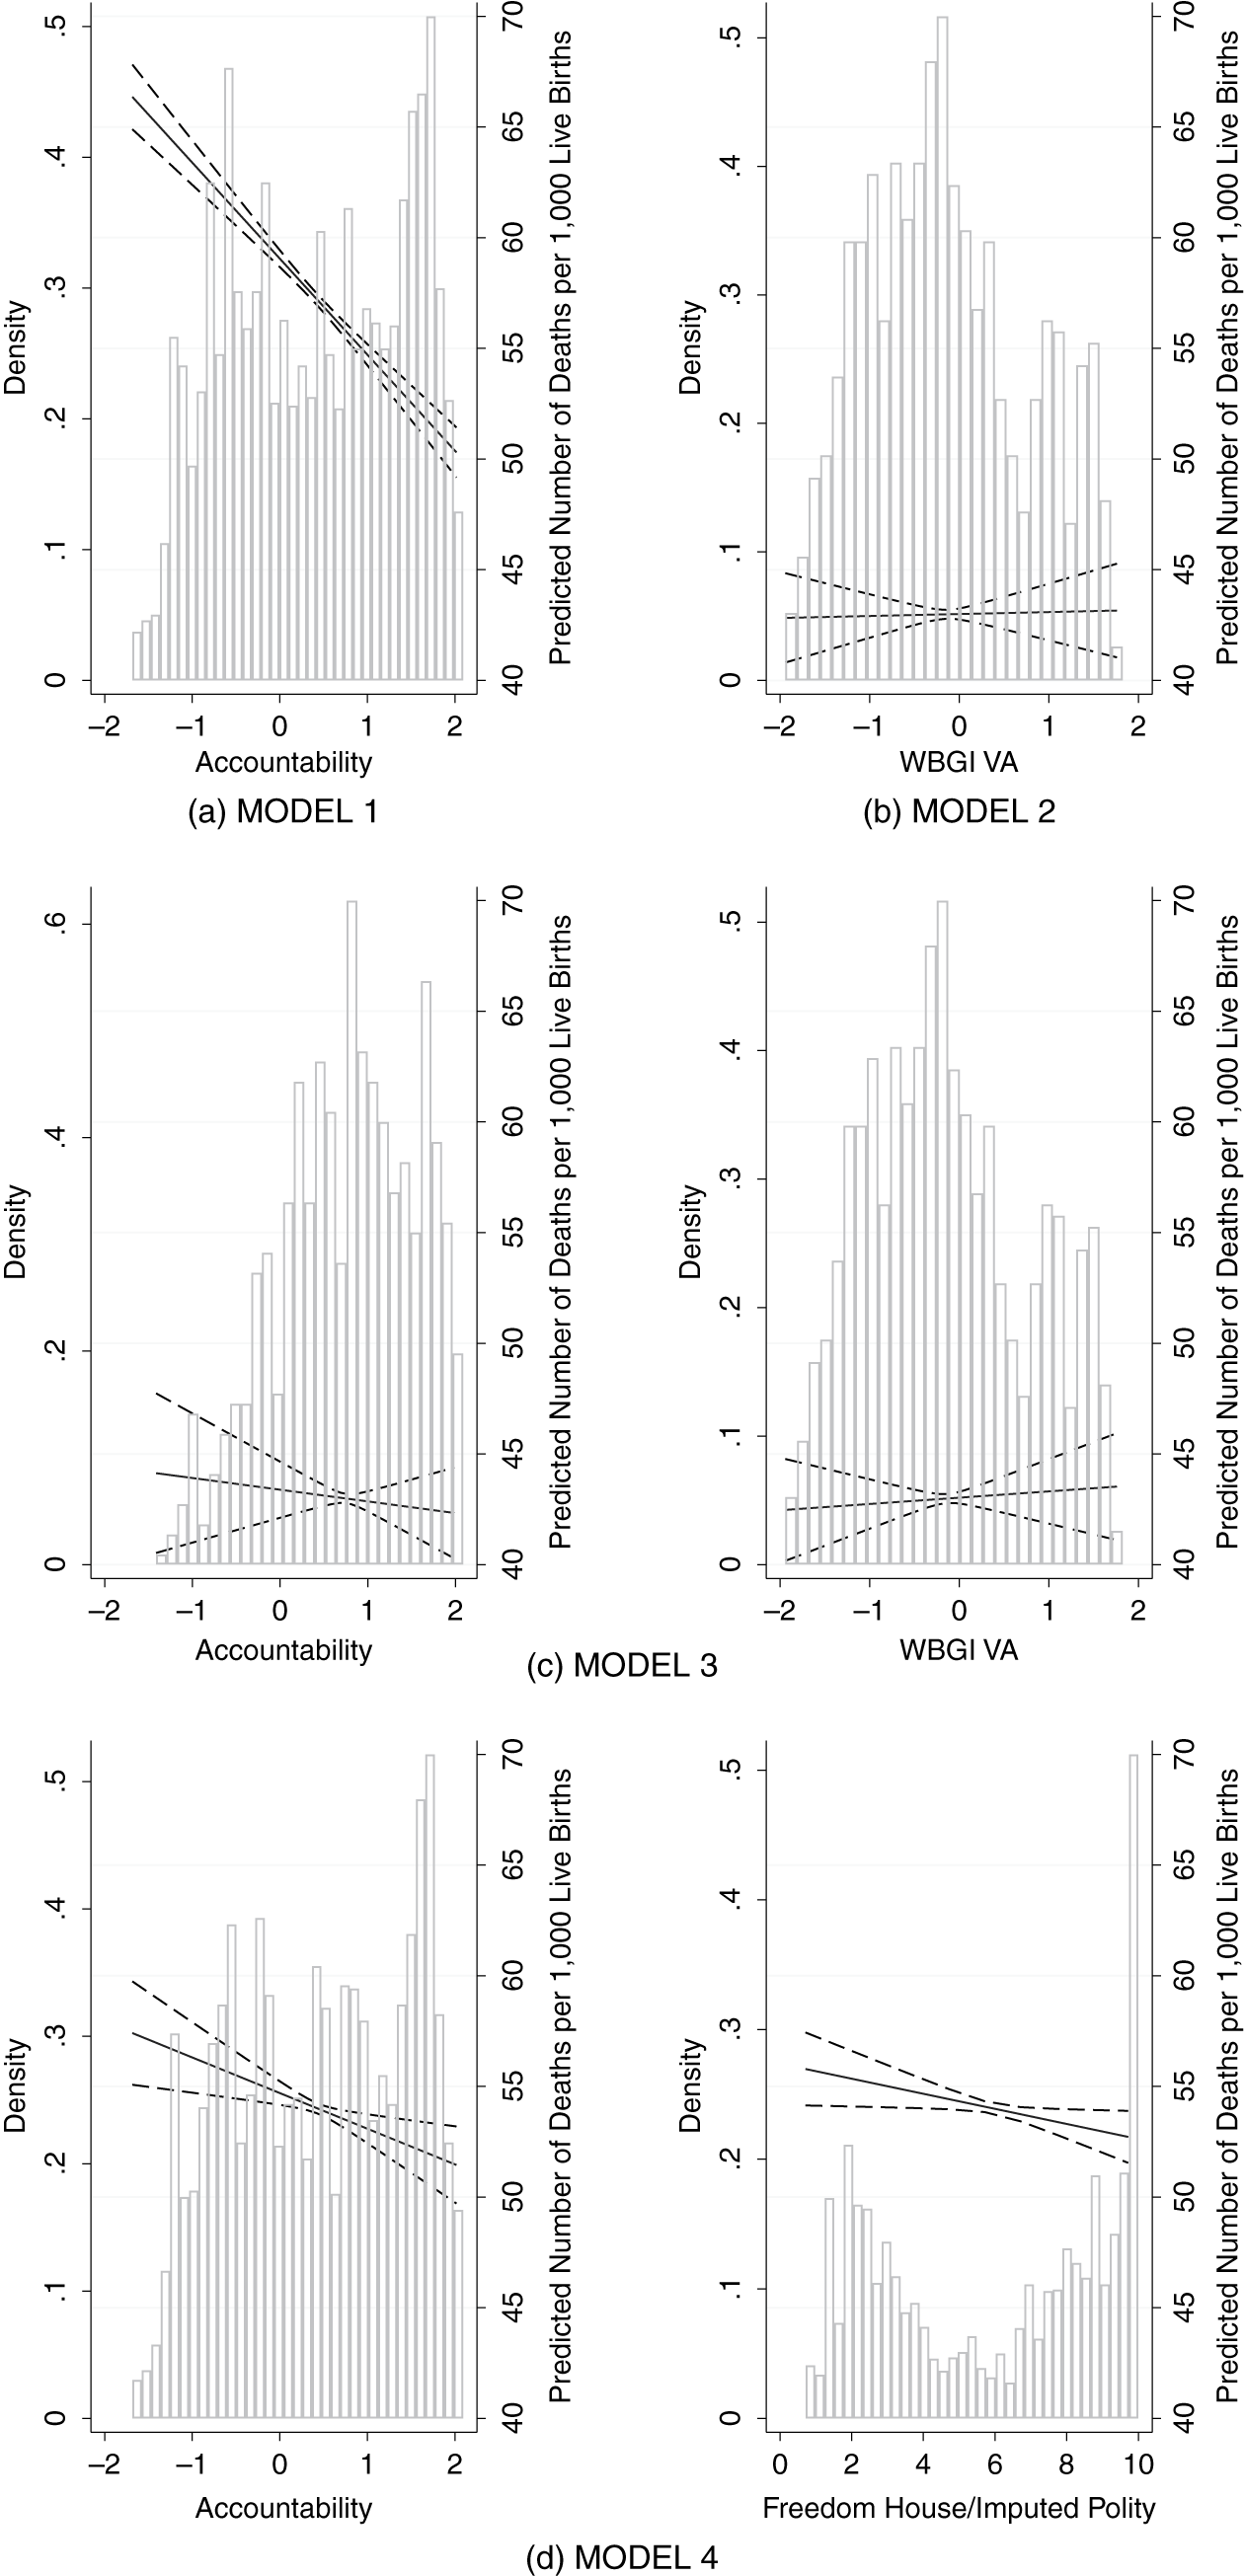
FIGURE 8 Relationship Between Accountability and Infant Mortality
Figure 8d presents the results from a regression analysis that includes both our accountability index and Freedom House/Polity combined measure. Both democracy and accountability show a negative and substantively strong relationship with infant mortality, indicating that our conceptualization of accountability is both meaningful and different from democracy.
Conclusion
Accountability is essential to effective governance. However, researchers and policymakers lack valid cross-national measures of this concept. The indices we present in this paper fill this gap, using an innovative measurement strategy to provide conceptually rigorous and empirically valid measures of accountability. Moreover, our hierarchical operationalization of accountability will allow researchers to work at both disaggregated and aggregate levels. For instance, scholars can use the subtype indices to test Dahl’s (Reference Dahl1971) assumption that institutional stability benefits if horizontal accountability evolves before vertical accountability. Researchers can also use the overall accountability index to assess accountability’s relationship with vital outcomes such as democratic backsliding and corruption.
Supplementary Materials
To view supplementary material for this article, please visit http://dx.doi.org/10.1017/S0003055420000222.
Replication files are available at the American Political Science Review Dataverse: https://doi.org/10.7910/DVN/TI7ORN.


 Open access
Comments
No Comments have been published for this article.